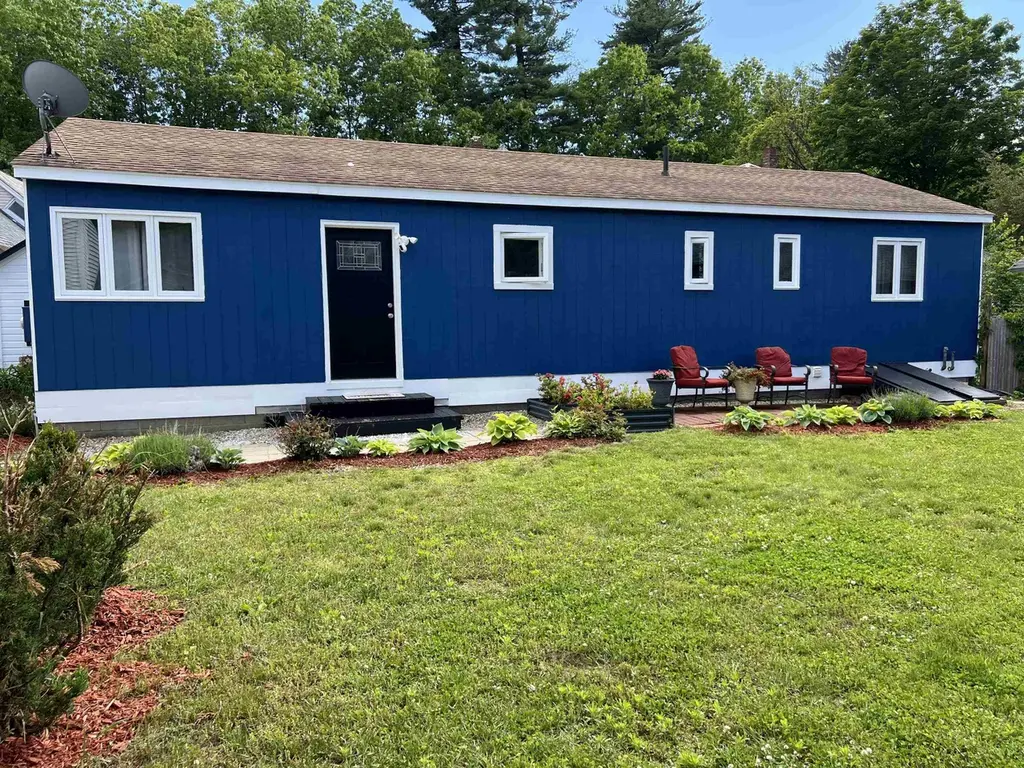
111 Central St · Brattleboro, VT
Flood risk 1/10 · Minimal
- FEMA flood zone
- X (unshaded)
- Chance of flooding over 30 yrs
- 0.0%
- Est. flood insurance / yr
- $473 – $860
Fire risk 1/10 · Minimal
- Est. fire insurance / yr
- $480 – $892
Heat risk 3/10 · Minor
- Hot days now (above 94°F)
- 7 days/yr
- Hot days in 30 yrs
- 17 days/yr
Wind risk 4/10 · Minor
- Chance of severe wind over 30 yrs
- 9.0%
Air-quality risk 2/10 · Minimal
- Unhealthy air days now
- 0 days/yr
- Unhealthy air days in 30 yrs
- 1 days/yr
Risk factors via First Street. Map © Google.
Why this score? — see what drove the D grade
The composite is a weighted blend of 9 inputs, each scored 0–100. Each bar is that input's sub-score; the figure is the points it added to the 100-point composite (weight × sub-score).
- Cash flow +13.6/30.0
- ARV discount +8.3/15.0
- Schools +5.0/10.0
- DSCR +4.1/10.0
- Livability +3.4/5.0
- 1% rule +2.8/10.0
- Rent growth +2.5/5.0
- Condition / age +2.5/5.0
- Appreciation +0.0/10.0
$270,000
🖨 Deal sheet (PDF) 📄 Offer letter ✓ Due diligence
Listing remarks MLS
Affordable! If you're looking for aging in place, downsizing or your first home this is a great choice. One level living with laundry tucked in it's own little nook, huge master bedroom, generous bath and a center kitchen. The living/dining is east facing and gets lots of light. Fresh new interior paint, hard wood floors, new roof. There is a nice level yard for some great gardening and 2 parking spaces for easy, off street parking. This is all you need in an easy living, easy maintenance package. A must see for affordability. Interior photos were taken prior to tenant occupying property. Tenant has a lease until June 1st. No possession prior to June 1st.
Key facts
- 3,484 sq ft lot
- Built 1979
- Listed 7 days
Property features AI
Finance
- Other: Property surveyed status unknown
Exterior
- Parking: Driveway composed of crushed stone, dirt, and gravel
- Utilities: Public water; Public sewer; Circuit breaker electrical service; Fiber optic and high-speed internet available; Cable available
- Home design: Ranch-style home; Blue exterior; Existing construction
- Construction: Wood frame construction; Shingle (asphalt) roof; Built in 1979
- Exterior features: Landscaped, level lot; In-town location close to paths, shopping, public transportation, hospital, and schools; Easements present
Interior
- Kitchen: Kitchen on main level
- Bedrooms: Three bedrooms (all on main level); Bedroom dimensions include 16.11 x 11.9, 10.6 x 9.5, and 10.6 x 9.5
- Flooring: Vinyl flooring; Wood flooring
- Bathrooms: One full bathroom (main level)
- Heating & cooling: Oil-fired baseboard heat
- Interior features: Five total rooms; Walkout basement with bulkhead and concrete floor
- Laundry & utility: Washer and dryer included; Water heater (off boiler) — owned
Neighborhood map
What this means for you Summary
Snapshot
- This is a 3-bed/1.0-bath single-family listed at $270k.
Deal economics
- At list price, monthly cash flow is $13 ($152/yr) — positive.
- The deal already cash-flows at list — no discount required.
- To meet the 1% rule (rent ≥ 1% of price), the offer needs to be $212k (21.6% below list).
- Recommended offer: $212k (21.6% below list) — sets the bar for 1% rule.
- Cap rate 6.3% vs local median 4.5% in Brattleboro — top-decile yield for the area; either an underpriced asset or a hidden risk that comps aren't pricing in. Stress-test before assuming the spread holds.
Location & tenants
- Location reads 67/100 on livability (#42 in VT) — a middle-class / working-renter tenant base. Strengths: health & safety A+, cost of living B; Watch: crime F, amenities D-, commute F.
- Zoned schools: Brattleboro Area Middle School (math 28% / reading 53%, grade F, #13 of 26 statewide, top 52%, 262 students, 38% FRL).
- Market conditions: 80 active listings in the ZIP; 4 comparable units currently listed for rent nearby; rentals at typical pace (median 16d on market — plan ~3-4 weeks tenant-placement turnaround); 188 units permitted in Windham County in 2024 (0 in 5+ unit buildings).
- This rent runs 39% of the median local income ($66k/yr) — at the standard rent-burdened threshold; future hikes will face affordability resistance.
Forward outlook
- Local home prices are declining (-3.0%/yr); year-one equity from $2k of loan paydown is wiped out by about $8k of value loss. Plan a longer hold.
- Windham County population projected at -26% by 2050 — secular population decline; favor cash flow + early exit over multi-decade hold.
Negotiation context
- Only 7 days on market — expect competitive offers; lowballing is unlikely to land.
- 2 sale attempts since 26y ago; this cycle's ask is 86% above the opening price — seller raised mid-cycle; expect resistance to lowballs.
- Current owner paid $148k; list at $270k implies a 82% gain — meaningful room to come down on a strong offer.
Questions for the listing agent
- Built in 1979 — when were the roof, HVAC, electrical panel, plumbing, and water heater last replaced?
- Is there a deadline driving the sale (1031 exchange, divorce, estate, relocation)? That informs how much negotiation room exists.
- Schools are A-rated — typically a magnet for longer-tenancy family renters. What's the average tenant stay here, and is there a school-zone premium baked into asking?
- Crime grade is F in this area — have there been break-ins, vandalism, or insurance claims at this property in the last 3 years? What carrier currently insures it and at what premium?
- The area grade is low — what's the realistic commute time and amenity access for the typical tenant pool here? Any planned neighborhood developments (good or bad) we should know about?
- What's the average days-on-market for RENTAL listings here right now (not sales)? A rising rental-DOM trend means longer vacancies and softer asking-rent achievability than the comps imply.
- What's the recent tenant-quality profile in this submarket — average credit score on applications, eviction rate, late-payment / NSF rate, and stable-employment percentage? A property-management company in the area should have these aggregated.
- How much new for-sale + rental construction is in the pipeline within 1–3 miles? Heavy new supply typically softens prices + rents 12–24 months out; constrained supply supports both.
Investment metrics
- 1% rule
- 0.78% ✗
- Cap rate
- 6.35%
- Cash-on-cash
- 0.20%
- DSCR
- 1.01
- GRM
- 10.6
CMA / ARV
- ARV (on-the-fly)
- $275,184
- Comps found
- 6
Show comp detail 6 sales within ~0.75 mi
| Address | Dist | Beds/Ba | Sqft | Sold | Price | $/sf | Match |
|---|---|---|---|---|---|---|---|
| 88 Washington St | 0.10mi | 3/1.0 | 1,033 (+2%) | 23mo | $247,000 | $239 | 72 |
| 81 Oak Grove Ave | 0.19mi | 2/1.0 (-1) | 956 (-5%) | 9mo | $269,141 | $282 | 70 |
| 45 Blakeslee St | 0.12mi | 2/2.0 (-1) | 864 (-14%) | 9mo | $266,000 | $308 | 54 |
| 128 High St | 0.62mi | 3/1.5 | 1,130 (+12%) | 2mo | $308,850 | $273 | 47 |
| 46 Moreland Ave | 0.36mi | 2/1.0 (-1) | 1,144 (+14%) | 18mo | $254,000 | $222 | 40 |
| 95 Frost St | 0.46mi | 4/1.0 (+1) | 1,146 (+14%) | 22mo | $235,000 | $205 | 32 |
Match score weights: distance 35% · size 25% · config 20% · recency 20%. Top-matched comps best support the ARV.
Projected returns pro-forma
-3.0% appreciation · 3.0% rent growth · sell at horizon
- IRR
- -16.0%
- Equity multiple
- 0.43×
- Total profit
- $-43,037
- Equity at exit
- $40,258
- IRR
- -7.7%
- Equity multiple
- 0.51×
- Total profit
- $-36,819
- Equity at exit
- $23,345
Cash invested: $75,600 (down + closing). Projections, not guarantees.
Landlord ↔ Tenant lean methodology
- Overall (STATE)
- 41 Moderately Tenant-Leaning
- State Vermont
- 41 Moderately Tenant-Leaning · D+15
- County
- — inherits STATE
- City
- — inherits STATE
ZIP-level market 05301
- Home prices YoY
- -19.2%
- Active inventory
- 80
- Price-to-rent
- 10.6×
Monthly cashflow live
- Estimated rent
- $2,117 medium interval (Pro) →
- Mortgage (P&I)
- −$1,416
- Tax from tax record
- −$131 /mo · $1,576/yr
- Insurance
- −$112
- HOA
- −$0
- Vacancy / Maint / Mgmt
- −$445
- Net cashflow
- $13
Break-even live
Sensitivity live
| Price | -10% $166 | -5% $89 | +0% $13 | +5% $-64 | +10% $-140 |
|---|---|---|---|---|---|
| Rent | -10% $-155 | -5% $-71 | +0% $13 | +5% $96 | +10% $180 |
| Rate | -1.0pp $149 | -0.5pp $81 | base $13 | +0.5pp $-57 | +1.0pp $-128 |
UW: 25.0% down · 7.5% · 30yr · 1.5% tax · 5.0% vac · 8.0% maint · 8.0% mgmt
Financing live
Cash to close
- Down payment
- $67,500
- Closing costs
- $8,100
- Reserves months
- —
- Total cash needed
- —
Loan-product check · same deal, 3 products live
Conventional
25% down · 7.5% · 30yr
- Down + closing
- —
- Monthly P&I
- —
- Monthly cashflow
- —
- DSCR
- —
- Eligible?
- —
Personal DTI + credit; lowest rate.
DSCR
20% down · 8.5% · 30yr
- Down + closing
- —
- Monthly P&I
- —
- Monthly cashflow
- —
- DSCR
- —
- Eligible?
- —
No personal income docs; deal must DSCR.
Hard money
10% down · 12.0% · 12mo
- Down + closing
- —
- Monthly P&I
- —
- Monthly cashflow
- —
- DSCR
- —
- Eligible?
- —
Short-term bridge; refi at stabilization.
Rent comps 4 comps
| Address | Beds | Baths | Sqft | Rent | $/sqft | DOM | Units | Dist |
|---|---|---|---|---|---|---|---|---|
| 100 Clark St Unit 2 Brattleboro, VT | 2.0 | 1.0 | 1200 | $1,650 | $1.38 | 16d | 1 | 0.28mi |
| 6 Elliot St Unit 5 Brattleboro, VT | 2.0 | 1.0 | 850 | $2,300 | $2.71 | 45d | 1 | 0.48mi |
| 4 Elliot St Unit 5 Brattleboro, VT | 2.0 | 1.0 | 827 | $2,200 | $2.66 | 16d | 1 | 0.48mi |
| 110 Estey St Unit 1 Brattleboro, VT | 3.0 | 1.0 | 850 | $2,500 | $2.94 | 16d | 1 | 0.50mi |
Listing history 12 events
-
2026-06-21days on market $270,000 Active 7 DOM
-
2026-06-18days on market $270,000 Active 4 DOM
-
2026-06-17days on market $270,000 Active 3 DOM
-
2026-06-16days on market $270,000 Active 2 DOM
-
2026-06-15statusdays on market $270,000 Active 1 DOM
-
2026-06-14days on market $270,000 Coming Soon 8 DOM
-
2026-06-13days on market $270,000 Coming Soon 7 DOM
-
2026-06-10days on market $270,000 Coming Soon 5 DOM
-
2026-06-09days on market $270,000 Coming Soon 4 DOM
-
2026-06-08days on market $270,000 Coming Soon 3 DOM
-
2026-06-07remarks 699-char remark
-
2026-06-07$270,000 Coming Soon 2 DOM
ⓘ Source: listings_history table (triggers on properties + properties_extension) + one-shot
backfill from property_details.listing_events for pre-trigger history.
Tax reassessment forecast VT · Partial reset (capped growth)
- Current annual tax
- $1,576 · $131/mo
- Projected year-2 tax
- $3,353 · $279/mo
- Expected delta
- +$1,777/yr (+$148/mo · 112.8%)
ⓘ Screening estimate from a state-policy table — verify with the county assessor before closing.
Climate risk First Street
- Flood 1/10 Low FEMA zone X (unshaded) · 0% chance over 30 yrs
- Wildfire 1/10 Low
- Heat 3/10 Moderate 7 d/yr ≥94°F today · 17 d/yr by 30 yrs out
- Wind 4/10 Moderate 9% chance of damaging wind over 30 yrs
- Air quality 2/10 Low 0 unhealthy d/yr today · 1 by 30 yrs out
Nearby sold comps map
Loading sold comps map…
Walkable amenities ~0.75 mi
Loading nearby amenities…
Taxation est. · year 1
- Rental income
- $25,404
- − Mortgage interest
- −$15,124
- − Property taxes
- −$1,576
- − Insurance
- −$1,350
- − Repairs & maintenance
- −$2,032
- − Management
- −$2,032
- − Depreciation
- −$7,855
- Taxable loss
- −$4,565
- Est. tax savings @ 24.0%
- +$1,096
- After-tax cash flow
- $1,248/yr
For passive investors: Depreciation is non-cash, so a rental often shows a tax loss while cash-flowing — sheltering income. Rental losses are passive: they offset passive income freely, and up to $25,000/yr can offset ordinary (W-2) income if you actively participate and your MAGI is under $100k (phasing out to $0 by $150k); unused losses carry forward. On sale, claimed depreciation is recaptured at up to 25%, and gains may owe capital-gains tax (a 1031 exchange can defer both). Figures are a year-1 estimate at your 24.0% rate — not tax advice; consult a CPA.
Schools (NCES district)
No district data.
Livability — Brattleboro
- Score
- 67/100
- State rank
- #42
- US rank
- #10223
Category grades
Schools grade is shown separately in the Schools card above.
Census & demographics
- Census place
- Brattleboro, VT
- County
- Windham County · 16,955 people
- City population
- 16,955
- Metro
- nan
- Population (ZIP)
- 16,955
- Household income
- $65,910
- Rent vs Own
- Severe rent burden
- 594.0
Population outlook (Windham County) Hauer SSP2
- Today (2025)
- 40,432 people
- By 2030
- 38,472 · -4.8%
- By 2040
- 33,954 · -16.0%
- By 2050
- 29,774 · -26.4%
- By 2075
- 22,351 · -44.7%
- By 2100
- 15,961 · -60.5%
Race, ethnicity, and origin ACS 2023
- Neighborhood character
- Predominantly White (90%)
- Race & ethnicity
- White 90% Two or more races 6% Hispanic / Latino 3% Asian 2%
- Common ancestry
- Lithuanian 7% Romanian 5% Italian 4%
- Foreign-born
- 2% · Canada
- Languages at home
- 97% English-only · Spanish 2% Other Asian/Pacific 1%
Political lean MEDSL · Windham
- 2024 margin
- Solid D (+42.7) · D 69.6% · R 26.9% · Other 3.5%
- 2008→2024 swing
- -5.4pp toward R · 2008: 48.1pp · 2024: 42.7pp
- All cycles
- 2024: D+42.7 2020: D+47.3 2016: D+42.0 2012: D+49.2 2008: D+48.1
Not yet ingested
- Civics
- —
Market trends
- HPI YoY
- ▼ -67.19%
- Current HPI
- 283.2338
- Rent YoY
- —
- Metro
- nan
- State GDP YoY
- —
- F500 in state
- 0
Price history
+440.0% since first listed10 events — show timeline
- 2026-06-05 Coming Soon $270,000 PrimeMLS
- 2021-03-01 Sold (MLS) $148,500 PrimeMLS
- 2021-02-26 Sold (Public Records) $148,500 Public Records
- 2021-01-05 Pending — PrimeMLS
- 2020-10-09 Listed $145,500 PrimeMLS
- 2017-09-11 Price Changed $139,900 PrimeMLS
- 2004-11-23 Sold (Public Records) $95,000 Public Records
- 2000-04-04 Sold (Public Records) $35,086 Public Records
- 2000-04-03 Sold (MLS) $35,086 PrimeMLS
- 2000-01-24 Listed $50,000 PrimeMLS
Property tax history
-4.2%/yrLatest (2024): $1,576 · +2.3% YoY. Source: county tax records.
Cash-flow waterfall
monthlySold comps — $/sqft
last 12 mo · ≤1 miLoading sold comps…