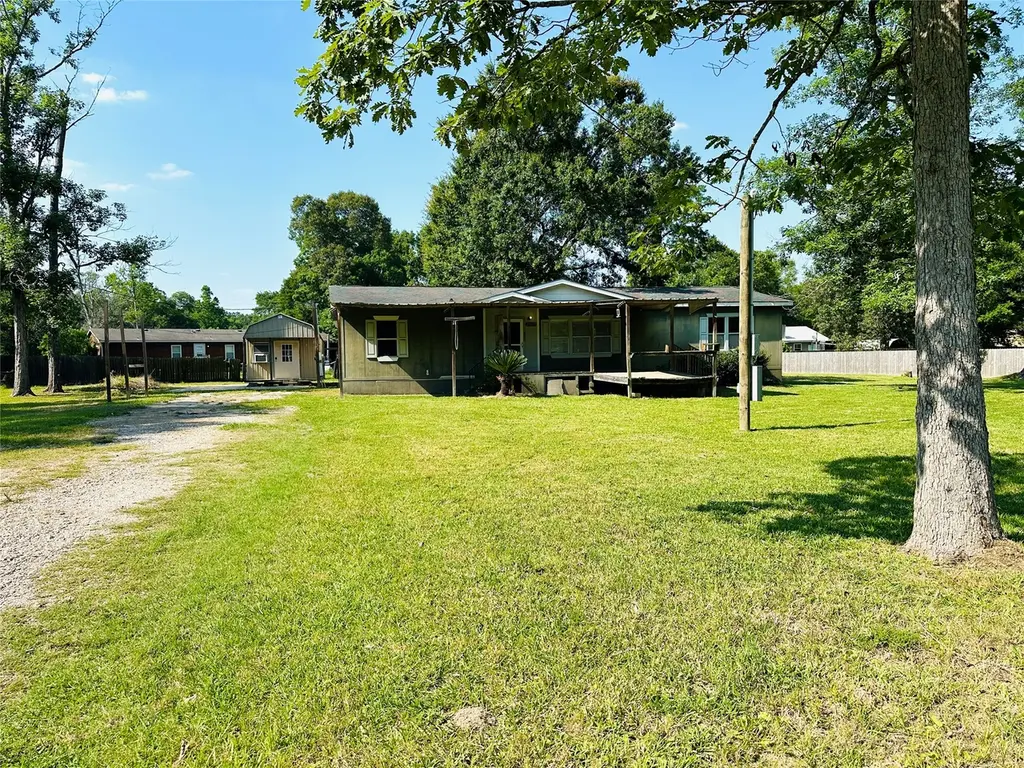
27607 County Road 3744 · Splendora, TX
Flood risk 3/10 · Minor
- FEMA flood zone
- X (unshaded)
- Chance of flooding over 30 yrs
- 0.2%
- Est. flood insurance / yr
- $507 – $1,088
Fire risk 4/10 · Minor
- Est. fire insurance / yr
- $1,222 – $2,270
Heat risk 9/10 · Severe
- Hot days now (above 110°F)
- 7 days/yr
- Hot days in 30 yrs
- 24 days/yr
Wind risk 8/10 · Major
- Chance of severe wind over 30 yrs
- 99.0%
Air-quality risk 2/10 · Minimal
- Unhealthy air days now
- 1 days/yr
- Unhealthy air days in 30 yrs
- 1 days/yr
Risk factors via First Street. Map © Google.
Why this score? — see what drove the B+ grade
The composite is a weighted blend of 9 inputs, each scored 0–100. Each bar is that input's sub-score; the figure is the points it added to the 100-point composite (weight × sub-score).
- Cash flow +30.0/30.0
- ARV discount +15.0/15.0
- DSCR +10.0/10.0
- 1% rule +9.5/10.0
- Livability +3.1/5.0
- Rent growth +2.5/5.0
- Condition / age +2.5/5.0
- Schools +2.1/10.0
- Appreciation +1.8/10.0
$124,900
🖨 Deal sheet 📄 Offer letter ✓ Due diligence
Listing remarks
Great Starter home or one that needs a few minor touches to make it yours! Great property with extra building to be used as a Guest house or extra storage or office. Come see the possibilities and bring your imagination.
Key facts
- Extra building
- Extra storage
- Guest house
Tags
Property features AI
Finance
- Other: Lot size approximately 0.75 acre (32,670 square feet)
- HOA & community: HOA named CH&P with an annual fee of $180
Exterior
- Utilities: Public water; Public sewer
- Home design: Residential property; Single-story (living area 1,620); Built in 2000; Facing direction not specified
- Construction: Wood siding; Composition roof; Unknown other construction materials; Built in 2000
- Exterior features: Asphalt road access; Cleared lot
Interior
- Bathrooms: 2 full bathrooms
- Heating & cooling: Central heating (electric); Central air conditioning (electric)
- Interior features: 3 total rooms; 2 full bathrooms
Neighborhood map
What this means for you Summary
Snapshot
- This is a 3-bed/2.0-bath manufactured listed at $125k.
Deal economics
- At list price, monthly cash flow is $511 ($6k/yr) — positive.
- The deal already cash-flows at list — no discount required.
- Meets the 1% rule at list price ($2k rent vs $125k).
- Recommended offer: $123k (1.5% below list) — sets the bar for market timing.
- Cap rate 11.2% vs local median 5.2% in Splendora — top-decile yield for the area; either an underpriced asset or a hidden risk that comps aren't pricing in. Stress-test before assuming the spread holds.
Location & tenants
- Location reads 62/100 on livability (#911 in TX) — a middle-class / working-renter tenant base. Strengths: cost of living A+, housing A+; Watch: amenities F, commute F, health & safety F.
- Cleveland ISD (town): math 24% / reading 25% proficiency, ranked #723 of 826 in TX (top 88%) — low school quality limits family demand, transient renter base, plan for 1-2y turnover; 71% free/reduced lunch — lower-income household profile, screen leases tightly.
- Zoned schools: Northside El (math 33% / reading 31%, grade F, #2,268 of 4,322 statewide, top 55%, 1,235 students, 90% FRL); Cleveland Middle (math 22% / reading 25%, grade F, #1,317 of 1,662 statewide, top 80%, 1,696 students, 98% FRL); Cleveland H S (math 30% / reading 32%, grade F, #1,077 of 1,632 statewide, top 66%, 3,310 students, 92% FRL) — zoned schools average 93% FRL vs 71% district-wide (23 pts higher); higher-poverty schools than district average — tighter screening recommended.
- Market conditions: 542 active listings in the ZIP; solid renter incomes; 1,321 units permitted in Liberty County in 2024 (0 in 5+ unit buildings).
Forward outlook
- Local home prices are declining (-3.0%/yr); year-one equity from $864 of loan paydown is wiped out by about $4k of value loss. Plan a longer hold.
- Liberty County population projected at +24% by 2050 — long-run rental-demand tailwind backs the buy-and-hold thesis.
- At projected returns (-3.0% appreciation + 3.0% rent growth), your $35k cash investment doubles in ~7 years — after that, you're playing with house money.
Negotiation context
- It's been on market 22 days — a 2% lower offer ($123k) is reasonable based on typical stale-listing flexibility.
- 2 sale attempts since 24y ago with the ask held roughly flat each time — persistent listings suggest the price (not the market) is what's stuck; bring a comps-based counter.
Risks & watch-outs
- Climate carrying-cost: severe wind risk, 99% chance of damaging wind over 30y; extreme-heat days projected 7→24/yr by 2055 (HVAC capex compounding) — expect insurance premiums to compound above CPI over the hold.
Questions for the listing agent
- What does the HOA fee cover, when was the last increase, and are there any pending special assessments or reserve-fund shortfalls?
- Is there a deadline driving the sale (1031 exchange, divorce, estate, relocation)? That informs how much negotiation room exists.
- Schools are F-rated, which usually means shorter tenancies and higher turnover. Who's the typical renter profile here, and what's been the actual vacancy rate?
- What's the average days-on-market for RENTAL listings here right now (not sales)? A rising rental-DOM trend means longer vacancies and softer asking-rent achievability than the comps imply.
- What's the recent tenant-quality profile in this submarket — average credit score on applications, eviction rate, late-payment / NSF rate, and stable-employment percentage? A property-management company in the area should have these aggregated.
- How much new for-sale + rental construction is in the pipeline within 1–3 miles? Heavy new supply typically softens prices + rents 12–24 months out; constrained supply supports both.
Investment metrics
- 1% rule
- 1.45% ✓
- Cap rate
- 11.20%
- Cash-on-cash
- 17.53%
- DSCR
- 1.78
- GRM
- 5.7
CMA / ARV
- ARV (median comp)
- $194,975
- List price
- $124,900
- Delta
- -35.94%
- Verdict
- UNDERPRICED
- Comps
- 10 within 1.0 mi
Show comp detail 3 sales within ~0.75 mi
| Address | Dist | Beds/Ba | Sqft | Sold | Price | $/sf | Match |
|---|---|---|---|---|---|---|---|
| 21613 County Road 37492 | 0.63mi | 3/2.0 | 1,568 (-3%) | 0mo | $220,000 | $140 | 65 |
| 21630 County Road 37491 | 0.57mi | 3/2.0 | 1,664 (+3%) | 12mo | $130,000 | $78 | 59 |
| 21649 County Road 3747 | 0.42mi | 3/2.0 | 1,856 (+15%) | 0mo | $189,000 | $102 | 56 |
Match score weights: distance 35% · size 25% · config 20% · recency 20%. Top-matched comps best support the ARV.
Projected returns pro-forma
-3.0% appreciation · 3.0% rent growth · sell at horizon
- IRR
- 9.0%
- Equity multiple
- 1.35×
- Total profit
- $12,364
- Equity at exit
- $18,623
- IRR
- 18.2%
- Equity multiple
- 2.51×
- Total profit
- $52,921
- Equity at exit
- $10,799
Cash invested: $34,972 (down + closing). Projections, not guarantees.
Landlord ↔ Tenant lean methodology
- Overall (STATE)
- 87 Strongly Landlord-Friendly
- State Texas
- 87 Strongly Landlord-Friendly · R+5
- County
- — inherits STATE
- City
- — inherits STATE
ZIP-level market 77372
- Home prices YoY
- -2.1%
- Active inventory
- 542
- Price-to-rent
- 5.7×
Monthly cashflow live
- Estimated rent
- $1,812 medium interval (Pro) →
- Mortgage (P&I)
- −$655
- Tax from tax record
- −$199 /mo · $2,383/yr
- Insurance
- −$52
- HOA
- −$15
- Vacancy / Maint / Mgmt
- −$381
- Net cashflow
- $511
Break-even live
UW: 25.0% down · 7.5% · 30yr · 1.5% tax · 5.0% vac · 8.0% maint · 8.0% mgmt
Financing live
Cash to close
- Down payment
- $31,225
- Closing costs
- $3,747
- Reserves months
- —
- Total cash needed
- —
Loan-product check · same deal, 3 products live
Conventional
25% down · 7.5% · 30yr
- Down + closing
- —
- Monthly P&I
- —
- Monthly cashflow
- —
- DSCR
- —
- Eligible?
- —
Personal DTI + credit; lowest rate.
DSCR
20% down · 8.5% · 30yr
- Down + closing
- —
- Monthly P&I
- —
- Monthly cashflow
- —
- DSCR
- —
- Eligible?
- —
No personal income docs; deal must DSCR.
Hard money
10% down · 12.0% · 12mo
- Down + closing
- —
- Monthly P&I
- —
- Monthly cashflow
- —
- DSCR
- —
- Eligible?
- —
Short-term bridge; refi at stabilization.
HOA detail
- Monthly dues
- $15 · $180/yr
Listing history 11 events
-
2026-06-07statusdays on market $124,900 Pending 22 DOM
-
2026-06-04days on market $124,900 Active 21 DOM
-
2026-06-03days on market $124,900 Active 20 DOM
-
2026-06-02days on market $124,900 Active 19 DOM
-
2026-06-01days on market $124,900 Active 18 DOM
-
2026-05-31days on market $124,900 Active 17 DOM
-
2026-05-14$124,900 Active 220-char remark
-
2014-12-19soldstatus
-
2004-02-23soldstatus
-
2003-03-15historical
-
2002-12-15$72,900
ⓘ Source: listings_history table (triggers on properties + properties_extension) + one-shot
backfill from property_details.listing_events for pre-trigger history.
Tax reassessment forecast TX · Resets to sale price
- Current annual tax
- $2,383 · $199/mo
- Projected year-2 tax
- $2,383 · $199/mo
- Expected delta
- $0/yr ($0/mo · 0.0%)
ⓘ Screening estimate from a state-policy table — verify with the county assessor before closing.
Climate risk First Street
- Flood 3/10 Moderate FEMA zone X (unshaded) · 20% chance over 30 yrs
- Wildfire 4/10 Moderate
- Heat 9/10 Extreme 7 d/yr ≥110°F today · 24 d/yr by 30 yrs out
- Wind 8/10 Severe 99% chance of damaging wind over 30 yrs
- Air quality 2/10 Low 1 unhealthy d/yr today · 1 by 30 yrs out
Nearby sold comps map
Loading sold comps map…
Walkable amenities ~0.75 mi
Loading nearby amenities…
Taxation est. · year 1
- Rental income
- $21,745
- − Mortgage interest
- −$6,996
- − Property taxes
- −$2,383
- − Insurance
- −$624
- − Repairs & maintenance
- −$1,740
- − Management
- −$1,740
- − HOA
- −$180
- − Depreciation
- −$3,633
- Taxable income
- $4,448
- Est. tax owed @ 24.0%
- −$1,068
- After-tax cash flow
- $5,063/yr
For passive investors: Depreciation is non-cash, so a rental often shows a tax loss while cash-flowing — sheltering income. Rental losses are passive: they offset passive income freely, and up to $25,000/yr can offset ordinary (W-2) income if you actively participate and your MAGI is under $100k (phasing out to $0 by $150k); unused losses carry forward. On sale, claimed depreciation is recaptured at up to 25%, and gains may owe capital-gains tax (a 1031 exchange can defer both). Figures are a year-1 estimate at your 24.0% rate — not tax advice; consult a CPA.
Schools (NCES district)
- District
- Cleveland ISD
- NCES district ID
- 4814370
- Math proficiency
- 24% ▼ -13.00%
- Reading proficiency
- 25% ▼ -4.00%
- Median HH income
- $39,173
- Composite
- 20.61/100
- National rank
- #8549
- State rank
- #723 of 826 in TX
Livability — Splendora
- Score
- 62/100
- State rank
- #911
- US rank
- #16335
Category grades
Schools grade is shown separately in the Schools card above.
Census & demographics
- County
- Montgomery County · 663,713 people
- City population
- 14,367
- Metro
- Houston-The Woodlands-Sugar Land, TX
- Population (ZIP)
- 14,367
- Household income
- $79,085
- Rent vs Own
- Severe rent burden
- 135.0
Population outlook (Liberty County) Hauer SSP2
- Today (2025)
- 87,956 people
- By 2030
- 92,161 · +4.8%
- By 2040
- 100,784 · +14.6%
- By 2050
- 109,471 · +24.5%
- By 2075
- 133,470 · +51.7%
- By 2100
- 147,372 · +67.6%
Race, ethnicity, and origin ACS 2023
- Neighborhood character
- Majority White (61%)
- Race & ethnicity
- White 61% Hispanic / Latino 36% Two or more races 9% Native American 1%
- Hispanic origin (detail)
- Mexican 32%
- Common ancestry
- Lithuanian 4% Italian 2% Slovak 1%
- Foreign-born
- 9% · Canada
- Languages at home
- 71% English-only · Spanish 28%
Political lean MEDSL · Liberty
- 2024 margin
- Solid R (+61.6) · D 19.0% · R 80.6%
- 2008→2024 swing
- -17.9pp toward R · 2008: -43.7pp · 2024: -61.6pp
- All cycles
- 2024: R+61.6 2020: R+59.7 2016: R+58.0 2012: R+53.3 2008: R+43.7
Not yet ingested
- Civics
- —
Market trends
- HPI YoY
- ▼ -6.47%
- Current HPI
- 306.9962
- Rent YoY
- —
- Metro
- Houston-The Woodlands-Sugar Land, TX
- State GDP YoY
- ▲ 3.95%
- F500 in state
- 110
Industry mix (Fortune 500 HQ in TX)
| Industry | F500 HQs | Revenue |
|---|---|---|
| Energy | 16 | $1,198B |
|
||
| Technology | 5 | $198B |
|
||
| Engineering / Construction | 4 | $72B |
|
||
| Energy Services | 3 | $60B |
|
||
| Utilities | 3 | $41B |
|
||
| Healthcare | 2 | $330B |
|
||
Price history
+71.3% since first listed6 events — show timeline
- 2026-06-05 Pending — HARMLS
- 2026-05-14 Listed $124,900 HARMLS
- 2014-12-19 Sold (Public Records) — Public Records
- 2004-02-23 Sold (Public Records) — Public Records
- 2003-03-15 Listing Removed — HARMLS
- 2002-12-15 Listed $72,900 HARMLS
Property tax history
+4.2%/yrLatest (2025): $2,383 · +5.2% YoY. Source: county tax records.
Cash-flow waterfall
monthlySold comps — $/sqft
last 12 mo · ≤1 miLoading sold comps…