16-2092 Uilani Dr · Ainaloa, HI
Flood risk 1/10 · Minimal
- FEMA flood zone
- X (unshaded)
- Chance of flooding over 30 yrs
- 0.0%
- Est. flood insurance / yr
- $507 – $1,088
Fire risk No data
- Est. fire insurance / yr
- —
Heat risk No data
- Hot days now (above threshold)
- —
- Hot days in 30 yrs
- —
Wind risk No data
- Chance of severe wind over 30 yrs
- —
Air-quality risk 1/10 · Minimal
- Unhealthy air days now
- —
- Unhealthy air days in 30 yrs
- —
Risk factors via First Street. Map © Google.
Why this score? — see what drove the C grade
The composite is a weighted blend of 9 inputs, each scored 0–100. Each bar is that input's sub-score; the figure is the points it added to the 100-point composite (weight × sub-score).
- Cash flow +25.2/30.0
- DSCR +8.3/10.0
- ARV discount +7.5/15.0
- 1% rule +6.7/10.0
- Schools +3.7/10.0
- Livability +3.0/5.0
- Rent growth +2.5/5.0
- Condition / age +2.5/5.0
- Appreciation +0.0/10.0
$149,900
🖨 Deal sheet 📄 Offer letter ✓ Due diligence
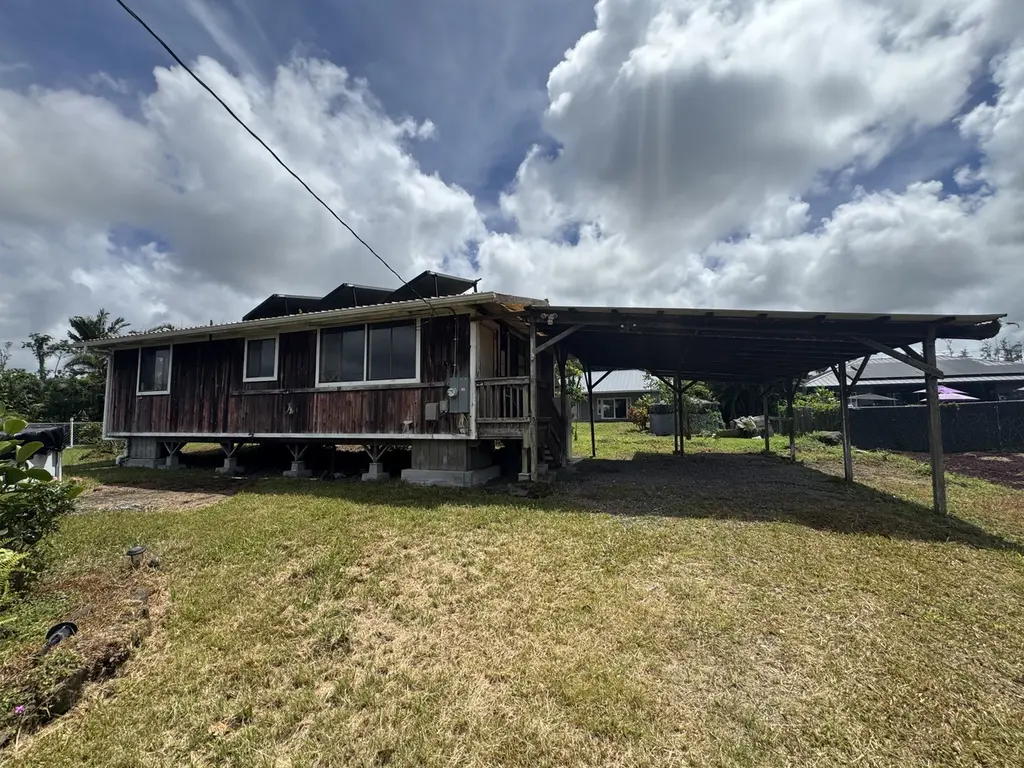
Listing remarks
2 bed, 1 bath home with 2 car carport located on a paved access road in Ainaloa available. Grassy yard with some mature trees. Home features a solar hot water (solar thermal) system that heats domestic water using roof mounted collectors. System supplements the existing water heater and reduces energy costs. Ainaloa has private, paved roads and a community park and playground. Located about 5-10 miles away from Pahoa and Keaau and all amenities including shopping, dining, gas, entertainment and more.
Key facts
- Community park
- Grassy yard
- Paved access road
Tags
Property features AI
Finance
- Financial info: Assessed value listed (for reference)
- HOA & community: Association fee of $18.75
Exterior
- Parking: Covered parking
- Utilities: Electricity available; Water from catchment; Cesspool sewer; No solid waste disposal service listed
- Home design: Property at 16-2092 Uilani Dr, Pahoa, HI
- Exterior features: Paved private road access; Fee simple ownership; Lava zone 3; Zoned A-1A
Interior
- Bathrooms: Total of 1 bathroom (1 full)
- Interior features: One full bathroom
Neighborhood map
What this means for you Summary
Snapshot
- This is a 2-bed/1.0-bath single-family listed at $150k.
Deal economics
- At list price, monthly cash flow is $335 ($4k/yr) — positive.
- The deal already cash-flows at list — no discount required.
- Meets the 1% rule at list price ($2k rent vs $150k).
- Recommended offer: $145k (3.0% below list) — sets the bar for market timing.
- Cap rate 9.0% vs local median 3.8% in Ainaloa — top-decile yield for the area; either an underpriced asset or a hidden risk that comps aren't pricing in. Stress-test before assuming the spread holds.
Location & tenants
- Location reads 60/100 on livability (#84 in HI) — a middle-class / working-renter tenant base. Strengths: housing A+, crime A-; Watch: health & safety C-, cost of living D+, schools F.
- Hawaii Department Of Education (suburban): math 32% / reading 50% proficiency, ranked #1 of 1 in HI (top 100%) — families likely to look elsewhere, expect single-tenant / working-renter base with shorter leases.
- Market conditions: 387 active listings in the ZIP; 982 units permitted in Hawaii County in 2024 (0 in 5+ unit buildings).
Forward outlook
- Local home prices are declining (-3.0%/yr); year-one equity from $1k of loan paydown is wiped out by about $4k of value loss. Plan a longer hold.
- Hawaii County population projected at +24% by 2050 — long-run rental-demand tailwind backs the buy-and-hold thesis.
Negotiation context
- It's been on market 35 days — a 3% lower offer ($145k) is reasonable based on typical stale-listing flexibility.
- Current owner paid $8k; list at $150k implies a 1899% gain — meaningful room to come down on a strong offer.
Questions for the listing agent
- It's been on market 35 days. Have you received any prior offers? Is the seller open to a 3% concession, seller financing, or rate buy-down credit?
- What does the HOA fee cover, when was the last increase, and are there any pending special assessments or reserve-fund shortfalls?
- Is there a deadline driving the sale (1031 exchange, divorce, estate, relocation)? That informs how much negotiation room exists.
- Schools are F-rated, which usually means shorter tenancies and higher turnover. Who's the typical renter profile here, and what's been the actual vacancy rate?
- What's the average days-on-market for RENTAL listings here right now (not sales)? A rising rental-DOM trend means longer vacancies and softer asking-rent achievability than the comps imply.
- What's the recent tenant-quality profile in this submarket — average credit score on applications, eviction rate, late-payment / NSF rate, and stable-employment percentage? A property-management company in the area should have these aggregated.
- How much new for-sale + rental construction is in the pipeline within 1–3 miles? Heavy new supply typically softens prices + rents 12–24 months out; constrained supply supports both.
Investment metrics
- 1% rule
- 1.17% ✓
- Cap rate
- 8.97%
- Cash-on-cash
- 9.58%
- DSCR
- 1.43
- GRM
- 7.1
CMA / ARV
- ARV (median comp)
- $309,556
- List price
- $149,900
- Delta
- -51.58%
- Verdict
- UNDERPRICED
- Comps
- 10 within 1.0 mi
Show comp detail 2 sales within ~0.75 mi
| Address | Dist | Beds/Ba | Sqft | Sold | Price | $/sf | Match |
|---|---|---|---|---|---|---|---|
| 16-2097 Hanale Dr | 0.23mi | 2/1.0 | 736 (+2%) | 21mo | $312,000 | $424 | 68 |
| 16-2062 Gardenia Dr | 0.72mi | 2/1.0 | 700 (-3%) | 2mo | $319,000 | $456 | 60 |
Match score weights: distance 35% · size 25% · config 20% · recency 20%. Top-matched comps best support the ARV.
Projected returns pro-forma
-3.0% appreciation · 3.0% rent growth · sell at horizon
- IRR
- -1.8%
- Equity multiple
- 0.93×
- Total profit
- $-2,923
- Equity at exit
- $22,351
- IRR
- 7.9%
- Equity multiple
- 1.60×
- Total profit
- $25,074
- Equity at exit
- $12,961
Cash invested: $41,972 (down + closing). Projections, not guarantees.
Landlord ↔ Tenant lean methodology
- Overall (STATE)
- 37 Tenant-Leaning
- State Hawaii
- 37 Tenant-Leaning · D+13
- County
- — inherits STATE
- City
- — inherits STATE
ZIP-level market 96778
- Home prices YoY
- -15.3%
- Active inventory
- 387
- Price-to-rent
- 7.1×
Monthly cashflow live
- Estimated rent
- $1,758 medium interval (Pro) →
- Mortgage (P&I)
- −$786
- Tax est. 1.5%
- −$187 /mo · $2,248/yr
- Insurance
- −$62
- HOA
- −$18
- Vacancy / Maint / Mgmt
- −$369
- Net cashflow
- $335
Break-even live
UW: 25.0% down · 7.5% · 30yr · 1.5% tax · 5.0% vac · 8.0% maint · 8.0% mgmt
Financing live
Cash to close
- Down payment
- $37,475
- Closing costs
- $4,497
- Reserves months
- —
- Total cash needed
- —
Loan-product check · same deal, 3 products live
Conventional
25% down · 7.5% · 30yr
- Down + closing
- —
- Monthly P&I
- —
- Monthly cashflow
- —
- DSCR
- —
- Eligible?
- —
Personal DTI + credit; lowest rate.
DSCR
20% down · 8.5% · 30yr
- Down + closing
- —
- Monthly P&I
- —
- Monthly cashflow
- —
- DSCR
- —
- Eligible?
- —
No personal income docs; deal must DSCR.
Hard money
10% down · 12.0% · 12mo
- Down + closing
- —
- Monthly P&I
- —
- Monthly cashflow
- —
- DSCR
- —
- Eligible?
- —
Short-term bridge; refi at stabilization.
HOA detail
- Monthly dues
- $18 · $216/yr
- Likely covers
- watergas
Listing history 17 events
-
2026-06-18days on market $149,900 Active 35 DOM
-
2026-06-17pricedays on market $149,900 Active 34 DOM
-
2026-06-16days on market $159,900 Active 33 DOM
-
2026-06-15days on market $159,900 Active 32 DOM
-
2026-06-13days on market $159,900 Active 30 DOM
-
2026-06-13days on market $159,900 Active 29 DOM
-
2026-06-10days on market $159,900 Active 27 DOM
-
2026-06-09days on market $159,900 Active 26 DOM
-
2026-06-08days on market $159,900 Active 25 DOM
-
2026-06-07days on market $159,900 Active 24 DOM
-
2026-06-05days on market $159,900 Active 21 DOM
-
2026-06-03days on market $159,900 Active 20 DOM
-
2026-06-02days on market $159,900 Active 19 DOM
-
2026-06-01days on market $159,900 Active 18 DOM
-
2026-05-31days on market $159,900 Active 17 DOM
-
2026-05-14$159,900 Active 505-char remark
-
1995-04-20soldstatus $7,500
ⓘ Source: listings_history table (triggers on properties + properties_extension) + one-shot
backfill from property_details.listing_events for pre-trigger history.
Climate risk First Street
- Flood 1/10 Low FEMA zone X (unshaded) · 0% chance over 30 yrs
- Air quality 1/10 Low
Nearby sold comps map
Loading sold comps map…
Walkable amenities ~0.75 mi
Loading nearby amenities…
Taxation est. · year 1
- Rental income
- $21,096
- − Mortgage interest
- −$8,397
- − Property taxes
- −$2,248
- − Insurance
- −$750
- − Repairs & maintenance
- −$1,688
- − Management
- −$1,688
- − HOA
- −$216
- − Depreciation
- −$4,361
- Taxable income
- $1,749
- Est. tax owed @ 24.0%
- −$420
- After-tax cash flow
- $3,599/yr
For passive investors: Depreciation is non-cash, so a rental often shows a tax loss while cash-flowing — sheltering income. Rental losses are passive: they offset passive income freely, and up to $25,000/yr can offset ordinary (W-2) income if you actively participate and your MAGI is under $100k (phasing out to $0 by $150k); unused losses carry forward. On sale, claimed depreciation is recaptured at up to 25%, and gains may owe capital-gains tax (a 1031 exchange can defer both). Figures are a year-1 estimate at your 24.0% rate — not tax advice; consult a CPA.
Schools (NCES district)
- District
- Hawaii Department Of Education
- NCES district ID
- 1500030
- Math proficiency
- 32% ▼ -10.00%
- Reading proficiency
- 50% ▼ -3.00%
- Median HH income
- $69,005
- Composite
- 37.07/100
- National rank
- #4504
- State rank
- #1 of 1 in HI
Livability — Ainaloa
- Score
- 60/100
- State rank
- #84
- US rank
- #18581
Category grades
Schools grade is shown separately in the Schools card above.
Census & demographics
- Census place
- Ainaloa, HI
- Population (ZIP)
- 14,225
Population outlook (Hawaii County) Hauer SSP2
- Today (2025)
- 220,733 people
- By 2030
- 232,156 · +5.2%
- By 2040
- 252,486 · +14.4%
- By 2050
- 272,703 · +23.5%
- By 2075
- 332,113 · +50.5%
- By 2100
- 398,342 · +80.5%
Race, ethnicity, and origin ACS 2023
- Neighborhood character
- Highly diverse neighborhood (Simpson 0.82)
- Race & ethnicity
- White 37% Two or more races 30% Hispanic / Latino 15% Pacific Islander 15% Asian 12%
- Hispanic origin (detail)
- Mexican 4% Puerto Rican 9%
- Common ancestry
- Russian 7% Italian 3% Romanian 3%
- Foreign-born
- 12% · Canada, Vietnam
- Languages at home
- 77% English-only · Other Asian/Pacific 11% Tagalog/Filipino 1% Russian/Polish/Slavic 1%
Political lean MEDSL · Hawaii
- 2024 margin
- Strong D (+28.3) · D 63.0% · R 34.7% · Other 2.3%
- 2008→2024 swing
- -25.4pp toward R · 2008: 53.7pp · 2024: 28.3pp
- All cycles
- 2024: D+28.3 2020: D+36.2 2016: D+36.6 2012: D+51.3 2008: D+53.7
Not yet ingested
- Civics
- —
Market trends
- HPI YoY
- ▼ -31.52%
- Current HPI
- 173.8168
- Rent YoY
- —
- Metro
- —
- State GDP YoY
- —
- F500 in state
- 0
Price history
+1898.7% since first listed3 events — show timeline
- 2026-06-17 Price Changed $149,900 HI Information Service
- 2026-05-14 Listed $159,900 HI Information Service
- 1995-04-20 Sold (Public Records) $7,500 Public Records
Property tax history
+7.8%/yrLatest (2025): $200 · +0.0% YoY. Source: county tax records.
Cash-flow waterfall
monthlySold comps — $/sqft
last 12 mo · ≤1 miLoading sold comps…