720 Cleveland Ave · Kansas City, MO
Flood risk 1/10 · Minimal
- FEMA flood zone
- X (unshaded)
- Chance of flooding over 30 yrs
- 0.0%
- Est. flood insurance / yr
- $473 – $860
Fire risk 1/10 · Minimal
- Est. fire insurance / yr
- $1,054 – $1,958
Heat risk 4/10 · Minor
- Hot days now (above 106°F)
- 7 days/yr
- Hot days in 30 yrs
- 17 days/yr
Wind risk 2/10 · Minimal
- Chance of severe wind over 30 yrs
- —
Air-quality risk 3/10 · Minor
- Unhealthy air days now
- 2 days/yr
- Unhealthy air days in 30 yrs
- 3 days/yr
Risk factors via First Street. Map © Google.
Why this score? — see what drove the B- grade
The composite is a weighted blend of 9 inputs, each scored 0–100. Each bar is that input's sub-score; the figure is the points it added to the 100-point composite (weight × sub-score).
- Cash flow +30.0/30.0
- DSCR +10.0/10.0
- ARV discount +8.7/15.0
- 1% rule +8.0/10.0
- Livability +3.9/5.0
- Rent growth +3.1/5.0
- Condition / age +2.5/5.0
- Schools +1.5/10.0
- Appreciation +0.0/10.0
$105,000
🖨 Deal sheet (PDF) 📄 Offer letter ✓ Due diligence
Listing remarks MLS
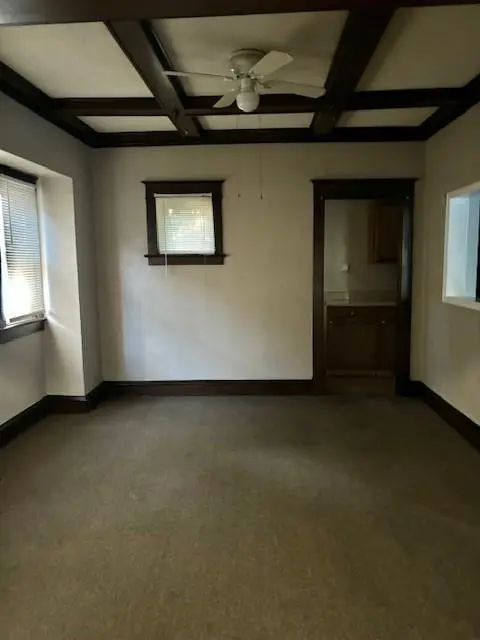
Very livable 2-Stry home with breezy front porch, newer carpet and hilly lot. Some masonry work needed but overall a great BUY & SUPER CHEAP! Much better than paying rent; PLUS instant equity. Selling "AS IS" No Seller's Disclosures. Inspections welcome but for Buyer's knowledge. No Seller's Disclosures. Selling "AS IS" Room sizes are estimates; No guarantees expressed/implied. Buyer to confirm all information!
Key facts
- 8,712 sq ft lot
- Built 1911
- Listed 20 days
Property features AI
Finance
- HOA & community: No association fees
Exterior
- Parking: Other parking
- Utilities: Public water; Public sewer
- Home design: Single family residence; Residential property; 2-story floor plan; Approximately 101+ years old
- Construction: Brick/mortar construction; Composition roof
- Exterior features: Front porch
Interior
- Kitchen: Kitchen with vinyl flooring
- Bedrooms: 3 bedrooms (two on second level, one on first level)
- Flooring: Wood flooring (general); Carpet in some rooms; Vinyl in kitchen and bathroom
- Bathrooms: 1 full bath; 1 half bath
- Heating & cooling: Forced air heating; Has cooling (system not specified)
- Interior features: Storm windows and wood windows; Storm door(s); Entry and formal living room
- Laundry & utility: Laundry located in the basement
Neighborhood map
What this means for you Summary
Snapshot
- This is a 3-bed/1.0-bath single-family listed at $105k.
Deal economics
- At list price, monthly cash flow is $438 ($5k/yr) — positive.
- The deal already cash-flows at list — no discount required.
- Meets the 1% rule at list price ($1k rent vs $105k).
- Recommended offer: $103k (1.5% below list) — sets the bar for market timing.
- Cap rate 11.3% vs local median 3.9% in Kansas City — top-decile yield for the area; either an underpriced asset or a hidden risk that comps aren't pricing in. Stress-test before assuming the spread holds.
Location & tenants
- Location reads 78/100 on livability (#28 in MO, #2,671 nationally) — a middle-class / working-renter tenant base. Strengths: amenities A+, commute A+, cost of living A+; Watch: crime F.
- Kansas City 33 (urban): math 12% / reading 24% proficiency, ranked #308 of 324 in MO (top 95%) — low school quality limits family demand, transient renter base, plan for 1-2y turnover; 75% free/reduced lunch — lower-income household profile, screen leases tightly.
- Zoned schools: Whittier Elementary (math 11% / reading 17%, grade F, #1,002 of 1,115 statewide, top 90%, 351 students, 99% FRL); Northeast High (math 2% / reading 22%, grade F, #497 of 521 statewide, top 96%, 657 students, 100% FRL) — zoned schools average 99% FRL vs 75% district-wide (24 pts higher); higher-poverty schools than district average — tighter screening recommended.
- Market conditions: Rents rising (+2.2%/yr); 53 active listings in the ZIP; 38 comparable units currently listed for rent nearby; rentals at typical pace (median 25d on market — plan ~3-4 weeks tenant-placement turnaround); 4,002 units permitted in Jackson County in 2024 (2,271 in 5+ unit buildings).
- This rent runs 36% of the median local income ($46k/yr) — at the standard rent-burdened threshold; future hikes will face affordability resistance.
Forward outlook
- Local home prices are declining (-3.0%/yr); year-one equity from $726 of loan paydown is wiped out by about $3k of value loss. Plan a longer hold.
- Jackson County population projected at +4% by 2050 — modest demand growth; plan on rents tracking national, not racing it.
- At projected returns (-3.0% appreciation + 2.2% rent growth), your $29k cash investment doubles in ~8 years — after that, you're playing with house money.
Negotiation context
- It's been on market 21 days — a 2% lower offer ($103k) is reasonable based on typical stale-listing flexibility.
- 4 sale attempts since 19y ago; this cycle's ask has dropped $10k (9%) from the opening price — seller is motivated, your offer sets the floor, not the list.
Risks & watch-outs
- Watch-outs: built in 1911 — expect roof / HVAC / electrical / plumbing capex.
Questions for the listing agent
- Built in 1911 — when were the roof, HVAC, electrical panel, plumbing, and water heater last replaced?
- Is there a deadline driving the sale (1031 exchange, divorce, estate, relocation)? That informs how much negotiation room exists.
- Crime grade is F in this area — have there been break-ins, vandalism, or insurance claims at this property in the last 3 years? What carrier currently insures it and at what premium?
- What's the average days-on-market for RENTAL listings here right now (not sales)? A rising rental-DOM trend means longer vacancies and softer asking-rent achievability than the comps imply.
- What's the recent tenant-quality profile in this submarket — average credit score on applications, eviction rate, late-payment / NSF rate, and stable-employment percentage? A property-management company in the area should have these aggregated.
- How much new for-sale + rental construction is in the pipeline within 1–3 miles? Heavy new supply typically softens prices + rents 12–24 months out; constrained supply supports both.
Investment metrics
- 1% rule
- 1.30% ✓
- Cap rate
- 11.30%
- Cash-on-cash
- 17.88%
- DSCR
- 1.80
- GRM
- 6.4
CMA / ARV
- ARV (median comp)
- $107,802
- List price
- $105,000
- Delta
- 6.68%
- Verdict
- FAIR
- Comps
- 20 within 1.0 mi
Show comp detail 12 sales within ~0.75 mi
| Address | Dist | Beds/Ba | Sqft | Sold | Price | $/sf | Match |
|---|---|---|---|---|---|---|---|
| 3830 Roberts St | 0.26mi | 4/2.0 (+1) | 1,320 (+3%) | 6mo | $70,000 | $53 | 68 |
| 815 Elmwood Ave | 0.53mi | 3/1.5 | 1,302 (+2%) | 5mo | $74,900 | $58 | 66 |
| 3608 Lexington Ave | 0.51mi | 3/1.0 | 1,365 (+7%) | 7mo | $189,000 | $138 | 59 |
| 3618 Anderson Ave | 0.57mi | 3/1.0 | 1,219 (-5%) | 8mo | $99,000 | $81 | 59 |
| 410 Kensington Ave | 0.53mi | 4/2.0 (+1) | 1,240 (-3%) | 4mo | $159,000 | $128 | 57 |
| 402 Kensington Ave | 0.54mi | 3/2.0 | 1,376 (+7%) | 3mo | $75,000 | $55 | 56 |
| 3621 Lexington St | 0.48mi | 3/1.5 | 1,395 (+9%) | 6mo | $165,000 | $118 | 56 |
| 428 Spruce Ave | 0.44mi | 3/1.0 | 1,400 (+9%) | 12mo | $160,000 | $114 | 54 |
| 129 S Cypress Ave | 0.75mi | 3/1.0 | 1,336 (+4%) | 10mo | $189,500 | $142 | 50 |
| 4024 Morrell St | 0.66mi | 3/1.0 | 1,156 (-10%) | 9mo | $97,000 | $84 | 46 |
| 110 N Monroe Ave | 0.70mi | 3/1.0 | 1,112 (-13%) | 7mo | $85,000 | $76 | 39 |
| 429 Montgall Ave | 0.72mi | 3/2.5 | 1,444 (+13%) | 9mo | $259,900 | $180 | 32 |
Match score weights: distance 35% · size 25% · config 20% · recency 20%. Top-matched comps best support the ARV.
Projected returns pro-forma
-3.0% appreciation · 2.2% rent growth · sell at horizon
- IRR
- 8.5%
- Equity multiple
- 1.33×
- Total profit
- $9,768
- Equity at exit
- $15,656
- IRR
- 17.1%
- Equity multiple
- 2.36×
- Total profit
- $39,902
- Equity at exit
- $9,078
Cash invested: $29,400 (down + closing). Projections, not guarantees.
Landlord ↔ Tenant lean methodology
- Overall (STATE)
- 81 Strongly Landlord-Friendly
- State Missouri
- 81 Strongly Landlord-Friendly · R+10
- County
- — inherits STATE
- City
- — inherits STATE
ZIP-level market 64124
- Home prices YoY
- -26.0%
- Rents YoY
- 2.2%
- Active inventory
- 53
- Price-to-rent
- 6.4×
Monthly cashflow live
- Estimated rent
- $1,369 high interval (Pro) →
- Mortgage (P&I)
- −$551
- Tax from tax record
- −$49 /mo · $590/yr
- Insurance
- −$44
- HOA
- −$0
- Vacancy / Maint / Mgmt
- −$288
- Net cashflow
- $438
Break-even live
Sensitivity live
| Price | -10% $498 | -5% $468 | +0% $438 | +5% $408 | +10% $379 |
|---|---|---|---|---|---|
| Rent | -10% $330 | -5% $384 | +0% $438 | +5% $492 | +10% $546 |
| Rate | -1.0pp $491 | -0.5pp $465 | base $438 | +0.5pp $411 | +1.0pp $383 |
UW: 25.0% down · 7.5% · 30yr · 1.5% tax · 5.0% vac · 8.0% maint · 8.0% mgmt
Financing live
Cash to close
- Down payment
- $26,250
- Closing costs
- $3,150
- Reserves months
- —
- Total cash needed
- —
Loan-product check · same deal, 3 products live
Conventional
25% down · 7.5% · 30yr
- Down + closing
- —
- Monthly P&I
- —
- Monthly cashflow
- —
- DSCR
- —
- Eligible?
- —
Personal DTI + credit; lowest rate.
DSCR
20% down · 8.5% · 30yr
- Down + closing
- —
- Monthly P&I
- —
- Monthly cashflow
- —
- DSCR
- —
- Eligible?
- —
No personal income docs; deal must DSCR.
Hard money
10% down · 12.0% · 12mo
- Down + closing
- —
- Monthly P&I
- —
- Monthly cashflow
- —
- DSCR
- —
- Eligible?
- —
Short-term bridge; refi at stabilization.
Rent comps 38 comps
| Address | Beds | Baths | Sqft | Rent | $/sqft | DOM | Units | Dist |
|---|---|---|---|---|---|---|---|---|
| 3435 E 7th St Kansas City, MO | 2.0 | 1.0 | 970 | $949 | $0.98 | 8d | 1 | 0.14mi |
| 901 Benton Blvd Unit 7 Kansas City, MO | 2.0 | 1.0 | 1100 | $1,202 | $1.09 | 44d | 1 | 0.33mi |
| 3510 Garner Ave Kansas City, MO | 3.0 | 2.0 | 1536 | $1,400 | $0.91 | 4d | 1 | 0.42mi |
| 916 Bellefontaine Ave Kansas City, MO | 3.0 | 1.5 | 1399 | $1,650 | $1.18 | 17d | 1 | 0.45mi |
| 1233 Benton Blvd Kansas City, MO | 4.0 | 2.5 | 1500 | $2,500 | $1.67 | 44d | 1 | 0.51mi |
| 2834 E 10th St Kansas City, MO | 2.0 | 1.5 | 1020 | $1,250 | $1.23 | 44d | 1 | 0.53mi |
| 2826 E 10th St Kansas City, MO | 2.0 | 1.5 | 1020 | $1,250 | $1.23 | 44d | 1 | 0.54mi |
| 815 Elmwood Ave Kansas City, MO | 3.0 | 1.5 | 1302 | $1,600 | $1.23 | 15d | 1 | 0.54mi |
| 504 Bellefontaine Ave Unit 2 Kansas City, MO | 2.0 | 2.0 | 1500 | $1,300 | $0.87 | 44d | 1 | 0.60mi |
| 3429 Morrell Ave Kansas City, MO | 4.0 | 1.5 | 1800 | $1,650 | $0.92 | 8d | 1 | 0.64mi |
| 3523 Saint John Ave Kansas City, MO | 3.0 | 1.0 | 1500 | $995 | $0.66 | 24d | 1 | 0.69mi |
| 311 Bellefontaine Ave Kansas City, MO | 3.0 | 2.0 | 1360 | $2,200 | $1.62 | 44d | 1 | 0.71mi |
| 412 Montgall Ave Unit 412 Kansas City, MO | 2.0 | 2.0 | 900 | $1,200 | $1.33 | 44d | 1 | 0.76mi |
| 203 N Indiana Ave Unit 209 Indiana Kansas City, MO | 2.0 | 1.0 | 1500 | $1,400 | $0.93 | 44d | 1 | 0.83mi |
| 414 Prospect Ave Unit 1 Kansas City, MO | 2.0 | 1.0 | 900 | $1,295 | $1.44 | 8d | 1 | 0.84mi |
| 1603 Elmwood Ave Kansas City, MO | 2.0 | 1.0 | 1064 | $1,031 | $0.97 | 13d | 1 | 0.89mi |
| 3921 Norledge Ave Unit 2E Kansas City, MO | 2.0 | 1.0 | 900 | $950 | $1.06 | 44d | 1 | 0.91mi |
| 1805 Jackson Ave Kansas City, MO | 4.0 | 2.0 | 1250 | $1,250 | $1.00 | 44d | 1 | 0.95mi |
| 218 N Elmwood Ave Kansas City, MO | 4.0 | 2.0 | 1184 | $1,500 | $1.27 | 44d | 1 | 0.96mi |
| 4405 Norledge Ave Kansas City, MO | 3.0 | 1.0 | 1510 | $1,600 | $1.06 | 44d | 1 | 0.98mi |
| 3305 E 19th St Kansas City, MO | 2.0 | 1.0 | 1500 | $1,200 | $0.80 | 44d | 1 | 0.98mi |
| 1812 Elmwood Ave Kansas City, MO | 3.0 | 1.0 | 1650 | $1,600 | $0.97 | 17d | 1 | 1.04mi |
| 1905 Kensington Ave Kansas City, MO | 3.0 | 2.0 | 1285 | $1,325 | $1.03 | 24d | 1 | 1.07mi |
| 3201 E 20th St Kansas City, MO | 2.0 | 1.0 | 900 | $1,050 | $1.17 | 24d | 1 | 1.12mi |
| 220 Brooklyn Ave Unit 220-2 Kansas City, MO | 2.0 | 1.0 | 1000 | $1,295 | $1.29 | 20d | 1 | 1.12mi |
| 220 Brooklyn Ave Kansas City, MO | 2.0 | 1.0 | 1000 | $1,295 | $1.29 | 8d | 1 | 1.12mi |
| 612 Garfield Ave Kansas City, MO | 1.0–2.0 | 1.0–2.0 | 900 | $1,875 | $2.08 | 2d | 44 | 1.13mi |
| 129 Brooklyn Ave Kansas City, MO | 2.0 | 1.0 | 1225 | $1,195 | $0.98 | 11d | 1 | 1.14mi |
| 347 Maple Blvd Kansas City, MO | 3.0 | 1.5 | 1246 | $1,350 | $1.08 | 24d | 1 | 1.18mi |
| 105 Brooklyn Ave Kansas City, MO | 3.0 | 1.5 | 1152 | $1,250 | $1.09 | 5d | 1 | 1.18mi |
| 2900 E 21st St Kansas City, MO | 3.0 | 1.5 | 897 | $1,650 | $1.84 | 17d | 1 | 1.25mi |
| 5213 Wilburn Ct Kansas City, MO | 3.0 | 1.0 | 1274 | $1,375 | $1.08 | 22d | 1 | 1.27mi |
| 2003 Wabash Ave Unit B Kansas City, MO | 3.0 | 2.0 | 1200 | $1,095 | $0.91 | 24d | 1 | 1.32mi |
| 135 Lawndale Ave Kansas City, MO | 3.0 | 2.0 | 920 | $1,500 | $1.63 | 8d | 1 | 1.35mi |
| 2419 Bales Ave Kansas City, MO | 3.0 | 1.5 | 1116 | $1,500 | $1.34 | 4d | 1 | 1.46mi |
| 441 N Hardesty Ave Kansas City, MO | 4.0 | 1.0 | 1511 | $1,550 | $1.03 | 24d | 1 | 1.46mi |
| 2413 College Ave Kansas City, MO | 2.0 | 2.0 | 1022 | $1,225 | $1.20 | 24d | 1 | 1.46mi |
| 6011 E 11th St Kansas City, MO | 3.0 | 1.0 | 900 | $1,200 | $1.33 | 17d | 1 | 1.49mi |
Listing history 25 events
-
2026-06-21days on market $105,000 Active 21 DOM
-
2026-06-18days on market $105,000 Active 18 DOM
-
2026-06-17pricedays on market $105,000 Active 17 DOM
-
2026-06-16days on market $115,000 Active 16 DOM
-
2026-06-15days on market $115,000 Active 15 DOM
-
2026-06-13days on market $115,000 Active 13 DOM
-
2026-06-09days on market $115,000 Active 9 DOM
-
2026-06-08days on market $115,000 Active 8 DOM
-
2026-06-07days on market $115,000 Active 7 DOM
-
2026-06-05days on market $115,000 Active 4 DOM
-
2026-06-03days on market $115,000 Active 3 DOM
-
2026-06-02days on market $115,000 Active 2 DOM
-
2026-06-01remarks 198-char remark
-
2026-06-01days on market $115,000 Active 1 DOM
-
2026-04-19$115,000 Active
-
2024-11-01historical $1,000
-
2024-10-22price $1,000
-
2024-10-03$900
-
2022-12-05historical
-
2008-04-17soldstatus
-
2008-04-04soldstatus 440-char remark
Show marketing remark (440 chars)
Very livable 2-Stry home with breezy front porch, newer carpet and hilly lot. Some masonry work needed but overall a great BUY & SUPER CHEAP! Much better than paying rent; PLUS instant equity. Selling "AS IS" No Seller's Disclosures. Inspections welcome but for Buyer's knowledge. No Seller's Disclosures. Selling "AS IS" Room sizes are estimates; No guarantees expressed/implied. Buyer to confirm all information!
-
2007-12-10$24,900 440-char remark
Show marketing remark (440 chars)
Very livable 2-Stry home with breezy front porch, newer carpet and hilly lot. Some masonry work needed but overall a great BUY & SUPER CHEAP! Much better than paying rent; PLUS instant equity. Selling "AS IS" No Seller's Disclosures. Inspections welcome but for Buyer's knowledge. No Seller's Disclosures. Selling "AS IS" Room sizes are estimates; No guarantees expressed/implied. Buyer to confirm all information!
-
2000-02-25soldstatus
-
2000-02-25soldstatus
-
1993-02-25soldstatus
ⓘ Source: listings_history table (triggers on properties + properties_extension) + one-shot
backfill from property_details.listing_events for pre-trigger history.
Tax reassessment forecast MO · Resets to sale price
- Current annual tax
- $590 · $49/mo
- Projected year-2 tax
- $1,018 · $85/mo
- Expected delta
- +$428/yr (+$36/mo · 72.6%)
ⓘ Screening estimate from a state-policy table — verify with the county assessor before closing.
Climate risk First Street
- Flood 1/10 Low FEMA zone X (unshaded) · 0% chance over 30 yrs
- Wildfire 1/10 Low
- Heat 4/10 Moderate 7 d/yr ≥106°F today · 17 d/yr by 30 yrs out
- Wind 2/10 Low
- Air quality 3/10 Moderate 2 unhealthy d/yr today · 3 by 30 yrs out
Nearby sold comps map
Loading sold comps map…
Walkable amenities ~0.75 mi
Loading nearby amenities…
Taxation est. · year 1
- Rental income
- $16,431
- − Mortgage interest
- −$5,882
- − Property taxes
- −$590
- − Insurance
- −$525
- − Repairs & maintenance
- −$1,314
- − Management
- −$1,314
- − Depreciation
- −$3,055
- Taxable income
- $3,751
- Est. tax owed @ 24.0%
- −$900
- After-tax cash flow
- $4,358/yr
For passive investors: Depreciation is non-cash, so a rental often shows a tax loss while cash-flowing — sheltering income. Rental losses are passive: they offset passive income freely, and up to $25,000/yr can offset ordinary (W-2) income if you actively participate and your MAGI is under $100k (phasing out to $0 by $150k); unused losses carry forward. On sale, claimed depreciation is recaptured at up to 25%, and gains may owe capital-gains tax (a 1031 exchange can defer both). Figures are a year-1 estimate at your 24.0% rate — not tax advice; consult a CPA.
Schools (NCES district)
- District
- Kansas City 33
- NCES district ID
- 2916400
- Math proficiency
- 12% ▼ -8.00%
- Reading proficiency
- 24% ▬ 0.00%
- Median HH income
- $35,227
- Composite
- 14.8/100
- National rank
- #9387
- State rank
- #308 of 324 in MO
Livability — Kansas City
- Score
- 78/100
- State rank
- #28
- US rank
- #2671
Category grades
Schools grade is shown separately in the Schools card above.
Census & demographics
- Census place
- Kansas City, MO
- County
- Jackson County · 687,798 people
- City population
- 439,467
- Metro
- Kansas City, MO-KS
- Population (ZIP)
- 10,925
- Household income
- $46,241
- Rent vs Own
- Severe rent burden
- 541.0
Population outlook (Jackson County) Hauer SSP2
- Today (2025)
- 719,589 people
- By 2030
- 731,456 · +1.6%
- By 2040
- 746,689 · +3.8%
- By 2050
- 749,289 · +4.1%
- By 2075
- 736,227 · +2.3%
- By 2100
- 668,210 · -7.1%
Race, ethnicity, and origin ACS 2023
- Neighborhood character
- Diverse neighborhood (Simpson 0.68)
- Race & ethnicity
- Hispanic / Latino 43% White 30% Black 20% Two or more races 10% Asian 4% Native American 2%
- Hispanic origin (detail)
- Mexican 30% Cuban 1%
- Common ancestry
- Italian 2% Hispanic 1% Serbian 1%
- Foreign-born
- 32% · Canada, Vietnam
- Languages at home
- 52% English-only · Spanish 35% Vietnamese 2% Arabic 2%
Political lean MEDSL · Jackson
- 2024 margin
- D (+19.3) · D 58.9% · R 39.5% · Other 1.6%
- 2008→2024 swing
- -6.1pp toward R · 2008: 25.4pp · 2024: 19.3pp
- All cycles
- 2024: D+19.3 2020: D+22.0 2016: D+16.6 2012: D+19.0 2008: D+25.4
Not yet ingested
- Civics
- —
Market trends
- HPI YoY
- ▼ -125.95%
- Current HPI
- 358.4244
- Rent YoY
- ▲ 2.20%
- Metro
- Kansas City, MO-KS
- State GDP YoY
- ▲ 1.84%
- F500 in state
- 20
Industry mix (Fortune 500 HQ in MO)
| Industry | F500 HQs | Revenue |
|---|---|---|
| Healthcare | 1 | $163B |
|
||
| Insurance | 1 | $21B |
|
||
| Industrial Technology | 1 | $17B |
|
||
| Retail | 1 | $16B |
|
||
| Industrial Distribution | 1 | $10B |
|
||
| Utilities | 1 | $9B |
|
||
Price history
+321.7% since first listed14 events — show timeline
- 2026-06-16 Price Changed $105,000 Heartland MLS as Distributed by MLS Grid
- 2026-06-01 Listed $115,000 Heartland MLS as Distributed by MLS Grid
- 2026-05-27 Listing Removed — Heartland MLS as Distributed by MLS Grid
- 2026-04-19 Listed $115,000 Heartland MLS as Distributed by MLS Grid
- 2024-11-01 Rental Removed $1,000 APPFOLIO
- 2024-10-22 Price Changed $1,000 APPFOLIO
- 2024-10-03 Listed for Rent $900 APPFOLIO
- 2022-12-05 Rental Removed — RENT.
- 2008-04-17 Sold (Public Records) — Public Records
- 2008-04-04 Sold (MLS) — Heartland MLS as Distributed by MLS Grid
- 2007-12-10 Listed $24,900 Heartland MLS as Distributed by MLS Grid
- 2000-02-25 Sold (Public Records) — Public Records
- 2000-02-25 Sold (Public Records) — Public Records
- 1993-02-25 Sold (Public Records) — Public Records
Property tax history
+4.3%/yrLatest (2025): $590 · -24.4% YoY. Source: county tax records.
Cash-flow waterfall
monthlySold comps — $/sqft
last 12 mo · ≤1 miLoading sold comps…