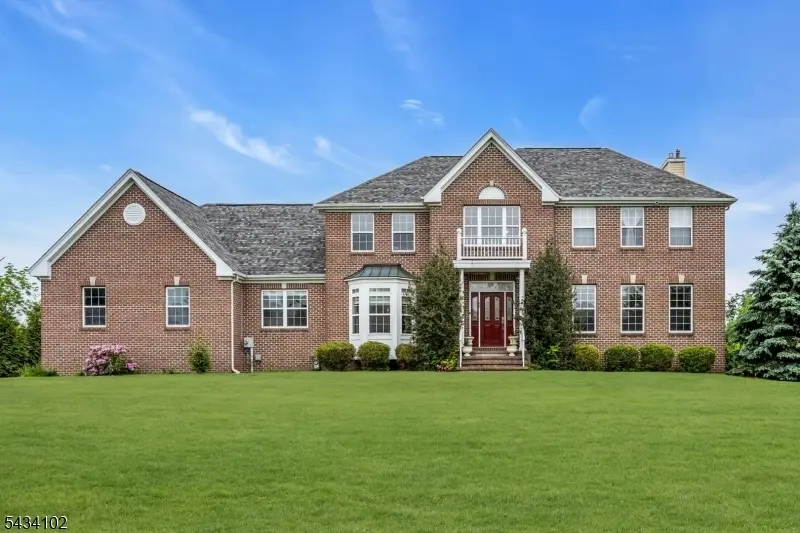
27 Music Mountain Blvd · West Amwell, NJ
Flood risk 1/10 · Minimal
- FEMA flood zone
- X (unshaded)
- Chance of flooding over 30 yrs
- 0.0%
- Est. flood insurance / yr
- $507 – $1,088
Fire risk 3/10 · Minor
- Est. fire insurance / yr
- $526 – $976
Heat risk 5/10 · Moderate
- Hot days now (above 101°F)
- 7 days/yr
- Hot days in 30 yrs
- 15 days/yr
Wind risk 6/10 · Moderate
- Chance of severe wind over 30 yrs
- 27.0%
Air-quality risk 3/10 · Minor
- Unhealthy air days now
- 2 days/yr
- Unhealthy air days in 30 yrs
- 3 days/yr
Risk factors via First Street. Map © Google.
Why this score? — see what drove the B- grade
The composite is a weighted blend of 9 inputs, each scored 0–100. Each bar is that input's sub-score; the figure is the points it added to the 100-point composite (weight × sub-score).
- Cash flow +30.0/30.0
- 1% rule +10.0/10.0
- DSCR +10.0/10.0
- Appreciation +5.0/10.0
- Schools +2.8/10.0
- Rent growth +2.5/5.0
- Livability +2.5/5.0
- Condition / age +2.5/5.0
- ARV discount +0.2/15.0
$980,000
🖨 Deal sheet 📄 Offer letter ✓ Due diligence
Listing remarks
Welcome to your private oasis in the highly desirable Estates at West Amwell! This stately Coventry model home showcases a Georgian-inspired brick facade and an open-concept floor plan bathed in abundant natural light. A dramatic two-story foyer with a cathedral ceiling and designer chandelier welcomes you inside, flowing seamlessly into formal living and dining rooms. At the heart of the home, the chef's kitchen features stainless steel appliances, quartz countertops, a large breakfast bar, and a sun-filled dining area. From the kitchen, step directly out onto a maintenance-free deck that overlooks a private, wooded backyard with scenic views and a sparkling in-ground pool. The main level
Key facts
- 1.02 acre lot
- 3 garage spots
- Pool
Property features AI
Finance
- HOA & community: Pets allowed
Exterior
- Parking: Attached garage with garage door opener (3 garage spaces); Blacktop driveway
- Utilities: Public water; Septic sewer; Electric service; Natural gas; All utilities underground; Cable TV available (garbage may be extra charge)
- Home design: Colonial style; Brick and vinyl siding; Asphalt shingle roof; Approximate year built (listed as approximate)
- Construction: Brick exterior accents; Vinyl siding
- Exterior features: Deck; Patio; Metal fence; In-ground pool with liner; Mountain view lot; Conservation easement
Interior
- Kitchen: 22x15 kitchen with breakfast bar and eat-in space; Pantry; Gas cooktop; Wall oven(s) (electric); Microwave; Refrigerator; Dishwasher
- Bedrooms: Master suite with full bath and walk-in closet (second level); Bedroom 1: 20x21 (second level); Bedroom 2: 12x12 (second level); Bedroom 3: 11x12 (second level); Bedroom 4: 13x12 (second level)
- Flooring: Carpeting; Tile; Wood
- Bathrooms: Three full bathrooms; Master bath with soaking tub and stall shower
- Heating & cooling: Two heating units (forced hot air, natural gas); Two central air units
- Interior features: Blinds; Carbon monoxide detector; Fire extinguisher; Shades; Smoke detector; Walk-in closet; Finished full walkout basement; One gas fireplace in the family room
- Laundry & utility: First-floor laundry room; Dryer; Utility room in basement
Neighborhood map
What this means for you Summary
Snapshot
- This is a 4-bed/3.0-bath single-family listed at $980k.
Deal economics
- At list price, monthly cash flow is $13k ($154k/yr) — positive.
- The deal already cash-flows at list — no discount required.
- Meets the 1% rule at list price ($25k rent vs $980k).
- Recommended offer: $965k (1.5% below list) — sets the bar for market timing.
Location & tenants
- Location reads: area grade B — affects rentability + tenant quality, not the cash-flow math above.
- South Hunterdon Regional School District (rural): math 13% / reading 43% proficiency, ranked #335 of 472 in NJ (top 71%) — low school quality limits family demand, transient renter base, plan for 1-2y turnover; only 14% free/reduced lunch — higher-income household profile.
- Market conditions: 1 active listings in the ZIP; 1 comparable units currently listed for rent nearby; 389 units permitted in Hunterdon County in 2024 (180 in 5+ unit buildings).
Forward outlook
- In year one you build about $36k of equity ($7k loan paydown + $29k appreciation (3.0% local appreciation)).
- Hunterdon County population projected to shrink 8% by 2050 — rents likely to lag national; underwrite the cash flow, not the appreciation.
- At projected returns (3.0% appreciation + 3.0% rent growth), your $274k cash investment doubles in ~2 years — after that, you're playing with house money.
- By year 2, paydown + projected appreciation supports a ~$59k cash-out refi (75% LTV) — recoverable capital for the next deal without selling this one.
Negotiation context
- It's been on market 19 days — a 2% lower offer ($965k) is reasonable based on typical stale-listing flexibility.
- 4 sale attempts since 10y ago; this cycle's ask is 64% above the opening price — seller raised mid-cycle; expect resistance to lowballs.
- Current owner paid $580k; list at $980k implies a 69% gain — meaningful room to come down on a strong offer.
Risks & watch-outs
- Climate carrying-cost: major wind risk, 27% chance of damaging wind over 30y; extreme-heat days projected 7→15/yr by 2055 (HVAC capex compounding) — expect insurance premiums to compound above CPI over the hold.
Questions for the listing agent
- Is there a deadline driving the sale (1031 exchange, divorce, estate, relocation)? That informs how much negotiation room exists.
- What's the average days-on-market for RENTAL listings here right now (not sales)? A rising rental-DOM trend means longer vacancies and softer asking-rent achievability than the comps imply.
- What's the recent tenant-quality profile in this submarket — average credit score on applications, eviction rate, late-payment / NSF rate, and stable-employment percentage? A property-management company in the area should have these aggregated.
- How much new for-sale + rental construction is in the pipeline within 1–3 miles? Heavy new supply typically softens prices + rents 12–24 months out; constrained supply supports both.
Investment metrics
- 1% rule
- 2.56% ✓
- Cap rate
- 21.98%
- Cash-on-cash
- 56.02%
- DSCR
- 3.49
- GRM
- 3.3
CMA / ARV
- ARV (on-the-fly)
- $842,764
- Comps found
- 2
Show comp detail 2 sales within ~0.75 mi
| Address | Dist | Beds/Ba | Sqft | Sold | Price | $/sf | Match |
|---|---|---|---|---|---|---|---|
| 4 Culture Ct | 0.13mi | 4/2.5 | 3,211 (-6%) | 13mo | $793,000 | $247 | 71 |
| 247 N Main St | 0.62mi | 3/2.0 (-1) | 3,270 (-4%) | 2mo | $740,000 | $226 | 54 |
Match score weights: distance 35% · size 25% · config 20% · recency 20%. Top-matched comps best support the ARV.
Projected returns pro-forma
3.0% appreciation · 3.0% rent growth · sell at horizon
- IRR
- 61.0%
- Equity multiple
- 4.41×
- Total profit
- $934,395
- Equity at exit
- $440,650
- IRR
- 60.6%
- Equity multiple
- 8.96×
- Total profit
- $2,183,915
- Equity at exit
- $679,095
Cash invested: $274,400 (down + closing). Projections, not guarantees.
Landlord ↔ Tenant lean methodology
- Overall (STATE)
- 21 Tenant-Leaning
- State New Jersey
- 21 Tenant-Leaning · D+6
- County
- — inherits STATE
- City
- — inherits STATE
ZIP-level market 08530-3435
- Active inventory
- 1
- Price-to-rent
- 3.3×
Monthly cashflow live
- Estimated rent
- $25,101 medium interval (Pro) →
- Mortgage (P&I)
- −$5,139
- Tax from tax record
- −$1,473 /mo · $17,679/yr
- Insurance
- −$408
- HOA
- −$0
- Vacancy / Maint / Mgmt
- −$5,271
- Net cashflow
- $12,809
Break-even live
UW: 25.0% down · 7.5% · 30yr · 1.5% tax · 5.0% vac · 8.0% maint · 8.0% mgmt
Financing live
Cash to close
- Down payment
- $245,000
- Closing costs
- $29,400
- Reserves months
- —
- Total cash needed
- —
Loan-product check · same deal, 3 products live
Conventional
25% down · 7.5% · 30yr
- Down + closing
- —
- Monthly P&I
- —
- Monthly cashflow
- —
- DSCR
- —
- Eligible?
- —
Personal DTI + credit; lowest rate.
DSCR
20% down · 8.5% · 30yr
- Down + closing
- —
- Monthly P&I
- —
- Monthly cashflow
- —
- DSCR
- —
- Eligible?
- —
No personal income docs; deal must DSCR.
Hard money
10% down · 12.0% · 12mo
- Down + closing
- —
- Monthly P&I
- —
- Monthly cashflow
- —
- DSCR
- —
- Eligible?
- —
Short-term bridge; refi at stabilization.
Rent comps 1 comps
| Address | Beds | Baths | Sqft | Rent | $/sqft | DOM | Units | Dist |
|---|---|---|---|---|---|---|---|---|
| 9 Arnett Ave Unit 1380124P Lambertville, NJ | 4.0 | 2.0 | 2497 | $25,101 | $10.05 | 43d | 1 | 0.70mi |
Listing history 30 events
-
2026-06-18days on market $980,000 Active 19 DOM
-
2026-06-17days on market $980,000 Active 18 DOM
-
2026-06-16days on market $980,000 Active 17 DOM
-
2026-06-15days on market $980,000 Active 16 DOM
-
2026-06-13days on market $980,000 Active 14 DOM
-
2026-06-09days on market $980,000 Active 10 DOM
-
2026-06-08days on market $980,000 Active 9 DOM
-
2026-06-07days on market $980,000 Active 8 DOM
-
2026-06-04days on market $980,000 Active 5 DOM
-
2026-06-03days on market $980,000 Active 4 DOM
-
2026-06-02days on market $980,000 Active 3 DOM
-
2026-06-01days on market $980,000 Active 2 DOM
-
2026-05-28historical $980,000
-
2025-08-12price $974,998
-
2016-12-19soldstatus $580,000
-
2016-12-08soldstatus $580,000 Sold
-
2016-11-19historical
-
2016-11-18soldstatus $580,000
-
2016-11-18soldstatus $580,000 Sold
-
2016-11-02status Under Contract
-
2016-10-31soldstatus $580,000 Sold
-
2016-10-17status Under Contract
-
2016-10-15soldstatus $580,000 Sold
-
2016-09-26status Under Contract
-
2016-08-27historical
-
2016-04-21status Active
-
2016-04-21historical
-
2016-04-13$599,000 Active
-
2016-04-12$599,000 Active
-
2016-04-08$599,000
ⓘ Source: listings_history table (triggers on properties + properties_extension) + one-shot
backfill from property_details.listing_events for pre-trigger history.
Tax reassessment forecast NJ · Partial reset (capped growth)
- Current annual tax
- $17,679 · $1,473/mo
- Projected year-2 tax
- $21,041 · $1,753/mo
- Expected delta
- +$3,361/yr (+$280/mo · 19.0%)
ⓘ Screening estimate from a state-policy table — verify with the county assessor before closing.
Climate risk First Street
- Flood 1/10 Low FEMA zone X (unshaded) · 0% chance over 30 yrs
- Wildfire 3/10 Moderate
- Heat 5/10 Major 7 d/yr ≥101°F today · 15 d/yr by 30 yrs out
- Wind 6/10 Major 27% chance of damaging wind over 30 yrs
- Air quality 3/10 Moderate 2 unhealthy d/yr today · 3 by 30 yrs out
Nearby sold comps map
Loading sold comps map…
Walkable amenities ~0.75 mi
Loading nearby amenities…
Taxation est. · year 1
- Rental income
- $301,212
- − Mortgage interest
- −$54,895
- − Property taxes
- −$17,679
- − Insurance
- −$4,900
- − Repairs & maintenance
- −$24,097
- − Management
- −$24,097
- − Depreciation
- −$28,509
- Taxable income
- $147,034
- Est. tax owed @ 24.0%
- −$35,288
- After-tax cash flow
- $118,419/yr
For passive investors: Depreciation is non-cash, so a rental often shows a tax loss while cash-flowing — sheltering income. Rental losses are passive: they offset passive income freely, and up to $25,000/yr can offset ordinary (W-2) income if you actively participate and your MAGI is under $100k (phasing out to $0 by $150k); unused losses carry forward. On sale, claimed depreciation is recaptured at up to 25%, and gains may owe capital-gains tax (a 1031 exchange can defer both). Figures are a year-1 estimate at your 24.0% rate — not tax advice; consult a CPA.
Schools (NCES district)
- District
- South Hunterdon Regional School District
- NCES district ID
- 3400769
- Math proficiency
- 13% ▼ -27.00%
- Reading proficiency
- 43% ▼ -17.00%
- Median HH income
- $82,621
- Composite
- 27.54/100
- National rank
- #6948
- State rank
- #335 of 472 in NJ
Livability — West Amwell
No livability data for this city. (Only ~50 U.S. cities are tracked.)
Census & demographics
No demographic data for this ZIP.
Market trends
- HPI YoY
- —
- Current HPI
- —
- Rent YoY
- —
- Metro
- —
- State GDP YoY
- ▲ 2.05%
- F500 in state
- 34
Industry mix (Fortune 500 HQ in NJ)
| Industry | F500 HQs | Revenue |
|---|---|---|
| Consumer Goods | 3 | $31B |
|
||
| Pharmaceuticals | 2 | $153B |
|
||
| Technology | 2 | $21B |
|
||
| Insurance | 2 | $20B |
|
||
| Healthcare | 2 | $19B |
|
||
| Financial Services | 1 | $70B |
|
||
Price history
+63.6% since first listed18 events — show timeline
- 2026-05-28 Coming Soon $980,000 GSMLS
- 2025-08-12 Price Changed $974,998 CJMLS
- 2016-12-19 Sold (Public Records) $580,000 Public Records
- 2016-12-08 Sold (MLS) $580,000 GSMLS
- 2016-11-19 Listing Removed — BRIGHT MLS
- 2016-11-18 Sold (MLS) $580,000 TREND
- 2016-11-18 Sold (MLS) $580,000 BRIGHT MLS
- 2016-11-02 Pending — TREND
- 2016-10-31 Sold (MLS) $580,000 TREND
- 2016-10-17 Pending — TREND
- 2016-10-15 Sold (MLS) $580,000 TREND
- 2016-09-26 Pending — TREND
- 2016-08-27 Delisted — GSMLS
- 2016-04-21 Relisted — GSMLS
- 2016-04-21 Delisted — GSMLS
- 2016-04-13 Listed $599,000 TREND
- 2016-04-12 Listed $599,000 GSMLS
- 2016-04-08 Listed $599,000 BRIGHT MLS
Property tax history
+1.8%/yrLatest (2025): $17,679 · +3.5% YoY. Source: county tax records.
Cash-flow waterfall
monthlySold comps — $/sqft
last 12 mo · ≤1 miLoading sold comps…