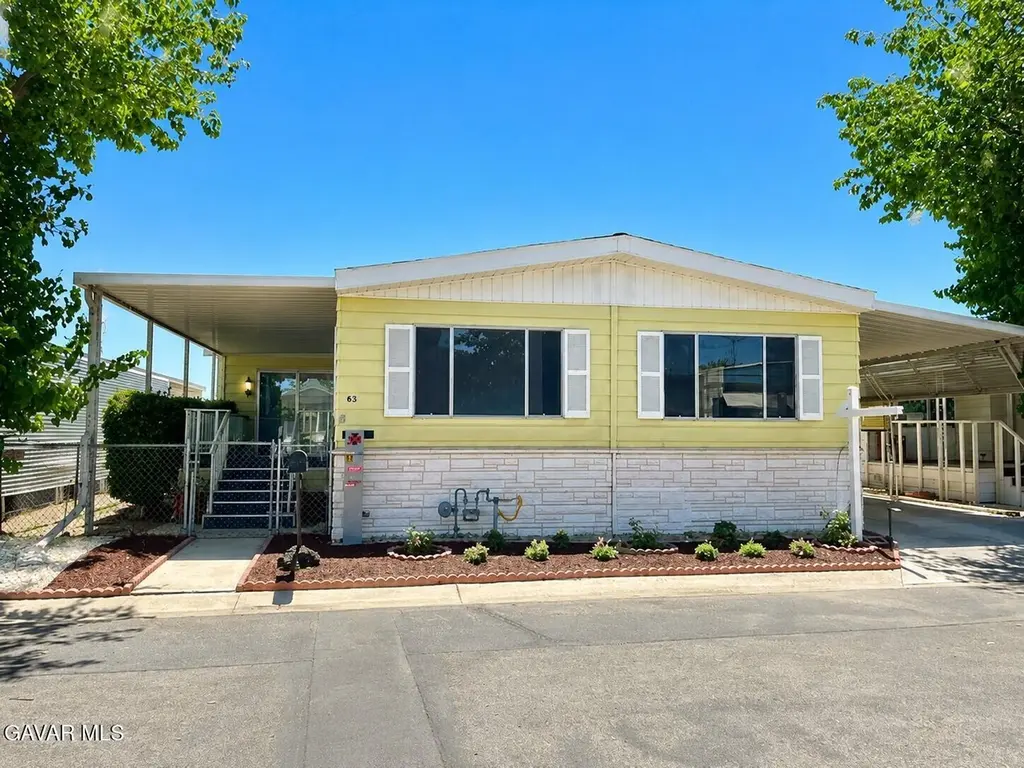
2550 E Avenue I #85 · Lancaster, CA
Flood risk 3/10 · Minor
- FEMA flood zone
- X (shaded)
- Chance of flooding over 30 yrs
- 0.1%
- Est. flood insurance / yr
- $507 – $1,088
Fire risk 5/10 · Moderate
- Est. fire insurance / yr
- $659 – $1,223
Heat risk 7/10 · Major
- Hot days now (above 101°F)
- 5 days/yr
- Hot days in 30 yrs
- 12 days/yr
Wind risk 1/10 · Minimal
- Chance of severe wind over 30 yrs
- —
Air-quality risk 8/10 · Major
- Unhealthy air days now
- 16 days/yr
- Unhealthy air days in 30 yrs
- 21 days/yr
Risk factors via First Street. Map © Google.
Why this score? — see what drove the C+ grade
The composite is a weighted blend of 9 inputs, each scored 0–100. Each bar is that input's sub-score; the figure is the points it added to the 100-point composite (weight × sub-score).
- Cash flow +25.2/30.0
- 1% rule +10.0/10.0
- DSCR +8.3/10.0
- ARV discount +6.8/15.0
- Condition / age +4.0/5.0
- Livability +3.4/5.0
- Rent growth +2.5/5.0
- Schools +2.1/10.0
- Appreciation +0.0/10.0
$139,900
🖨 Deal sheet 📄 Offer letter ✓ Due diligence
Listing remarks MLS
Beautiful and spacious. Great 55+ property
Key facts
- New flooring
- New paint
- New refrigerator
Tags
Property features AI
Finance
- Other: Two sheds on the unit; Length 60 ft, width 24 ft; Multiple serial/ID numbers on file
- HOA & community: Park amenities include recreation area, clubhouse/rec room, and pool; Park manager: Cathy Bremmer (661-946-1316); New space rent listed as $750; deposit noted ($5,000) — contact park for current fees
Exterior
- Parking: New space rent applies (park rules); Contact park for space/parking details
- Security: Gated community
- Utilities: Individual utility meter
- Home design: Mobile home (manufactured 1976); Seniors-only park; Located in a gated park (The Californian), space #85
- Construction: Composition shingle roof; Patio section with torch-down roofing; Skirted exterior; Manufactured by Ramada
- Exterior features: Block fencing in rear only; Awning (2); Porch (2); Shed (2)
Interior
- Kitchen: Dishwasher; Refrigerator; Gas range; Double oven; Disposal
- Bathrooms: 1 full bath; 1 three-quarter bath
- Heating & cooling: Central heating (electric); Central air; Evaporative/room units (wall/window)
- Interior features: Dishwasher; Refrigerator; Gas range; Double oven; Disposal
Neighborhood map
What this means for you Summary
Snapshot
- This is a 2-bed/2.0-bath manufactured listed at $140k. Condition is rated good.
Deal economics
- At list price, monthly cash flow is $313 ($4k/yr) — positive.
- The deal already cash-flows at list — no discount required.
- Meets the 1% rule at list price ($3k rent vs $140k).
- Recommended offer: $138k (1.5% below list) — sets the bar for market timing.
- Cap rate 9.0% vs local median 4.3% in Lancaster — top-decile yield for the area; either an underpriced asset or a hidden risk that comps aren't pricing in. Stress-test before assuming the spread holds.
Location & tenants
- Location reads 68/100 on livability (#282 in CA) — a middle-class / working-renter tenant base. Strengths: commute A+, housing A+, amenities B+; Watch: health & safety C-, schools F, crime F.
- Eastside Union Elementary (suburban): math 15% / reading 27% proficiency, ranked #1,226 of 1,400 in CA (top 88%) — low school quality limits family demand, transient renter base, plan for 1-2y turnover; 76% free/reduced lunch — lower-income household profile, screen leases tightly.
- Market conditions: Rents flat; 1169 active listings in the ZIP; 20 comparable units currently listed for rent nearby; rentals leasing fast (median 3d on market — plan ~1-2 weeks tenant-placement turnaround); 19,697 units permitted in Los Angeles County in 2024 (9,426 in 5+ unit buildings).
- This rent runs 44% of the median local income ($70k/yr) — at the standard rent-burdened threshold; future hikes will face affordability resistance.
Forward outlook
- Local home prices are declining (-3.0%/yr); year-one equity from $967 of loan paydown is wiped out by about $4k of value loss. Plan a longer hold.
- Los Angeles County population projected at +9% by 2050 — modest demand growth; plan on rents tracking national, not racing it.
Negotiation context
- It's been on market 24 days — a 2% lower offer ($138k) is reasonable based on typical stale-listing flexibility.
- 2 sale attempts; this cycle's ask has dropped $10k (7%) from the opening price — seller is motivated, your offer sets the floor, not the list.
- Current owner paid $70k; list at $140k implies a 100% gain — meaningful room to come down on a strong offer.
Risks & watch-outs
- Watch-outs: HOA is 29% of rent.
- Climate carrying-cost: moderate wildfire risk; extreme-heat days projected 5→12/yr by 2055 (HVAC capex compounding) — expect insurance premiums to compound above CPI over the hold.
Questions for the listing agent
- Built in 1977 — when were the roof, HVAC, electrical panel, plumbing, and water heater last replaced?
- What does the HOA fee cover, when was the last increase, and are there any pending special assessments or reserve-fund shortfalls?
- Is there a deadline driving the sale (1031 exchange, divorce, estate, relocation)? That informs how much negotiation room exists.
- Schools are F-rated, which usually means shorter tenancies and higher turnover. Who's the typical renter profile here, and what's been the actual vacancy rate?
- Crime grade is F in this area — have there been break-ins, vandalism, or insurance claims at this property in the last 3 years? What carrier currently insures it and at what premium?
- What's the average days-on-market for RENTAL listings here right now (not sales)? A rising rental-DOM trend means longer vacancies and softer asking-rent achievability than the comps imply.
- What's the recent tenant-quality profile in this submarket — average credit score on applications, eviction rate, late-payment / NSF rate, and stable-employment percentage? A property-management company in the area should have these aggregated.
- How much new for-sale + rental construction is in the pipeline within 1–3 miles? Heavy new supply typically softens prices + rents 12–24 months out; constrained supply supports both.
Investment metrics
- 1% rule
- 1.84% ✓
- Cap rate
- 8.98%
- Cash-on-cash
- 9.59%
- DSCR
- 1.43
- GRM
- 4.5
CMA / ARV
- ARV (on-the-fly)
- $137,760
- Comps found
- 12
Show comp detail 12 sales within ~0.75 mi
| Address | Dist | Beds/Ba | Sqft | Sold | Price | $/sf | Match |
|---|---|---|---|---|---|---|---|
| 2550 E Avenue I #55 | 0.04mi | 3/2.0 (+1) | 1,680 (0%) | 4mo | $13,000 | $8 | 90 |
| 2550 E Ave I #40 | 0.04mi | 2/2.0 | 1,664 (-1%) | 9mo | $120,000 | $72 | 89 |
| 2550 E Avenue I Spc 141 | 0.04mi | 3/2.0 (+1) | 1,782 (+6%) | 8mo | $164,000 | $92 | 76 |
| 2550 E Avenue I #94 | 0.04mi | 2/2.0 | 1,536 (-9%) | 10mo | $85,000 | $55 | 76 |
| 2550 E Avenue I #118 | 0.04mi | 2/2.0 | 1,536 (-9%) | 12mo | $126,000 | $82 | 73 |
| 2550 E Avenue I #110 | 0.04mi | 2/2.0 | 1,440 (-14%) | 6mo | $123,050 | $85 | 69 |
| 2550 East Ave I | 0.04mi | 3/2.0 (+1) | 1,460 (-13%) | 8mo | $117,150 | $80 | 64 |
| 2550 E East Avenue I #42 | 0.15mi | 3/2.0 (+1) | 1,460 (-13%) | 8mo | $117,150 | $80 | 59 |
| 45465 25th St E #72 | 0.53mi | 3/2.0 (+1) | 1,792 (+7%) | 2mo | $201,000 | $112 | 57 |
| 2121 E Avenue I Spc 81 | 0.46mi | 3/2.0 (+1) | 1,848 (+10%) | 0mo | $115,000 | $62 | 57 |
| 2545 E Avenue I #66 | 0.42mi | 3/2.0 (+1) | 1,440 (-14%) | 8mo | $155,000 | $108 | 45 |
| 3157 E Avenue I Unit F11 | 0.75mi | 3/2.0 (+1) | 1,440 (-14%) | 1mo | $150,000 | $104 | 35 |
Match score weights: distance 35% · size 25% · config 20% · recency 20%. Top-matched comps best support the ARV.
Projected returns pro-forma
-3.0% appreciation · 0.14% rent growth · sell at horizon
- IRR
- -6.8%
- Equity multiple
- 0.76×
- Total profit
- $-9,412
- Equity at exit
- $20,860
- IRR
- -4.0%
- Equity multiple
- 0.79×
- Total profit
- $-8,340
- Equity at exit
- $12,096
Cash invested: $39,172 (down + closing). Projections, not guarantees.
Landlord ↔ Tenant lean methodology
- Overall (STATE)
- 18 Strongly Tenant-Friendly
- State California
- 18 Strongly Tenant-Friendly · D+13
- County
- — inherits STATE
- City
- — inherits STATE
ZIP-level market 93535
- Home prices YoY
- -24.3%
- Rents YoY
- 0.1%
- Active inventory
- 1169
- Price-to-rent
- 4.5×
Monthly cashflow live
- Estimated rent
- $2,570 high interval (Pro) →
- Mortgage (P&I)
- −$734
- Tax est. 1.5%
- −$175 /mo · $2,098/yr
- Insurance
- −$58
- HOA
- −$750
- Vacancy / Maint / Mgmt
- −$540
- Net cashflow
- $313
Break-even live
UW: 25.0% down · 7.5% · 30yr · 1.5% tax · 5.0% vac · 8.0% maint · 8.0% mgmt
Financing live
Cash to close
- Down payment
- $34,975
- Closing costs
- $4,197
- Reserves months
- —
- Total cash needed
- —
Loan-product check · same deal, 3 products live
Conventional
25% down · 7.5% · 30yr
- Down + closing
- —
- Monthly P&I
- —
- Monthly cashflow
- —
- DSCR
- —
- Eligible?
- —
Personal DTI + credit; lowest rate.
DSCR
20% down · 8.5% · 30yr
- Down + closing
- —
- Monthly P&I
- —
- Monthly cashflow
- —
- DSCR
- —
- Eligible?
- —
No personal income docs; deal must DSCR.
Hard money
10% down · 12.0% · 12mo
- Down + closing
- —
- Monthly P&I
- —
- Monthly cashflow
- —
- DSCR
- —
- Eligible?
- —
Short-term bridge; refi at stabilization.
Rent comps 20 comps
| Address | Beds | Baths | Sqft | Rent | $/sqft | DOM | Units | Dist |
|---|---|---|---|---|---|---|---|---|
| 44709 26th St E Lancaster, CA | 3.0 | 2.0 | 1316 | $2,300 | $1.75 | 18d | 1 | 0.46mi |
| 45465 25th St E Spc 10 Lancaster, CA | 3.0 | 2.0 | 1690 | $825 | $0.49 | 3d | 1 | 0.58mi |
| 2624 Via Verona Lancaster, CA | 3.0 | 2.5 | 1563 | $2,900 | $1.86 | 1d | 1 | 0.78mi |
| 1734 Lightcap St Lancaster, CA | 3.0 | 2.0 | 1467 | $2,700 | $1.84 | 1d | 1 | 0.82mi |
| 3344 E Avenue H14 Lancaster, CA | 3.0 | 2.0 | 2032 | $3,200 | $1.57 | 3d | 1 | 0.93mi |
| 45041 Colleen Dr Lancaster, CA | 3.0 | 3.0 | 1303 | $3,100 | $2.38 | 1d | 1 | 0.95mi |
| 2500 Topaz Ln Lancaster, CA | 3.0 | 2.0 | 1274 | $2,800 | $2.20 | 24d | 1 | 0.95mi |
| 1827 East Avenue J Unit 2 Lancaster, CA | 2.0 | 2.0 | 1050 | $1,850 | $1.76 | 17d | 1 | 1.05mi |
| 1647 Orchid Ln Lancaster, CA | 3.0 | 3.0 | 1084 | $1,950 | $1.80 | 22d | 1 | 1.08mi |
| 44236 20th St E Lancaster, CA | 2.0 | 1.0–2.5 | 900 | $1,712 | $1.90 | 1d | 1 | 1.15mi |
| 44532 15th St E #7 Lancaster, CA | 2.0 | 2.0 | 1062 | $2,150 | $2.02 | 24d | 1 | 1.21mi |
| 44532 15th St E #7 Lancaster, CA | 2.0 | 2.0 | 1062 | $2,050 | $1.93 | 1d | 1 | 1.21mi |
| 3264 Topaz Ln Lancaster, CA | 3.0 | 2.0 | 1750 | $3,299 | $1.89 | 1d | 1 | 1.26mi |
| 44436 15th St E Lancaster, CA | 2.0 | 2.0 | 1056 | $2,024 | $1.92 | 1d | 1 | 1.26mi |
| 44243 Mahogany St Lancaster, CA | 3.0 | 2.0 | 1800 | $950 | $0.53 | 22d | 1 | 1.26mi |
| 45444 Spahn Ln Lancaster, CA | 3.0 | 2.0 | 1908 | $3,000 | $1.57 | 1d | 1 | 1.31mi |
| 1743 , CA | 1.0–4.0 | 1.0–2.0 | 934 | $1,803 | $1.93 | 1d | 17 | 1.33mi |
| 44732 12th St E Lancaster, CA | 3.0 | 2.0 | 1426 | $2,600 | $1.82 | 15d | 1 | 1.38mi |
| 2835 La Vida Dr Lancaster, CA | 3.0 | 2.0 | 1206 | $2,750 | $2.28 | 22d | 1 | 1.41mi |
| 1545 E Avenue J5 Lancaster, CA | 3.0 | 2.0 | 1741 | $2,899 | $1.67 | 1d | 1 | 1.50mi |
HOA detail
- Monthly dues
- $750 · $9,000/yr
Listing history 18 events
-
2026-06-18days on market $139,900 Active 24 DOM
-
2026-06-17days on market $139,900 Active 23 DOM
-
2026-06-16days on market $139,900 Active 22 DOM
-
2026-06-15days on market $139,900 Active 21 DOM
-
2026-06-13days on market $139,900 Active 19 DOM
-
2026-06-13pricedays on market $139,900 Active 18 DOM
-
2026-06-09days on market $144,900 Active 15 DOM
-
2026-06-08days on market $144,900 Active 14 DOM
-
2026-06-07pricedays on market $144,900 Active 13 DOM
-
2026-06-04days on market $149,900 Active 10 DOM
-
2026-06-03days on market $149,900 Active 9 DOM
-
2026-06-02days on market $149,900 Active 8 DOM
-
2026-06-01days on market $149,900 Active 7 DOM
-
2026-05-31days on market $149,900 Active 6 DOM
-
2026-05-23$149,900 Active
-
2026-02-27soldstatus $70,000 Closed 42-char remark
Show marketing remark (42 chars)
Beautiful and spacious. Great 55+ property
-
2026-02-10historical 42-char remark
Show marketing remark (42 chars)
Beautiful and spacious. Great 55+ property
-
2026-02-09$70,000 42-char remark
Show marketing remark (42 chars)
Beautiful and spacious. Great 55+ property
ⓘ Source: listings_history table (triggers on properties + properties_extension) + one-shot
backfill from property_details.listing_events for pre-trigger history.
Climate risk First Street
- Flood 3/10 Moderate FEMA zone X (shaded) · 10% chance over 30 yrs
- Wildfire 5/10 Major
- Heat 7/10 Severe 5 d/yr ≥101°F today · 12 d/yr by 30 yrs out
- Wind 1/10 Low
- Air quality 8/10 Severe 16 unhealthy d/yr today · 21 by 30 yrs out
Nearby sold comps map
Loading sold comps map…
Walkable amenities ~0.75 mi
Loading nearby amenities…
Taxation est. · year 1
- Rental income
- $30,836
- − Mortgage interest
- −$7,837
- − Property taxes
- −$2,098
- − Insurance
- −$700
- − Repairs & maintenance
- −$2,467
- − Management
- −$2,467
- − HOA
- −$9,000
- − Depreciation
- −$4,070
- Taxable income
- $2,197
- Est. tax owed @ 24.0%
- −$527
- After-tax cash flow
- $3,231/yr
For passive investors: Depreciation is non-cash, so a rental often shows a tax loss while cash-flowing — sheltering income. Rental losses are passive: they offset passive income freely, and up to $25,000/yr can offset ordinary (W-2) income if you actively participate and your MAGI is under $100k (phasing out to $0 by $150k); unused losses carry forward. On sale, claimed depreciation is recaptured at up to 25%, and gains may owe capital-gains tax (a 1031 exchange can defer both). Figures are a year-1 estimate at your 24.0% rate — not tax advice; consult a CPA.
Condition & rehab AI · 12 photos
This recently remodeled, move-in-ready manufactured home features new flooring, appliances, and landscaping, making it an attractive option for both resale and rental.
Value-add opportunities
- Both Paint exterior — Enhances curb appeal and resale value
- Both Replace outdoor furniture — Improves curb appeal and rental value
- Both Install smart home devices — Enhances convenience and appeal to potential buyers
Renovation cost estimate screening
Value-add ROI direction
- Both Paint exterior — Enhances curb appeal and resale value ↑
- Both Replace outdoor furniture — Improves curb appeal and rental value ↑
- Both Install smart home devices — Enhances convenience and appeal to potential buyers ↑
ⓘ Cost ranges are severity-bucket heuristics (US national rule-of-thumb). Get contractor quotes + a written scope before underwriting a rehab budget.
Schools (NCES district)
- District
- Eastside Union Elementary
- NCES district ID
- 0611910
- Math proficiency
- 15% ▲ 1.00%
- Reading proficiency
- 27% ▲ 3.00%
- Median HH income
- $44,840
- Composite
- 21.43/100
- National rank
- #13636
- State rank
- #1226 of 1400 in CA
Livability — Lancaster
- Score
- 68/100
- State rank
- #282
- US rank
- #9504
Category grades
Schools grade is shown separately in the Schools card above.
Census & demographics
- Census place
- Lancaster, CA
- County
- Los Angeles County · 9,444,647 people
- City population
- 194,251
- Metro
- Los Angeles-Long Beach-Anaheim, CA
- Population (ZIP)
- 79,409
- Household income
- $70,360
- Rent vs Own
- Severe rent burden
- 2494.0
Population outlook (Los Angeles County) Hauer SSP2
- Today (2025)
- 10,940,515 people
- By 2030
- 11,256,481 · +2.9%
- By 2040
- 11,729,929 · +7.2%
- By 2050
- 11,948,407 · +9.2%
- By 2075
- 11,818,114 · +8.0%
- By 2100
- 10,842,928 · -0.9%
Race, ethnicity, and origin ACS 2023
- Neighborhood character
- Diverse neighborhood (Simpson 0.63)
- Race & ethnicity
- Hispanic / Latino 55% Two or more races 25% Black 21% White 17% Asian 2% Native American 1%
- Hispanic origin (detail)
- Mexican 42%
- Common ancestry
- Romanian 1% Italian 1% Lithuanian 1%
- Foreign-born
- 13% · Canada
- Languages at home
- 60% English-only · Spanish 37% Tagalog/Filipino 1% Other Indo-European 1%
Political lean MEDSL · Los Angeles
- 2024 margin
- Solid D (+32.9) · D 64.8% · R 31.9% · Other 3.3%
- 2008→2024 swing
- -7.4pp toward R · 2008: 40.4pp · 2024: 32.9pp
- All cycles
- 2024: D+32.9 2020: D+44.2 2016: D+48.0 2012: D+40.0 2008: D+40.4
Not yet ingested
- Civics
- —
Market trends
- HPI YoY
- ▼ -144.13%
- Current HPI
- 449.4494
- Rent YoY
- ▲ 0.14%
- Metro
- Los Angeles-Long Beach-Anaheim, CA
- State GDP YoY
- ▲ 3.21%
- F500 in state
- 116
Industry mix (Fortune 500 HQ in CA)
| Industry | F500 HQs | Revenue |
|---|---|---|
| Technology | 27 | $1,492B |
|
||
| Financial Services | 3 | $174B |
|
||
| Retail | 3 | $44B |
|
||
| Insurance | 3 | $26B |
|
||
| Media / Entertainment | 2 | $115B |
|
||
| Pharmaceuticals / Biotech | 2 | $62B |
|
||
Price history
+114.1% since first listed4 events — show timeline
- 2026-05-23 Listed $149,900 AVMLS
- 2026-02-27 Sold (MLS) $70,000 AVMLS
- 2026-02-10 Listing Removed — AVMLS
- 2026-02-09 Listed $70,000 AVMLS
Cash-flow waterfall
monthlySold comps — $/sqft
last 12 mo · ≤1 miLoading sold comps…