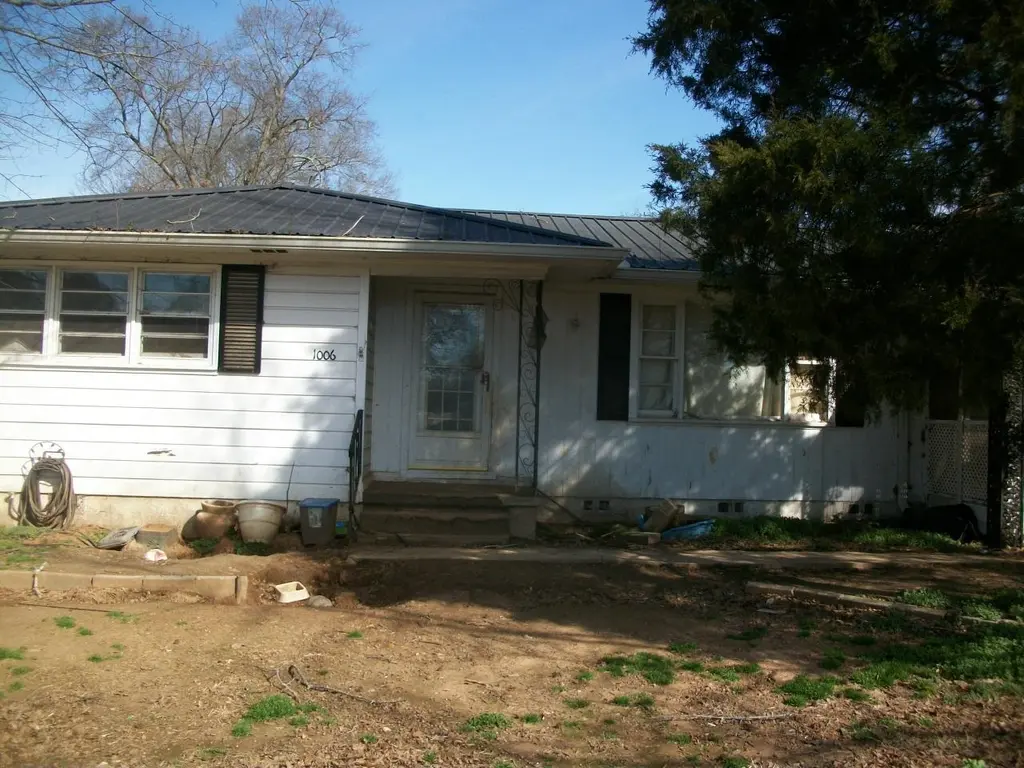
1006 Stadium Dr · Hanceville, AL
Flood risk 1/10 · Minimal
- FEMA flood zone
- X (unshaded)
- Chance of flooding over 30 yrs
- 0.0%
- Est. flood insurance / yr
- $507 – $1,088
Fire risk 4/10 · Minor
- Est. fire insurance / yr
- $916 – $1,700
Heat risk 6/10 · Moderate
- Hot days now (above 106°F)
- 7 days/yr
- Hot days in 30 yrs
- 19 days/yr
Wind risk 6/10 · Moderate
- Chance of severe wind over 30 yrs
- 27.0%
Air-quality risk 3/10 · Minor
- Unhealthy air days now
- 2 days/yr
- Unhealthy air days in 30 yrs
- 4 days/yr
Risk factors via First Street. Map © Google.
Why this score? — see what drove the B- grade
The composite is a weighted blend of 9 inputs, each scored 0–100. Each bar is that input's sub-score; the figure is the points it added to the 100-point composite (weight × sub-score).
- Cash flow +27.6/30.0
- ARV discount +15.0/15.0
- DSCR +9.7/10.0
- 1% rule +6.2/10.0
- Livability +3.1/5.0
- Schools +2.8/10.0
- Rent growth +2.5/5.0
- Condition / age +2.5/5.0
- Appreciation +0.0/10.0
$119,000
🖨 Deal sheet (PDF) 📄 Offer letter ✓ Due diligence
Listing remarks MLS
All offers must be submitted by the Buyer's agent via the RES. NET Agent Portal. If your offer is accepted, you agree to be responsible for an offer submission technology fee of $225.00. The fee will be collected and disbursed by the settlement agent and disbursed at the closing and settlement of the transaction. To submit your buyer's offer, simply click the link below. If you already have a RES. NET Agent account, you will be prompted to log in. If not, you will be prompted to create an account. To begin, click or paste this link into your web browser: https://agent. res.net/Offers. aspx?-1805742 PURCHASER TO VERIFY SQ, FOOTAGE , LAND AMOUNT, SCHOOLD DISTRICT, SEPTIC SYSTEM . AND HEATING AND COOLING SYSTEM. . NO POWER OR WATER ON
Key facts
- 0.41 acre lot
- Parking
- Built 1960
Neighborhood map
What this means for you Summary
Snapshot
- This is a 3-bed/1.0-bath single-family listed at $119k.
Deal economics
- At list price, monthly cash flow is $355 ($4k/yr) — positive.
- The deal already cash-flows at list — no discount required.
- Meets the 1% rule at list price ($1k rent vs $119k).
- Recommended offer: $108k (9.0% below list) — sets the bar for market timing.
- Cap rate 9.9% vs local median 3.7% in Hanceville — top-decile yield for the area; either an underpriced asset or a hidden risk that comps aren't pricing in. Stress-test before assuming the spread holds.
Location & tenants
- Location reads 61/100 on livability (#244 in AL) — a middle-class / working-renter tenant base. Strengths: crime A+, cost of living A+, housing A+; Watch: amenities F, commute F, employment F.
- Cullman County (rural): math 19% / reading 49% proficiency, ranked #49 of 129 in AL (top 38%) — families likely to look elsewhere, expect single-tenant / working-renter base with shorter leases.
- Zoned schools: Hanceville Elementary School (math 14% / reading 46%, grade F, #364 of 627 statewide, top 58%, 624 students, 78% FRL); Hanceville Middle School (math 12% / reading 51%, grade F, #114 of 257 statewide, top 45%, 304 students, 77% FRL); Hanceville High School (math 17% / reading 17%, grade F, #195 of 305 statewide, top 68%, 366 students, 66% FRL) — zoned schools average 74% FRL vs 52% district-wide (22 pts higher); higher-poverty schools than district average — tighter screening recommended.
- Market conditions: 137 active listings in the ZIP; 1 comparable units currently listed for rent nearby; 180 units permitted in Cullman County in 2024 (0 in 5+ unit buildings).
- This rent runs 33% of the median local income ($48k/yr) — at the standard rent-burdened threshold; future hikes will face affordability resistance.
Forward outlook
- Local home prices are declining (-3.0%/yr); year-one equity from $823 of loan paydown is wiped out by about $4k of value loss. Plan a longer hold.
- At projected returns (-3.0% appreciation + 3.0% rent growth), your $33k cash investment doubles in ~9 years — after that, you're playing with house money.
Negotiation context
- It's been on market 102 days — a 9% lower offer ($108k) is reasonable based on typical stale-listing flexibility.
- 2 sale attempts since 11y ago with the ask held roughly flat each time — persistent listings suggest the price (not the market) is what's stuck; bring a comps-based counter.
- Current owner paid $71k; list at $119k implies a 68% gain — meaningful room to come down on a strong offer.
Risks & watch-outs
- Climate carrying-cost: major wind risk, 27% chance of damaging wind over 30y; extreme-heat days projected 7→19/yr by 2055 (HVAC capex compounding) — expect insurance premiums to compound above CPI over the hold.
Questions for the listing agent
- It's been on market 102 days. Have you received any prior offers? Is the seller open to a 9% concession, seller financing, or rate buy-down credit?
- Built in 1960 — when were the roof, HVAC, electrical panel, plumbing, and water heater last replaced?
- Why hasn't it sold? Are there any deal-killer items the seller is aware of (foundation, flood, title, zoning, code violations)?
- Is there a deadline driving the sale (1031 exchange, divorce, estate, relocation)? That informs how much negotiation room exists.
- Schools are D-rated, which usually means shorter tenancies and higher turnover. Who's the typical renter profile here, and what's been the actual vacancy rate?
- What's the average days-on-market for RENTAL listings here right now (not sales)? A rising rental-DOM trend means longer vacancies and softer asking-rent achievability than the comps imply.
- What's the recent tenant-quality profile in this submarket — average credit score on applications, eviction rate, late-payment / NSF rate, and stable-employment percentage? A property-management company in the area should have these aggregated.
- How much new for-sale + rental construction is in the pipeline within 1–3 miles? Heavy new supply typically softens prices + rents 12–24 months out; constrained supply supports both.
Investment metrics
- 1% rule
- 1.12% ✓
- Cap rate
- 9.87%
- Cash-on-cash
- 12.77%
- DSCR
- 1.57
- GRM
- 7.4
CMA / ARV
- ARV (median comp)
- $182,598
- List price
- $119,000
- Delta
- -34.83%
- Verdict
- UNDERPRICED
- Comps
- 20 within 1.0 mi
Show comp detail 12 sales within ~0.75 mi
| Address | Dist | Beds/Ba | Sqft | Sold | Price | $/sf | Match |
|---|---|---|---|---|---|---|---|
| 1207 Elm St | 0.17mi | 4/1.5 (+1) | 1,423 (+5%) | 2mo | $130,000 | $91 | 75 |
| 302 Alabama Ave | 0.44mi | 3/2.0 | 1,369 (+1%) | 1mo | $163,350 | $119 | 73 |
| 108 Self St | 0.35mi | 3/1.0 | 1,320 (-3%) | 7mo | $159,500 | $121 | 73 |
| 616 Blountsville St NE | 0.47mi | 3/2.0 | 1,349 (-1%) | 1mo | $197,500 | $146 | 72 |
| 125 West Railroad Ave SE | 0.40mi | 3/2.0 | 1,449 (+6%) | 1mo | $199,900 | $138 | 66 |
| 110 Ohio Ave NE | 0.36mi | 3/2.0 | 1,264 (-7%) | 4mo | $183,000 | $145 | 64 |
| 116 Kentucky Ave | 0.33mi | 3/2.0 | 1,467 (+8%) | 6mo | $209,000 | $142 | 63 |
| 506 Greenbrier Dr | 0.57mi | 3/2.5 | 1,344 (-1%) | 8mo | $222,000 | $165 | 59 |
| 619 Blountsville St | 0.44mi | 3/2.0 | 1,512 (+11%) | 2mo | $220,000 | $146 | 55 |
| 808 Commercial St | 0.27mi | 3/2.0 | 1,546 (+14%) | 8mo | $239,000 | $155 | 54 |
| 104 Alabama Ave SE | 0.49mi | 2/2.0 (-1) | 1,227 (-10%) | 2mo | $130,000 | $106 | 50 |
| 606 Blountsville St NE | 0.50mi | 2/2.0 (-1) | 1,173 (-14%) | 1mo | $155,000 | $132 | 44 |
Match score weights: distance 35% · size 25% · config 20% · recency 20%. Top-matched comps best support the ARV.
Projected returns pro-forma
-3.0% appreciation · 3.0% rent growth · sell at horizon
- IRR
- 2.5%
- Equity multiple
- 1.10×
- Total profit
- $3,248
- Equity at exit
- $17,743
- IRR
- 12.1%
- Equity multiple
- 1.95×
- Total profit
- $31,694
- Equity at exit
- $10,289
Cash invested: $33,320 (down + closing). Projections, not guarantees.
Landlord ↔ Tenant lean methodology
- Overall (STATE)
- 90 Strongly Landlord-Friendly
- State Alabama
- 90 Strongly Landlord-Friendly · R+15
- County
- — inherits STATE
- City
- — inherits STATE
ZIP-level market 35077
- Home prices YoY
- -12.6%
- Active inventory
- 137
- Price-to-rent
- 7.4×
Monthly cashflow live
- Estimated rent
- $1,339 medium interval (Pro) →
- Mortgage (P&I)
- −$624
- Tax from tax record
- −$29 /mo · $352/yr
- Insurance
- −$50
- HOA
- −$0
- Lot rent
- −$0
- Vacancy / Maint / Mgmt
- −$281
- Net cashflow
- $355
Break-even live
Sensitivity live
| Price | -10% $422 | -5% $388 | +0% $355 | +5% $321 | +10% $287 |
|---|---|---|---|---|---|
| Rent | -10% $249 | -5% $302 | +0% $355 | +5% $407 | +10% $460 |
| Rate | -1.0pp $415 | -0.5pp $385 | base $355 | +0.5pp $324 | +1.0pp $292 |
UW: 25.0% down · 7.5% · 30yr · 1.5% tax · 5.0% vac · 8.0% maint · 8.0% mgmt
Financing live
Cash to close
- Down payment
- $29,750
- Closing costs
- $3,570
- Reserves months
- —
- Total cash needed
- —
Loan-product check · same deal, 3 products live
Conventional
25% down · 7.5% · 30yr
- Down + closing
- —
- Monthly P&I
- —
- Monthly cashflow
- —
- DSCR
- —
- Eligible?
- —
Personal DTI + credit; lowest rate.
DSCR
20% down · 8.5% · 30yr
- Down + closing
- —
- Monthly P&I
- —
- Monthly cashflow
- —
- DSCR
- —
- Eligible?
- —
No personal income docs; deal must DSCR.
Hard money
10% down · 12.0% · 12mo
- Down + closing
- —
- Monthly P&I
- —
- Monthly cashflow
- —
- DSCR
- —
- Eligible?
- —
Short-term bridge; refi at stabilization.
Rent comps 1 comps
| Address | Beds | Baths | Sqft | Rent | $/sqft | DOM | Units | Dist |
|---|---|---|---|---|---|---|---|---|
| 401 College Dr NE Hanceville, AL | 1.0–3.0 | 1.0–2.0 | 762 | $1,562 | $2.05 | 4d | 23 | 1.17mi |
Listing history 21 events
-
2026-06-22days on market $119,000 Active 102 DOM
-
2026-06-21days on market $119,000 Active 101 DOM
-
2026-06-19days on market $119,000 Active 99 DOM
-
2026-06-18days on market $119,000 Active 98 DOM
-
2026-06-17days on market $119,000 Active 97 DOM
-
2026-06-16days on market $119,000 Active 96 DOM
-
2026-06-15days on market $119,000 Active 95 DOM
-
2026-06-14days on market $119,000 Active 93 DOM
-
2026-06-12days on market $119,000 Active 92 DOM
-
2026-06-09days on market $119,000 Active 89 DOM
-
2026-06-08days on market $119,000 Active 88 DOM
-
2026-06-07days on market $119,000 Active 87 DOM
-
2026-06-05days on market $119,000 Active 84 DOM
-
2026-06-03days on market $119,000 Active 83 DOM
-
2026-06-02days on market $119,000 Active 82 DOM
-
2026-06-01days on market $119,000 Active 81 DOM
-
2026-05-31days on market $119,000 Active 80 DOM
-
2026-05-30days on market $119,000 Active 79 DOM
-
2026-03-12$119,000 Active 749-char remark
Show marketing remark (749 chars)
All offers must be submitted by the Buyer's agent via the RES. NET Agent Portal. If your offer is accepted, you agree to be responsible for an offer submission technology fee of $225.00. The fee will be collected and disbursed by the settlement agent and disbursed at the closing and settlement of the transaction. To submit your buyer's offer, simply click the link below. If you already have a RES. NET Agent account, you will be prompted to log in. If not, you will be prompted to create an account. To begin, click or paste this link into your web browser: https://agent. res.net/Offers. aspx?-1805742 PURCHASER TO VERIFY SQ, FOOTAGE , LAND AMOUNT, SCHOOLD DISTRICT, SEPTIC SYSTEM . AND HEATING AND COOLING SYSTEM. . NO POWER OR WATER ON
-
2015-10-19soldstatus $70,750 79-char remark
Show marketing remark (79 chars)
NEW PLUMBING, ROOF 4 YRS OLD. , NEW GARAGE DISP. OAK FLOORS & SUB FLOORS.
-
2015-01-19$69,900 79-char remark
Show marketing remark (79 chars)
NEW PLUMBING, ROOF 4 YRS OLD. , NEW GARAGE DISP. OAK FLOORS & SUB FLOORS.
ⓘ Source: listings_history table (triggers on properties + properties_extension) + one-shot
backfill from property_details.listing_events for pre-trigger history.
Tax reassessment forecast AL · Resets to sale price
- Current annual tax
- $352 · $29/mo
- Projected year-2 tax
- $488 · $41/mo
- Expected delta
- +$136/yr (+$11/mo · 38.7%)
ⓘ Screening estimate from a state-policy table — verify with the county assessor before closing.
Climate risk First Street
- Flood 1/10 Low FEMA zone X (unshaded) · 0% chance over 30 yrs
- Wildfire 4/10 Moderate
- Heat 6/10 Major 7 d/yr ≥106°F today · 19 d/yr by 30 yrs out
- Wind 6/10 Major 27% chance of damaging wind over 30 yrs
- Air quality 3/10 Moderate 2 unhealthy d/yr today · 4 by 30 yrs out
Nearby sold comps map
Loading sold comps map…
Walkable amenities ~0.75 mi
Loading nearby amenities…
Taxation est. · year 1
- Rental income
- $16,064
- − Mortgage interest
- −$6,666
- − Property taxes
- −$352
- − Insurance
- −$595
- − Repairs & maintenance
- −$1,285
- − Management
- −$1,285
- − Depreciation
- −$3,462
- Taxable income
- $2,419
- Est. tax owed @ 24.0%
- −$581
- After-tax cash flow
- $3,675/yr
For passive investors: Depreciation is non-cash, so a rental often shows a tax loss while cash-flowing — sheltering income. Rental losses are passive: they offset passive income freely, and up to $25,000/yr can offset ordinary (W-2) income if you actively participate and your MAGI is under $100k (phasing out to $0 by $150k); unused losses carry forward. On sale, claimed depreciation is recaptured at up to 25%, and gains may owe capital-gains tax (a 1031 exchange can defer both). Figures are a year-1 estimate at your 24.0% rate — not tax advice; consult a CPA.
Schools (NCES district)
- District
- Cullman County
- NCES district ID
- 0101020
- Math proficiency
- 19% ▼ -35.00%
- Reading proficiency
- 49% ▲ 1.00%
- Median HH income
- $39,449
- Composite
- 28.39/100
- National rank
- #6767
- State rank
- #49 of 129 in AL
Livability — Hanceville
- Score
- 61/100
- State rank
- #244
- US rank
- #17639
Category grades
Schools grade is shown separately in the Schools card above.
Census & demographics
- Census place
- Hanceville, AL
- County
- Cullman County · 47,767 people
- City population
- 13,107
- Metro
- Cullman, AL
- Population (ZIP)
- 13,107
- Household income
- $48,276
- Rent vs Own
- Severe rent burden
- 323.0
Population outlook (Cullman County) Hauer SSP2
- Today (2025)
- 84,522 people
- By 2030
- 85,402 · +1.0%
- By 2040
- 86,152 · +1.9%
- By 2050
- 85,202 · +0.8%
- By 2075
- 79,679 · -5.7%
- By 2100
- 66,943 · -20.8%
Race, ethnicity, and origin ACS 2023
- Neighborhood character
- Predominantly White (89%)
- Race & ethnicity
- White 89% Two or more races 5% Black 4% Hispanic / Latino 3%
- Common ancestry
- Serbian 2% Slovak 1% Italian 1%
- Foreign-born
- 2% · Canada
- Languages at home
- 97% English-only · Spanish 2% Other Indo-European 1%
Political lean MEDSL · Cullman
- 2024 margin
- Solid R (+80.5) · D 9.4% · R 89.9%
- 2008→2024 swing
- -15.3pp toward R · 2008: -65.2pp · 2024: -80.5pp
- All cycles
- 2024: R+80.5 2020: R+77.4 2016: R+77.8 2012: R+69.5 2008: R+65.2
Not yet ingested
- Civics
- —
Market trends
- HPI YoY
- ▼ -37.31%
- Current HPI
- 258.7978
- Rent YoY
- —
- Metro
- Cullman, AL
- State GDP YoY
- ▲ 2.94%
- F500 in state
- 4
Industry mix (Fortune 500 HQ in AL)
| Industry | F500 HQs | Revenue |
|---|---|---|
| Financial Services | 1 | $8B |
|
||
| Healthcare | 1 | $5B |
|
||
Price history
+70.2% since first listed3 events — show timeline
- 2026-03-12 Listed $119,000 SAARMLS
- 2015-10-19 Sold (MLS) $70,750 SAARMLS
- 2015-01-19 Listed $69,900 SAARMLS
Property tax history
+6.0%/yrLatest (2025): $352 · -2.7% YoY. Source: county tax records.
Cash-flow waterfall
monthlySold comps — $/sqft
last 12 mo · ≤1 miLoading sold comps…