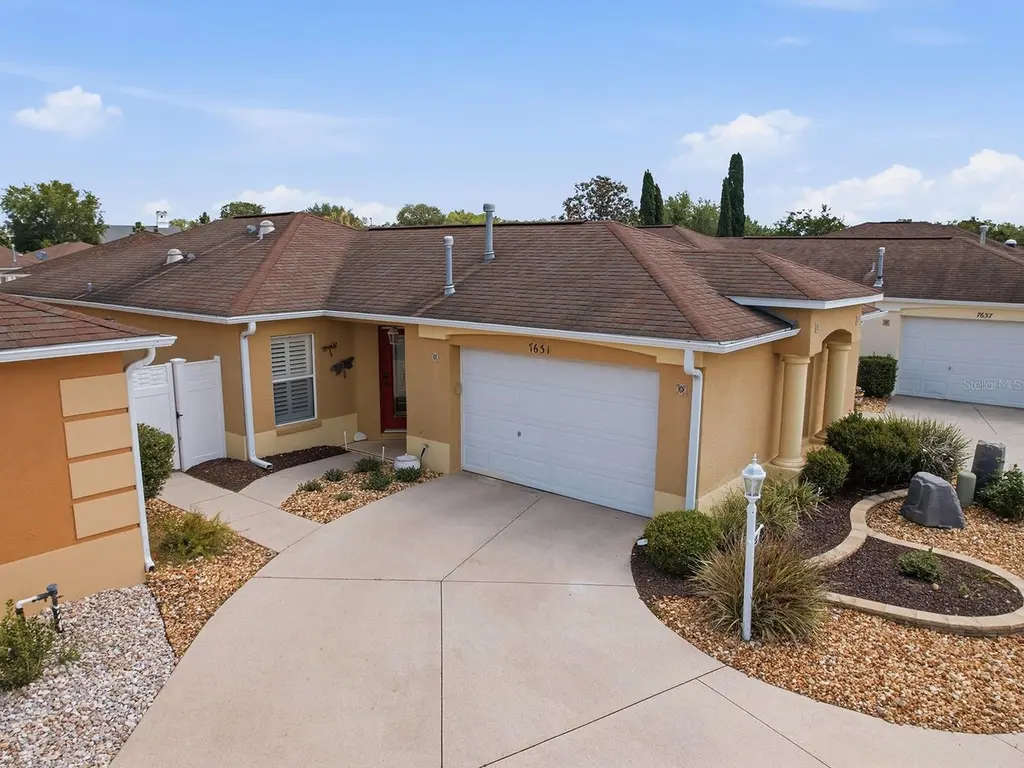
7631 SE 170th Longview Ln · The Villages, FL
Flood risk 1/10 · Minimal
- FEMA flood zone
- X (unshaded)
- Chance of flooding over 30 yrs
- 0.0%
- Est. flood insurance / yr
- $507 – $1,088
Fire risk 4/10 · Minor
- Est. fire insurance / yr
- $947 – $1,759
Heat risk 9/10 · Severe
- Hot days now (above 109°F)
- 7 days/yr
- Hot days in 30 yrs
- 22 days/yr
Wind risk 9/10 · Severe
- Chance of severe wind over 30 yrs
- 99.0%
Air-quality risk 3/10 · Minor
- Unhealthy air days now
- 2 days/yr
- Unhealthy air days in 30 yrs
- 2 days/yr
Risk factors via First Street. Map © Google.
Why this score? — see what drove the D+ grade
The composite is a weighted blend of 9 inputs, each scored 0–100. Each bar is that input's sub-score; the figure is the points it added to the 100-point composite (weight × sub-score).
- Cash flow +14.9/30.0
- ARV discount +10.9/15.0
- DSCR +4.6/10.0
- 1% rule +4.4/10.0
- Schools +3.6/10.0
- Rent growth +3.5/5.0
- Livability +3.5/5.0
- Condition / age +2.5/5.0
- Appreciation +0.0/10.0
$300,000
🖨 Deal sheet 📄 Offer letter ✓ Due diligence
Listing remarks
Beautiful 2 Bedroom 2 Bath Beauregard Courtyard Villa in the Village of Calumet Grove! Enter through the gorgeous Glass Front Door into NO CARPET home. CROWN MOLDING ~ PLANTATION SHUTTERS ~ ENCLOSED LANAI w/ HEAT & AIR. Spacious Primary Suite with Walk-in Tiled Shower, Linen Closet and SOLAR TUBE. Guest suite has private bathroom with tub/shower combination and a SOLAR TUBE. Kitchen has White Cabinets, white appliances for a bright clean feel. Love your NO MAINTENANCE YARD! Garage has Washer and Dryer and INSULATED DOOR! Roof 2011, HVAC 2024, HWH 2024. NO BOND!! Most Furnishings Stay. Great Friendly Villa Community. Close to Nancy Lopez Country Club with a lovely restaurant, pool
Key facts
- No carpet home
- Walk-in tiled shower
- Plantation shutters
Tags
Property features AI
Finance
- Other: Partially furnished; Directions available
- Financial info: Total monthly HOA fees reported; Other annual assessment applies
- HOA & community: Monthly association fee; Community clubhouse; Community mailbox; Deed restrictions; Dog park; Fitness center; Golf carts allowed; Golf; Community pool; Tennis courts; Senior community; Pets allowed (cats and dogs)
Exterior
- Parking: Attached garage (1 car)
- Utilities: Public water; Public sewer; Electricity connected; Natural gas connected; Water connected; Sewer connected
- Home design: Residential villa; One level; Southeast-facing; PUD zoning; Homestead property; CDD present
- Construction: Block and stucco construction; Shingle roof; Slab foundation; Built as Beauregard model
- Exterior features: Asphalt road access; Lot approximately 0.09 acres; Lot size less than 1/4 acre
Interior
- Kitchen: Dishwasher; Disposal; Microwave; Range
- Bedrooms: 2 bedrooms
- Flooring: Ceramic tile; Laminate
- Bathrooms: 2 full bathrooms
- Heating & cooling: Natural gas heating; Central air conditioning
- Interior features: Ceiling fans; Crown molding; Eat-in kitchen; Thermostat
- Laundry & utility: Laundry area in garage; Washer; Dryer; Gas water heater
Neighborhood map
What this means for you Summary
Snapshot
- This is a 2-bed/2.0-bath single-family listed at $300k.
Deal economics
- At list price, monthly cash flow is $87 ($1k/yr) — positive.
- The deal already cash-flows at list — no discount required.
- To meet the 1% rule (rent ≥ 1% of price), the offer needs to be $281k (6.4% below list).
- Recommended offer: $281k (6.4% below list) — sets the bar for 1% rule.
- Cap rate 6.6% vs local median 5.0% in The Villages — top-decile yield for the area; either an underpriced asset or a hidden risk that comps aren't pricing in. Stress-test before assuming the spread holds.
Location & tenants
- Location reads 70/100 on livability (#431 in FL) — a middle-class / working-renter tenant base. Strengths: schools A+, crime A+, housing A; Watch: amenities F, commute F, health & safety F.
- Marion (rural): math 42% / reading 43% proficiency, ranked #61 of 73 in FL (top 84%) — families likely to look elsewhere, expect single-tenant / working-renter base with shorter leases; 61% free/reduced lunch — lower-income household profile, screen leases tightly.
- Market conditions: Rents rising (+3.9%/yr); 550 active listings in the ZIP; 7 comparable units currently listed for rent nearby; rentals at typical pace (median 21d on market — plan ~3-4 weeks tenant-placement turnaround); 7,071 units permitted in Marion County in 2024 (534 in 5+ unit buildings).
- At $2,807/mo this rent would consume 45% of the median local household income ($74k/yr) (locally 987% of renters already pay >50% of income on rent) — very limited rent-growth headroom before tenants either downsize or default.
Forward outlook
- Local home prices are declining (-3.0%/yr); year-one equity from $2k of loan paydown is wiped out by about $9k of value loss. Plan a longer hold.
- Marion County population projected at +13% by 2050 — modest demand growth; plan on rents tracking national, not racing it.
Negotiation context
- It's been on market 41 days — a 3% lower offer ($291k) is reasonable based on typical stale-listing flexibility.
Risks & watch-outs
- Climate carrying-cost: severe wind risk, 99% chance of damaging wind over 30y; extreme-heat days projected 7→22/yr by 2055 (HVAC capex compounding) — expect insurance premiums to compound above CPI over the hold.
Questions for the listing agent
- It's been on market 41 days. Have you received any prior offers? Is the seller open to a 6% concession, seller financing, or rate buy-down credit?
- What does the HOA fee cover, when was the last increase, and are there any pending special assessments or reserve-fund shortfalls?
- Is there a deadline driving the sale (1031 exchange, divorce, estate, relocation)? That informs how much negotiation room exists.
- Schools are A-rated — typically a magnet for longer-tenancy family renters. What's the average tenant stay here, and is there a school-zone premium baked into asking?
- The area grade is low — what's the realistic commute time and amenity access for the typical tenant pool here? Any planned neighborhood developments (good or bad) we should know about?
- What's the average days-on-market for RENTAL listings here right now (not sales)? A rising rental-DOM trend means longer vacancies and softer asking-rent achievability than the comps imply.
- What's the recent tenant-quality profile in this submarket — average credit score on applications, eviction rate, late-payment / NSF rate, and stable-employment percentage? A property-management company in the area should have these aggregated.
- How much new for-sale + rental construction is in the pipeline within 1–3 miles? Heavy new supply typically softens prices + rents 12–24 months out; constrained supply supports both.
Investment metrics
- 1% rule
- 0.94% ✗
- Cap rate
- 6.64%
- Cash-on-cash
- 1.24%
- DSCR
- 1.06
- GRM
- 8.9
CMA / ARV
- ARV (median comp)
- $324,527
- List price
- $300,000
- Delta
- -7.56%
- Verdict
- FAIR
- Comps
- 20 within 1.0 mi
Show comp detail 7 sales within ~0.75 mi
| Address | Dist | Beds/Ba | Sqft | Sold | Price | $/sf | Match |
|---|---|---|---|---|---|---|---|
| 17400 SE 77th Sycamore Ave | 0.36mi | 2/2.0 | 1,198 (+1%) | 8mo | $239,000 | $199 | 75 |
| 17126 SE 78th Larchmont Ct | 0.22mi | 2/2.0 | 1,229 (+4%) | 14mo | $352,000 | $286 | 72 |
| 17385 SE 76th Champion Ave | 0.34mi | 2/2.0 | 1,125 (-5%) | 13mo | $305,000 | $271 | 65 |
| 17395 SE 82nd Pecan Ter | 0.73mi | 2/2.0 | 1,202 (+1%) | 0mo | $229,900 | $191 | 63 |
| 16952 SE 81st Charlesfort Ave | 0.42mi | 2/2.0 | 1,163 (-2%) | 20mo | $245,000 | $211 | 60 |
| 17107 SE 78th Parlange Ter | 0.26mi | 3/2.0 (+1) | 1,359 (+15%) | 6mo | $385,000 | $283 | 54 |
| 17415 SE 82nd Pecan Ter | 0.74mi | 2/1.0 | 1,071 (-10%) | 10mo | $229,900 | $215 | 37 |
Match score weights: distance 35% · size 25% · config 20% · recency 20%. Top-matched comps best support the ARV.
Projected returns pro-forma
-3.0% appreciation · 3.92% rent growth · sell at horizon
- IRR
- -13.2%
- Equity multiple
- 0.52×
- Total profit
- $-40,369
- Equity at exit
- $44,731
- IRR
- -2.8%
- Equity multiple
- 0.80×
- Total profit
- $-16,734
- Equity at exit
- $25,939
Cash invested: $84,000 (down + closing). Projections, not guarantees.
Landlord ↔ Tenant lean methodology
- Overall (STATE)
- 87 Strongly Landlord-Friendly
- State Florida
- 87 Strongly Landlord-Friendly · R+3
- County
- — inherits STATE
- City
- — inherits STATE
ZIP-level market 32162
- Home prices YoY
- -6.9%
- Rents YoY
- 3.9%
- Active inventory
- 550
- Price-to-rent
- 8.9×
Monthly cashflow live
- Estimated rent
- $2,807 high interval (Pro) →
- Mortgage (P&I)
- −$1,573
- Tax from tax record
- −$229 /mo · $2,742/yr
- Insurance
- −$125
- HOA
- −$204
- Vacancy / Maint / Mgmt
- −$590
- Net cashflow
- $87
Break-even live
UW: 25.0% down · 7.5% · 30yr · 1.5% tax · 5.0% vac · 8.0% maint · 8.0% mgmt
Financing live
Cash to close
- Down payment
- $75,000
- Closing costs
- $9,000
- Reserves months
- —
- Total cash needed
- —
Loan-product check · same deal, 3 products live
Conventional
25% down · 7.5% · 30yr
- Down + closing
- —
- Monthly P&I
- —
- Monthly cashflow
- —
- DSCR
- —
- Eligible?
- —
Personal DTI + credit; lowest rate.
DSCR
20% down · 8.5% · 30yr
- Down + closing
- —
- Monthly P&I
- —
- Monthly cashflow
- —
- DSCR
- —
- Eligible?
- —
No personal income docs; deal must DSCR.
Hard money
10% down · 12.0% · 12mo
- Down + closing
- —
- Monthly P&I
- —
- Monthly cashflow
- —
- DSCR
- —
- Eligible?
- —
Short-term bridge; refi at stabilization.
Rent comps 7 comps
| Address | Beds | Baths | Sqft | Rent | $/sqft | DOM | Units | Dist |
|---|---|---|---|---|---|---|---|---|
| 7630 SE 174th Gaillard Pl The Villages, FL | 2.0 | 2.0 | 1265 | $4,500 | $3.56 | 21d | 1 | 0.40mi |
| 17442 SE 79th Lovewood Ave The Villages, FL | 2.0 | 2.0 | 1148 | $4,500 | $3.92 | 21d | 1 | 0.45mi |
| 17400 SE 82nd Roslyn Ct The Villages, FL | 2.0 | 2.0 | 1138 | $4,700 | $4.13 | 21d | 1 | 0.67mi |
| 17324 SE 82nd Pecan Ter The Villages, FL | 2.0 | 2.0 | 1358 | $2,500 | $1.84 | 21d | 1 | 0.68mi |
| 8544 SE 177th Bartram Loop The Villages, FL | 2.0 | 2.0 | 1265 | $1,900 | $1.50 | 21d | 1 | 1.08mi |
| 8352 SE 158th Pl Summerfield, FL | 3.0 | 2.0 | 1232 | $2,000 | $1.62 | 13d | 1 | 1.37mi |
| 8364 SE 158th Pl Summerfield, FL | 3.0 | 2.0 | 1374 | $2,000 | $1.46 | 13d | 1 | 1.38mi |
HOA detail
- Monthly dues
- $204 · $2,448/yr
- Likely covers
- pool
Listing history 16 events
-
2026-06-18days on market $300,000 Active 41 DOM
-
2026-06-17days on market $300,000 Active 40 DOM
-
2026-06-16days on market $300,000 Active 39 DOM
-
2026-06-15days on market $300,000 Active 38 DOM
-
2026-06-14days on market $300,000 Active 36 DOM
-
2026-06-13days on market $300,000 Active 35 DOM
-
2026-06-10days on market $300,000 Active 33 DOM
-
2026-06-09days on market $300,000 Active 32 DOM
-
2026-06-08days on market $300,000 Active 31 DOM
-
2026-06-07days on market $300,000 Active 30 DOM
-
2026-06-03pricedays on market $300,000 Active 26 DOM
-
2026-06-02days on market $315,000 Active 25 DOM
-
2026-06-01days on market $315,000 Active 24 DOM
-
2026-05-31days on market $315,000 Active 23 DOM
-
2026-05-30days on market $315,000 Active 22 DOM
-
2026-05-08$315,000 Active 914-char remark
ⓘ Source: listings_history table (triggers on properties + properties_extension) + one-shot
backfill from property_details.listing_events for pre-trigger history.
Tax reassessment forecast FL · Resets to sale price
- Current annual tax
- $2,742 · $229/mo
- Projected year-2 tax
- $2,742 · $229/mo
- Expected delta
- $0/yr ($0/mo · -0.0%)
ⓘ Screening estimate from a state-policy table — verify with the county assessor before closing.
Climate risk First Street
- Flood 1/10 Low FEMA zone X (unshaded) · 0% chance over 30 yrs
- Wildfire 4/10 Moderate
- Heat 9/10 Extreme 7 d/yr ≥109°F today · 22 d/yr by 30 yrs out
- Wind 9/10 Extreme 99% chance of damaging wind over 30 yrs
- Air quality 3/10 Moderate 2 unhealthy d/yr today · 2 by 30 yrs out
Nearby sold comps map
Loading sold comps map…
Walkable amenities ~0.75 mi
Loading nearby amenities…
Taxation est. · year 1
- Rental income
- $33,688
- − Mortgage interest
- −$16,805
- − Property taxes
- −$2,742
- − Insurance
- −$1,500
- − Repairs & maintenance
- −$2,695
- − Management
- −$2,695
- − HOA
- −$2,448
- − Depreciation
- −$8,727
- Taxable loss
- −$3,924
- Est. tax savings @ 24.0%
- +$942
- After-tax cash flow
- $1,986/yr
For passive investors: Depreciation is non-cash, so a rental often shows a tax loss while cash-flowing — sheltering income. Rental losses are passive: they offset passive income freely, and up to $25,000/yr can offset ordinary (W-2) income if you actively participate and your MAGI is under $100k (phasing out to $0 by $150k); unused losses carry forward. On sale, claimed depreciation is recaptured at up to 25%, and gains may owe capital-gains tax (a 1031 exchange can defer both). Figures are a year-1 estimate at your 24.0% rate — not tax advice; consult a CPA.
Schools (NCES district)
- District
- Marion
- NCES district ID
- 1201260
- Math proficiency
- 42% ▼ -7.00%
- Reading proficiency
- 43% ▼ -4.00%
- Median HH income
- $40,015
- Composite
- 35.61/100
- National rank
- #4890
- State rank
- #61 of 73 in FL
Livability — The Villages
- Score
- 70/100
- State rank
- #431
- US rank
- #7363
Category grades
Schools grade is shown separately in the Schools card above.
Census & demographics
- Census place
- The Villages, FL
- County
- Sumter County · 110,591 people
- City population
- 83,973
- Metro
- The Villages, FL
- Population (ZIP)
- 55,424
- Household income
- $74,119
- Rent vs Own
- Severe rent burden
- 987.0
Population outlook (Marion County) Hauer SSP2
- Today (2025)
- 365,905 people
- By 2030
- 376,768 · +3.0%
- By 2040
- 396,555 · +8.4%
- By 2050
- 412,723 · +12.8%
- By 2075
- 446,090 · +21.9%
- By 2100
- 436,193 · +19.2%
Race, ethnicity, and origin ACS 2023
- Neighborhood character
- Predominantly White (95%)
- Race & ethnicity
- White 95% Two or more races 2% Hispanic / Latino 2% Asian 1% Black 1%
- Common ancestry
- Romanian 7% Slovak 4% Lithuanian 4%
- Foreign-born
- 5% · Canada
- Languages at home
- 96% English-only · Spanish 1% Tagalog/Filipino 1%
Political lean MEDSL · Marion
- 2024 margin
- Solid R (+31.6) · D 33.8% · R 65.5%
- 2008→2024 swing
- -20.0pp toward R · 2008: -11.6pp · 2024: -31.6pp
- All cycles
- 2024: R+31.6 2020: R+25.9 2016: R+26.2 2012: R+16.2 2008: R+11.6
Not yet ingested
- Civics
- —
Market trends
- HPI YoY
- ▼ -16.16%
- Current HPI
- 218.1956
- Rent YoY
- ▲ 3.92%
- Metro
- The Villages, FL
- State GDP YoY
- ▲ 3.28%
- F500 in state
- 36
Industry mix (Fortune 500 HQ in FL)
| Industry | F500 HQs | Revenue |
|---|---|---|
| Industrial Technology | 2 | $29B |
|
||
| Insurance | 2 | $17B |
|
||
| Retail | 1 | $60B |
|
||
| Technology Distribution | 1 | $58B |
|
||
| Homebuilding | 1 | $35B |
|
||
| Technology Manufacturing | 1 | $35B |
|
||
Price history
-4.8% since first listed2 events — show timeline
- 2026-06-03 Price Changed $300,000 Stellar MLS as Distributed by MLS Grid
- 2026-05-08 Listed $315,000 Stellar MLS as Distributed by MLS Grid
Property tax history
+3.6%/yrLatest (2025): $2,742 · +10.5% YoY. Source: county tax records.
Cash-flow waterfall
monthlySold comps — $/sqft
last 12 mo · ≤1 miLoading sold comps…