 🏷️ Likely Rental
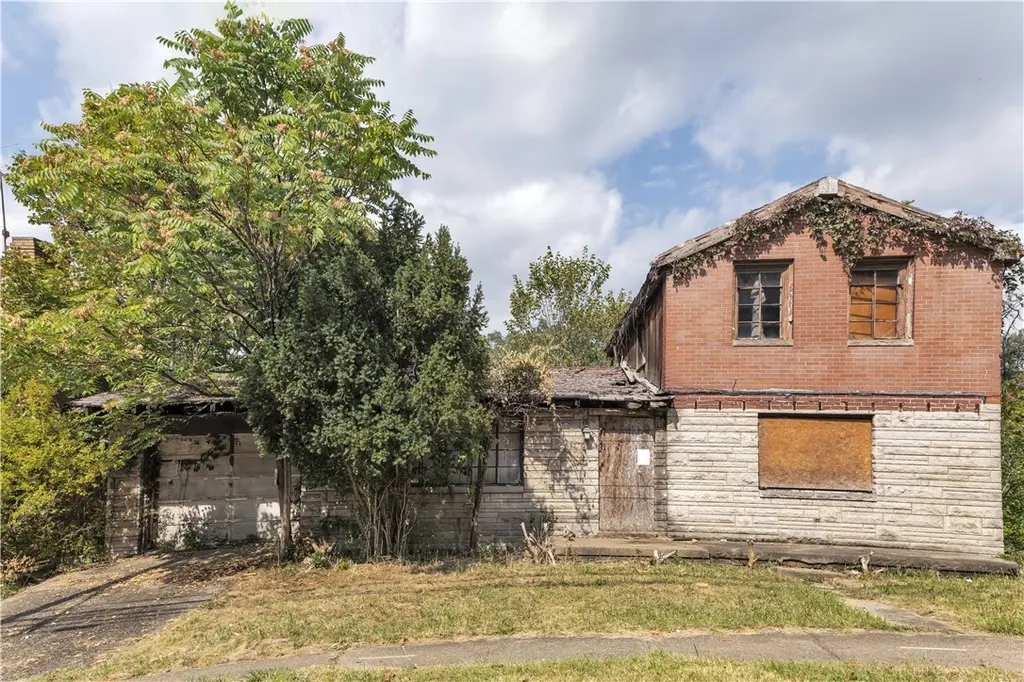
2241 Laketon Rd · Wilkinsburg, PA
Flood risk 1/10 · Minimal
- FEMA flood zone
- X (unshaded)
- Chance of flooding over 30 yrs
- 0.0%
- Est. flood insurance / yr
- $473 – $860
Fire risk 1/10 · Minimal
- Est. fire insurance / yr
- $511 – $949
Heat risk 3/10 · Minor
- Hot days now (above 96°F)
- 7 days/yr
- Hot days in 30 yrs
- 17 days/yr
Wind risk 2/10 · Minimal
- Chance of severe wind over 30 yrs
- —
Air-quality risk 4/10 · Minor
- Unhealthy air days now
- 5 days/yr
- Unhealthy air days in 30 yrs
- 7 days/yr
Risk factors via First Street. Map © Google.
Why this score? — see what drove the D grade
The composite is a weighted blend of 9 inputs, each scored 0–100. Each bar is that input's sub-score; the figure is the points it added to the 100-point composite (weight × sub-score).
- Cash flow +15.0/30.0
- ARV discount +7.5/15.0
- 1% rule +5.0/10.0
- DSCR +5.0/10.0
- Livability +3.8/5.0
- Rent growth +3.5/5.0
- Condition / age +2.5/5.0
- Schools +1.5/10.0
- Appreciation +0.0/10.0
$10,000
🖨 Deal sheet 📄 Offer letter ✓ Due diligence
Listing remarks MLS
This brick house sits on a generous third of an acre lot, offering plenty of outdoor space and potential for future use. From what is understood, the home includes three bedrooms, one and a half baths @ over 2000 sqft and a connected garage. Please note: the property may have structural concerns, particularly near the garage and front entry. Out of an abundance of caution, access to the home is restricted — do not enter or trespass on the property prior to ownership. With its size, brick construction, and lot dimensions, this property provides an opportunity for vision and investment in a neighborhood where revitalization efforts continue to take shape.
Key facts
- Third of an acre lot
- Outdoor space
- Brick construction
Tags
Neighborhood map
What this means for you Summary
Snapshot
- This is a 3-bed/1.5-bath single-family listed at $10k.
Deal economics
- At list price, monthly cash flow is $1k ($16k/yr) — positive.
- The deal already cash-flows at list — no discount required.
- Meets the 1% rule at list price ($2k rent vs $10k).
- Recommended offer: $9k (12.0% below list) — sets the bar for market timing.
- Cap rate 161.3% vs local median 11.3% in Wilkinsburg — top-decile yield for the area; either an underpriced asset or a hidden risk that comps aren't pricing in. Stress-test before assuming the spread holds.
Location & tenants
- Location reads 76/100 on livability (#411 in PA, #3,754 nationally) — a middle-class / working-renter tenant base. Strengths: commute A+, cost of living A+, housing A+; Watch: schools D+, health & safety D+, crime F.
- Wilkinsburg Borough SD (suburban): math 14% / reading 23% proficiency, ranked #503 of 539 in PA (top 93%) — low school quality limits family demand, transient renter base, plan for 1-2y turnover; 96% free/reduced lunch — lower-income household profile, screen leases tightly.
- Market conditions: Rents rising (+3.9%/yr); 118 active listings in the ZIP; 9 comparable units currently listed for rent nearby; rentals at typical pace (median 14d on market — plan ~3-4 weeks tenant-placement turnaround); 2,996 units permitted in Allegheny County in 2024 (1,588 in 5+ unit buildings).
- This rent runs 38% of the median local income ($55k/yr) — at the standard rent-burdened threshold; future hikes will face affordability resistance.
Forward outlook
- Local home prices are declining (-3.0%/yr); year-one equity from $69 of loan paydown is wiped out by about $300 of value loss. Plan a longer hold.
- At projected returns (-3.0% appreciation + 3.9% rent growth), your $3k cash investment doubles in ~1 year — after that, you're playing with house money.
Negotiation context
- It's been on market 267 days — a 12% lower offer ($9k) is reasonable based on typical stale-listing flexibility.
Risks & watch-outs
- Watch-outs: built in 1949 — expect roof / HVAC / electrical / plumbing capex.
Questions for the listing agent
- It's been on market 267 days. Have you received any prior offers? Is the seller open to a 12% concession, seller financing, or rate buy-down credit?
- Built in 1949 — when were the roof, HVAC, electrical panel, plumbing, and water heater last replaced?
- Why hasn't it sold? Are there any deal-killer items the seller is aware of (foundation, flood, title, zoning, code violations)?
- Is there a deadline driving the sale (1031 exchange, divorce, estate, relocation)? That informs how much negotiation room exists.
- Schools are D-rated, which usually means shorter tenancies and higher turnover. Who's the typical renter profile here, and what's been the actual vacancy rate?
- Crime grade is F in this area — have there been break-ins, vandalism, or insurance claims at this property in the last 3 years? What carrier currently insures it and at what premium?
- The area grade is low — what's the realistic commute time and amenity access for the typical tenant pool here? Any planned neighborhood developments (good or bad) we should know about?
- What's the average days-on-market for RENTAL listings here right now (not sales)? A rising rental-DOM trend means longer vacancies and softer asking-rent achievability than the comps imply.
- What's the recent tenant-quality profile in this submarket — average credit score on applications, eviction rate, late-payment / NSF rate, and stable-employment percentage? A property-management company in the area should have these aggregated.
- How much new for-sale + rental construction is in the pipeline within 1–3 miles? Heavy new supply typically softens prices + rents 12–24 months out; constrained supply supports both.
Investment metrics
- 1% rule
- 17.23% ✓
- Cap rate
- 161.30%
- Cash-on-cash
- 553.60%
- DSCR
- 25.63
- GRM
- 0.5
CMA / ARV
- ARV (median comp)
- $202,035
- List price
- $10,000
- Delta
- -95.05%
- Verdict
- UNDERPRICED
- Comps
- 20 within 1.0 mi
Show comp detail 12 sales within ~0.75 mi
| Address | Dist | Beds/Ba | Sqft | Sold | Price | $/sf | Match |
|---|---|---|---|---|---|---|---|
| 125 Woodgate Rd | 0.39mi | 3/2.0 | 1,978 (-5%) | 2mo | $172,000 | $87 | 70 |
| 1067 Blackridge Dr | 0.37mi | 4/2.5 (+1) | 2,148 (+3%) | 0mo | $410,000 | $191 | 69 |
| 1541 Graham Blvd | 0.19mi | 3/2.5 | 1,873 (-10%) | 3mo | $280,000 | $149 | 68 |
| 1870 Graham Blvd | 0.23mi | 4/2.0 (+1) | 1,969 (-6%) | 9mo | $128,500 | $65 | 66 |
| 1730 Graham Blvd | 0.16mi | 2/2.0 (-1) | 1,850 (-11%) | 2mo | $120,000 | $65 | 66 |
| 2340 Mcnary Blvd | 0.35mi | 4/3.0 (+1) | 1,997 (-4%) | 0mo | $316,500 | $158 | 65 |
| 2509 Holly Dr | 0.36mi | 4/2.0 (+1) | 2,256 (+8%) | 1mo | $220,000 | $98 | 62 |
| 9600 Frankstown Rd | 0.59mi | 4/2.5 (+1) | 2,096 (+0%) | 6mo | $176,000 | $84 | 57 |
| 2415 Collins Rd | 0.47mi | 4/2.5 (+1) | 1,926 (-8%) | 1mo | $310,000 | $161 | 56 |
| 1817 Montier St | 0.60mi | 4/2.0 (+1) | 2,156 (+3%) | 6mo | $30,000 | $14 | 55 |
| 1050 Old Gate Rd | 0.43mi | 3/3.0 | 2,240 (+7%) | 10mo | $230,000 | $103 | 53 |
| 2511 Collins Rd | 0.54mi | 3/2.0 | 1,796 (-14%) | 7mo | $213,000 | $119 | 43 |
Match score weights: distance 35% · size 25% · config 20% · recency 20%. Top-matched comps best support the ARV.
Projected returns pro-forma
-3.0% appreciation · 3.86% rent growth · sell at horizon
- IRR
- —
- Equity multiple
- 30.35×
- Total profit
- $82,179
- Equity at exit
- $1,491
- IRR
- —
- Equity multiple
- 66.67×
- Total profit
- $183,880
- Equity at exit
- $865
Cash invested: $2,800 (down + closing). Projections, not guarantees.
Landlord ↔ Tenant lean methodology
- Overall (STATE)
- 62 Landlord-Friendly
- State Pennsylvania
- 62 Landlord-Friendly · EVEN
- County
- — inherits STATE
- City
- — inherits STATE
ZIP-level market 15221
- Home prices YoY
- -32.3%
- Rents YoY
- 3.9%
- Active inventory
- 118
- Price-to-rent
- 0.5×
Monthly cashflow live
- Estimated rent
- $1,723 high interval (Pro) →
- Mortgage (P&I)
- −$52
- Tax est. 1.5%
- −$12 /mo · $150/yr
- Insurance
- −$4
- HOA
- −$0
- Vacancy / Maint / Mgmt
- −$362
- Net cashflow
- $1,292
Break-even live
UW: 25.0% down · 7.5% · 30yr · 1.5% tax · 5.0% vac · 8.0% maint · 8.0% mgmt
Financing live
Cash to close
- Down payment
- $2,500
- Closing costs
- $300
- Reserves months
- —
- Total cash needed
- —
Loan-product check · same deal, 3 products live
Conventional
25% down · 7.5% · 30yr
- Down + closing
- —
- Monthly P&I
- —
- Monthly cashflow
- —
- DSCR
- —
- Eligible?
- —
Personal DTI + credit; lowest rate.
DSCR
20% down · 8.5% · 30yr
- Down + closing
- —
- Monthly P&I
- —
- Monthly cashflow
- —
- DSCR
- —
- Eligible?
- —
No personal income docs; deal must DSCR.
Hard money
10% down · 12.0% · 12mo
- Down + closing
- —
- Monthly P&I
- —
- Monthly cashflow
- —
- DSCR
- —
- Eligible?
- —
Short-term bridge; refi at stabilization.
Rent comps 9 comps
| Address | Beds | Baths | Sqft | Rent | $/sqft | DOM | Units | Dist |
|---|---|---|---|---|---|---|---|---|
| 1962 McNary Blvd Pittsburgh, PA | 3.0 | 1.0 | 1517 | $1,545 | $1.02 | 7d | 1 | 0.42mi |
| 8918 Frankstown Rd Pittsburgh, PA | 3.0 | 1.0 | 1400 | $1,907 | $1.36 | 14d | 1 | 0.71mi |
| 8606 Westwood Rd Pittsburgh, PA | 4.0 | 1.0 | 1596 | $1,425 | $0.89 | 43d | 1 | 0.91mi |
| 1148 East St Pittsburgh, PA | 3.0 | 3.0 | 1738 | $1,700 | $0.98 | 43d | 1 | 1.07mi |
| 103 Grove Rd Verona, PA | 3.0 | 1.5 | 1460 | $1,450 | $0.99 | 12d | 1 | 1.10mi |
| 2525 Greensburg Pike #305 Pittsburgh, PA | 2.0 | 3.0 | 2964 | $2,975 | $1.00 | 1d | 1 | 1.12mi |
| 1030 Ross Ave Pittsburgh, PA | 4.0 | 3.5 | 2856 | $2,200 | $0.77 | 1d | 1 | 1.30mi |
| 1250 Blackadore Ave Pittsburgh, PA | 3.0 | 1.0 | 1440 | $1,750 | $1.22 | 23d | 1 | 1.34mi |
| 515 Hill Ave Pittsburgh, PA | 4.0 | 1.0 | 1628 | $1,300 | $0.80 | 43d | 1 | 1.39mi |
Listing history 16 events
-
2026-06-18days on market $10,000 Active 267 DOM
-
2026-06-17days on market $10,000 Active 266 DOM
-
2026-06-16days on market $10,000 Active 265 DOM
-
2026-06-15days on market $10,000 Active 264 DOM
-
2026-06-13days on market $10,000 Active 262 DOM
-
2026-06-09days on market $10,000 Active 258 DOM
-
2026-06-08days on market $10,000 Active 257 DOM
-
2026-06-07days on market $10,000 Active 256 DOM
-
2026-06-05days on market $10,000 Active 253 DOM
-
2026-06-03days on market $10,000 Active 252 DOM
-
2026-06-02days on market $10,000 Active 251 DOM
-
2026-06-01days on market $10,000 Active 250 DOM
-
2026-05-31days on market $10,000 Active 249 DOM
-
2026-01-13price $10,000 667-char remark
Show marketing remark (667 chars)
This brick house sits on a generous third of an acre lot, offering plenty of outdoor space and potential for future use. From what is understood, the home includes three bedrooms, one and a half baths @ over 2000 sqft and a connected garage. Please note: the property may have structural concerns, particularly near the garage and front entry. Out of an abundance of caution, access to the home is restricted — do not enter or trespass on the property prior to ownership. With its size, brick construction, and lot dimensions, this property provides an opportunity for vision and investment in a neighborhood where revitalization efforts continue to take shape.
-
2025-09-24$20,000 Active 667-char remark
Show marketing remark (667 chars)
This brick house sits on a generous third of an acre lot, offering plenty of outdoor space and potential for future use. From what is understood, the home includes three bedrooms, one and a half baths @ over 2000 sqft and a connected garage. Please note: the property may have structural concerns, particularly near the garage and front entry. Out of an abundance of caution, access to the home is restricted — do not enter or trespass on the property prior to ownership. With its size, brick construction, and lot dimensions, this property provides an opportunity for vision and investment in a neighborhood where revitalization efforts continue to take shape.
-
1975-04-17soldstatus $28,250
ⓘ Source: listings_history table (triggers on properties + properties_extension) + one-shot
backfill from property_details.listing_events for pre-trigger history.
Climate risk First Street
- Flood 1/10 Low FEMA zone X (unshaded) · 0% chance over 30 yrs
- Wildfire 1/10 Low
- Heat 3/10 Moderate 7 d/yr ≥96°F today · 17 d/yr by 30 yrs out
- Wind 2/10 Low
- Air quality 4/10 Moderate 5 unhealthy d/yr today · 7 by 30 yrs out
Nearby sold comps map
Loading sold comps map…
Walkable amenities ~0.75 mi
Loading nearby amenities…
Taxation est. · year 1
- Rental income
- $20,671
- − Mortgage interest
- −$560
- − Property taxes
- −$150
- − Insurance
- −$50
- − Repairs & maintenance
- −$1,654
- − Management
- −$1,654
- − Depreciation
- −$291
- Taxable income
- $16,312
- Est. tax owed @ 24.0%
- −$3,915
- After-tax cash flow
- $11,586/yr
For passive investors: Depreciation is non-cash, so a rental often shows a tax loss while cash-flowing — sheltering income. Rental losses are passive: they offset passive income freely, and up to $25,000/yr can offset ordinary (W-2) income if you actively participate and your MAGI is under $100k (phasing out to $0 by $150k); unused losses carry forward. On sale, claimed depreciation is recaptured at up to 25%, and gains may owe capital-gains tax (a 1031 exchange can defer both). Figures are a year-1 estimate at your 24.0% rate — not tax advice; consult a CPA.
Schools (NCES district)
- District
- Wilkinsburg Borough SD
- NCES district ID
- 4226370
- Math proficiency
- 14% ▼ -8.00%
- Reading proficiency
- 23% ▼ -9.00%
- Median HH income
- $32,204
- Composite
- 14.94/100
- National rank
- #9368
- State rank
- #503 of 539 in PA
Livability — Wilkinsburg
- Score
- 76/100
- State rank
- #411
- US rank
- #3754
Category grades
Schools grade is shown separately in the Schools card above.
Census & demographics
- Census place
- Wilkinsburg, PA
- County
- Allegheny County · 1,022,028 people
- City population
- 29,513
- Metro
- Pittsburgh, PA
- Population (ZIP)
- 29,374
- Household income
- $55,028
- Rent vs Own
- Severe rent burden
- 1933.0
Population outlook (Allegheny County) Hauer SSP2
- Today (2025)
- 1,250,282 people
- By 2030
- 1,256,482 · +0.5%
- By 2040
- 1,256,318 · +0.5%
- By 2050
- 1,244,169 · -0.5%
- By 2075
- 1,197,693 · -4.2%
- By 2100
- 1,093,187 · -12.6%
Race, ethnicity, and origin ACS 2023
- Neighborhood character
- Diverse neighborhood (Simpson 0.60)
- Race & ethnicity
- White 47% Black 43% Two or more races 7% Hispanic / Latino 4% Asian 1%
- Common ancestry
- Romanian 4% Lithuanian 2% Serbian 1%
- Foreign-born
- 4% · Canada, South Korea, China
- Languages at home
- 93% English-only · Spanish 2% French/Haitian/Cajun 1% Other Indo-European 1%
Political lean MEDSL · Allegheny
- 2024 margin
- Strong D (+20.3) · D 59.7% · R 39.4%
- 2008→2024 swing
- +4.8pp toward D · 2008: 15.5pp · 2024: 20.3pp
- All cycles
- 2024: D+20.3 2020: D+20.4 2016: D+16.4 2012: D+14.4 2008: D+15.5
Not yet ingested
- Civics
- —
Market trends
- HPI YoY
- ▼ -109.77%
- Current HPI
- 230.0486
- Rent YoY
- ▲ 3.86%
- Metro
- Pittsburgh, PA
- State GDP YoY
- ▲ 1.68%
- F500 in state
- 34
Industry mix (Fortune 500 HQ in PA)
| Industry | F500 HQs | Revenue |
|---|---|---|
| Healthcare | 2 | $309B |
|
||
| Insurance | 2 | $27B |
|
||
| Telecommunications / Media | 1 | $124B |
|
||
| Industrial Distribution | 1 | $22B |
|
||
| Financial Services | 1 | $20B |
|
||
| Chemicals / Materials | 1 | $18B |
|
||
Price history
-64.6% since first listed3 events — show timeline
- 2026-01-13 Price Changed $10,000 West Penn MLS
- 2025-09-24 Listed $20,000 West Penn MLS
- 1975-04-17 Sold (Public Records) $28,250 Public Records
Property tax history
-0.6%/yrLatest (2026): $3,052 · +3.0% YoY. Source: county tax records.
Cash-flow waterfall
monthlySold comps — $/sqft
last 12 mo · ≤1 miLoading sold comps…