1624 Hazel St · Baltimore, MD
Flood risk 1/10 · Minimal
- FEMA flood zone
- X (unshaded)
- Chance of flooding over 30 yrs
- 0.0%
- Est. flood insurance / yr
- $473 – $860
Fire risk 1/10 · Minimal
- Est. fire insurance / yr
- $755 – $1,403
Heat risk 8/10 · Major
- Hot days now (above 103°F)
- 7 days/yr
- Hot days in 30 yrs
- 15 days/yr
Wind risk 6/10 · Moderate
- Chance of severe wind over 30 yrs
- 27.0%
Air-quality risk 4/10 · Minor
- Unhealthy air days now
- 5 days/yr
- Unhealthy air days in 30 yrs
- 7 days/yr
Risk factors via First Street. Map © Google.
Why this score? — see what drove the B- grade
The composite is a weighted blend of 9 inputs, each scored 0–100. Each bar is that input's sub-score; the figure is the points it added to the 100-point composite (weight × sub-score).
- Cash flow +24.7/30.0
- ARV discount +8.9/15.0
- Appreciation +8.9/10.0
- DSCR +8.0/10.0
- 1% rule +5.1/10.0
- Livability +3.8/5.0
- Rent growth +2.5/5.0
- Condition / age +2.5/5.0
- Schools +1.0/10.0
$160,000
🖨 Deal sheet 📄 Offer letter ✓ Due diligence
Listing remarks MLS
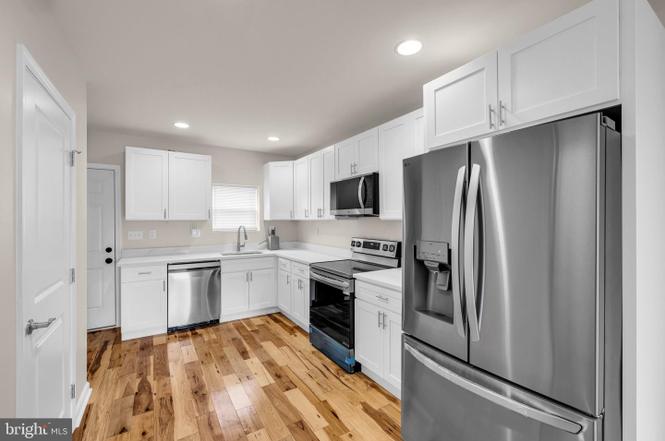
GREAT HOUSE FOR IVESTORS IN CURTIS BAY. NEW CENTRAL A/C NEW BATH SURROUND FROM BATH FITTERS. GROUND RENT CAP TO BE VERIFIED. MAKE AN OFFER. HOME WILL BE 1031 EXCHANGE. 24 HOUR NOTICE FOR ALL SHOWINGS!!
Key facts
- Unfinished basement
- Brick construction
- Local parks
Tags
Property features AI
Exterior
- Utilities: Public water; Public sewer; Electric hot water
- Home design: Interior townhouse/rowhouse
- Construction: Brick construction; Brick/mortar foundation; Above-grade and below-grade structures
- Exterior features: No tidal water
Interior
- Bedrooms: 2 bedrooms on the first upper level
- Bathrooms: 1 full bathroom on the first upper level; 1 half bathroom on the main level
- Heating & cooling: 90% efficient forced air heating; Natural gas heating; Central air conditioning
- Interior features: Unfinished basement; Finished above-grade living area (per assessor)
Neighborhood map
What this means for you Summary
Snapshot
- This is a 2-bed/1.0-bath townhouse listed at $160k.
Deal economics
- At list price, monthly cash flow is $335 ($4k/yr) — positive.
- The deal already cash-flows at list — no discount required.
- Meets the 1% rule at list price ($2k rent vs $160k).
- Cap rate 8.8% vs local median 6.0% in Baltimore — top-decile yield for the area; either an underpriced asset or a hidden risk that comps aren't pricing in. Stress-test before assuming the spread holds.
Location & tenants
- Location reads 76/100 on livability (#90 in MD, #3,396 nationally) — a middle-class / working-renter tenant base. Strengths: amenities A+, commute A+, housing A+; Watch: schools D, crime F.
- Baltimore City Public Schools (urban): math 7% / reading 16% proficiency, ranked #24 of 24 in MD (top 100%) — low school quality limits family demand, transient renter base, plan for 1-2y turnover; 79% free/reduced lunch — lower-income household profile, screen leases tightly.
- Market conditions: 45 active listings in the ZIP; 24 comparable units currently listed for rent nearby; rentals at typical pace (median 24d on market — plan ~3-4 weeks tenant-placement turnaround); 1,273 units permitted in Baltimore city in 2024 (1,104 in 5+ unit buildings).
Forward outlook
- In year one you build about $14k of equity ($1k loan paydown + $12k appreciation (7.8% local appreciation)).
- Baltimore County population projected to shrink 4% by 2050 — rents likely to lag national; underwrite the cash flow, not the appreciation.
- At projected returns (7.8% appreciation + 3.0% rent growth), your $45k cash investment doubles in ~3 years — after that, you're playing with house money.
- By year 3, paydown + projected appreciation supports a ~$34k cash-out refi (75% LTV) — recoverable capital for the next deal without selling this one.
Negotiation context
- Only 8 days on market — expect competitive offers; lowballing is unlikely to land.
- Current owner paid $85k; list at $160k implies a 88% gain — meaningful room to come down on a strong offer.
Risks & watch-outs
- Watch-outs: built in 1920 — expect roof / HVAC / electrical / plumbing capex.
- Climate carrying-cost: major wind risk, 27% chance of damaging wind over 30y; extreme-heat days projected 7→15/yr by 2055 (HVAC capex compounding) — expect insurance premiums to compound above CPI over the hold.
Questions for the listing agent
- Built in 1920 — when were the roof, HVAC, electrical panel, plumbing, and water heater last replaced?
- Is there a deadline driving the sale (1031 exchange, divorce, estate, relocation)? That informs how much negotiation room exists.
- Schools are D-rated, which usually means shorter tenancies and higher turnover. Who's the typical renter profile here, and what's been the actual vacancy rate?
- Crime grade is F in this area — have there been break-ins, vandalism, or insurance claims at this property in the last 3 years? What carrier currently insures it and at what premium?
- What's the average days-on-market for RENTAL listings here right now (not sales)? A rising rental-DOM trend means longer vacancies and softer asking-rent achievability than the comps imply.
- What's the recent tenant-quality profile in this submarket — average credit score on applications, eviction rate, late-payment / NSF rate, and stable-employment percentage? A property-management company in the area should have these aggregated.
- How much new for-sale + rental construction is in the pipeline within 1–3 miles? Heavy new supply typically softens prices + rents 12–24 months out; constrained supply supports both.
Investment metrics
- 1% rule
- 1.01% ✓
- Cap rate
- 8.81%
- Cash-on-cash
- 8.98%
- DSCR
- 1.40
- GRM
- 8.3
CMA / ARV
- ARV (on-the-fly)
- $165,200
- Comps found
- 12
Show comp detail 12 sales within ~0.75 mi
| Address | Dist | Beds/Ba | Sqft | Sold | Price | $/sf | Match |
|---|---|---|---|---|---|---|---|
| 4613 Pennington Ave | 0.14mi | 2/1.0 | 1,344 (-4%) | 2mo | $52,000 | $39 | 85 |
| 1404 Filbert St | 0.19mi | 3/2.0 (+1) | 1,400 (0%) | 14mo | $80,000 | $57 | 70 |
| 1631 Church St | 0.24mi | 2/1.0 | 1,560 (+11%) | 0mo | $30,000 | $19 | 70 |
| 1630 Hazel St | 0.01mi | 3/2.5 (+1) | 1,288 (-8%) | 15mo | $160,000 | $124 | 63 |
| 1408 Locust | 0.18mi | 2/1.5 | 1,240 (-11%) | 10mo | $110,000 | $89 | 62 |
| 4202 Grace Ct | 0.09mi | 3/2.0 (+1) | 1,248 (-11%) | 8mo | $45,000 | $36 | 62 |
| 1326 Cypress St | 0.29mi | 3/1.5 (+1) | 1,254 (-10%) | 1mo | $226,000 | $180 | 61 |
| 1326 Tompkins St | 0.26mi | 3/2.0 (+1) | 1,554 (+11%) | 3mo | $205,000 | $132 | 58 |
| 1615 Church St | 0.23mi | 3/2.0 (+1) | 1,302 (-7%) | 15mo | $150,000 | $115 | 56 |
| 1102 Inner Cir | 0.46mi | 3/1.5 (+1) | 1,599 (+14%) | 8mo | $205,000 | $128 | 41 |
| 3824 W Bay Ave W | 0.54mi | 3/2.0 (+1) | 1,240 (-11%) | 7mo | $169,900 | $137 | 41 |
| 3613 Saint Victor St | 0.71mi | 3/2.0 (+1) | 1,310 (-6%) | 11mo | $155,000 | $118 | 38 |
Match score weights: distance 35% · size 25% · config 20% · recency 20%. Top-matched comps best support the ARV.
Projected returns pro-forma
7.75% appreciation · 3.0% rent growth · sell at horizon
- IRR
- 26.4%
- Equity multiple
- 2.89×
- Total profit
- $84,633
- Equity at exit
- $118,843
- IRR
- 23.9%
- Equity multiple
- 6.12×
- Total profit
- $229,473
- Equity at exit
- $233,361
Cash invested: $44,800 (down + closing). Projections, not guarantees.
Landlord ↔ Tenant lean methodology
- Overall (CITY)
- 12 Strongly Tenant-Friendly
- State Maryland
- 27 Tenant-Leaning · D+14
- County
- — inherits STATE
- City Baltimore
- 12 Strongly Tenant-Friendly · D+58
ZIP-level market 21226
- Home prices YoY
- 2.5%
- Active inventory
- 45
- Price-to-rent
- 8.3×
Monthly cashflow live
- Estimated rent
- $1,610 high interval (Pro) →
- Mortgage (P&I)
- −$839
- Tax from tax record
- −$31 /mo · $368/yr
- Insurance
- −$67
- HOA
- −$0
- Vacancy / Maint / Mgmt
- −$338
- Net cashflow
- $335
Break-even live
UW: 25.0% down · 7.5% · 30yr · 1.5% tax · 5.0% vac · 8.0% maint · 8.0% mgmt
Financing live
Cash to close
- Down payment
- $40,000
- Closing costs
- $4,800
- Reserves months
- —
- Total cash needed
- —
Loan-product check · same deal, 3 products live
Conventional
25% down · 7.5% · 30yr
- Down + closing
- —
- Monthly P&I
- —
- Monthly cashflow
- —
- DSCR
- —
- Eligible?
- —
Personal DTI + credit; lowest rate.
DSCR
20% down · 8.5% · 30yr
- Down + closing
- —
- Monthly P&I
- —
- Monthly cashflow
- —
- DSCR
- —
- Eligible?
- —
No personal income docs; deal must DSCR.
Hard money
10% down · 12.0% · 12mo
- Down + closing
- —
- Monthly P&I
- —
- Monthly cashflow
- —
- DSCR
- —
- Eligible?
- —
Short-term bridge; refi at stabilization.
Rent comps 24 comps
| Address | Beds | Baths | Sqft | Rent | $/sqft | DOM | Units | Dist |
|---|---|---|---|---|---|---|---|---|
| 1411 Filbert St Unit 2 Baltimore, MD | 2.0 | 1.0 | 1428 | $1,300 | $0.91 | 44d | 1 | 0.18mi |
| 1517 Sycamore St Curtis Bay, MD | 3.0 | 1.5 | 1210 | $1,999 | $1.65 | 24d | 1 | 0.32mi |
| 1353 Cambria St Brooklyn, MD | 3.0 | 2.0 | 986 | $1,600 | $1.62 | 18d | 1 | 0.45mi |
| 1305 E Patapsco Ave Brooklyn, MD | 3.0 | 1.5 | 930 | $1,650 | $1.77 | 4d | 1 | 0.52mi |
| 3816 W Bay Ave Unit 1 Baltimore, MD | 2.0 | 1.0 | 1364 | $1,155 | $0.85 | 3d | 1 | 0.55mi |
| 3828 10th St Brooklyn, MD | 3.0 | 2.0 | 1215 | $2,350 | $1.93 | 44d | 1 | 0.64mi |
| 3826 10th St Unit Entire House Baltimore, MD | 3.0 | 2.0 | 1110 | $2,400 | $2.16 | 24d | 1 | 0.64mi |
| 837 E Jeffrey St Unit 2 Baltimore, MD | 1.0 | 1.0 | 1116 | $900 | $0.81 | 44d | 1 | 0.75mi |
| 837 E Jeffrey St Apt 1 Baltimore, MD | 1.0 | 1.0 | 1116 | $900 | $0.81 | 18d | 1 | 0.75mi |
| 5215 Wasena Ave Brooklyn, MD | 3.0 | 1.0 | 1030 | $1,650 | $1.60 | 44d | 1 | 0.82mi |
| 3840 8th St Brooklyn, MD | 3.0 | 1.5 | 1088 | $1,606 | $1.48 | 4d | 1 | 0.85mi |
| 4201 Audrey Ave Unit 1 Brooklyn, MD | 2.0 | 1.0 | 1400 | $1,350 | $0.96 | 24d | 1 | 0.94mi |
| 4206 Audrey Ave Brooklyn, MD | 3.0 | 3.0 | 1104 | $1,950 | $1.77 | 24d | 1 | 0.97mi |
| 4206 Audrey Ave Brooklyn, MD | 2.0 | 2.0 | 1104 | $1,275 | $1.15 | 44d | 1 | 0.97mi |
| 3822 6th St Brooklyn, MD | 3.0 | 3.0 | 1580 | $1,850 | $1.17 | 24d | 1 | 1.01mi |
| 507 Washburn Ave Brooklyn, MD | 3.0 | 1.5 | 1024 | $2,500 | $2.44 | 4d | 1 | 1.04mi |
| 507 Washburn Ave Brooklyn, MD | 3.0 | 1.5 | 1024 | $2,500 | $2.44 | 24d | 1 | 1.04mi |
| 507 Washburn Ave Brooklyn, MD | 3.0 | 1.5 | 1024 | $2,500 | $2.44 | 20d | 1 | 1.04mi |
| 603 Maude Ave Unit A Baltimore, MD | 1.0 | 1.0 | 1294 | $950 | $0.73 | 4d | 1 | 1.08mi |
| 3428 7th St Unit B Baltimore, MD | 1.0 | 1.0 | 1294 | $1,150 | $0.89 | 44d | 1 | 1.08mi |
| 3528 6th St Brooklyn, MD | 2.0 | 2.5 | 1060 | $1,500 | $1.42 | 18d | 1 | 1.10mi |
| 4400 4th St Unit BASEMENT Baltimore, MD | 2.0 | 1.0 | 925 | $1,350 | $1.46 | 44d | 1 | 1.15mi |
| 3569 4th St Brooklyn, MD | 2.0 | 1.5 | 1256 | $1,200 | $0.96 | 18d | 1 | 1.21mi |
| 3513 Horton Ave Brooklyn, MD | 3.0 | 1.0 | 1020 | $1,600 | $1.57 | 18d | 1 | 1.29mi |
Listing history 6 events
-
2026-06-18days on market $160,000 Coming Soon 8 DOM
-
2026-06-17days on market $160,000 Coming Soon 7 DOM
-
2026-06-16days on market $160,000 Coming Soon 6 DOM
-
2026-06-15days on market $160,000 Coming Soon 5 DOM
-
2026-06-13remarks 699-char remark
-
2026-06-13$160,000 Coming Soon 3 DOM
ⓘ Source: listings_history table (triggers on properties + properties_extension) + one-shot
backfill from property_details.listing_events for pre-trigger history.
Tax reassessment forecast MD · Partial reset (capped growth)
- Current annual tax
- $368 · $31/mo
- Projected year-2 tax
- $1,056 · $88/mo
- Expected delta
- +$688/yr (+$57/mo · 187.0%)
ⓘ Screening estimate from a state-policy table — verify with the county assessor before closing.
Climate risk First Street
- Flood 1/10 Low FEMA zone X (unshaded) · 0% chance over 30 yrs
- Wildfire 1/10 Low
- Heat 8/10 Severe 7 d/yr ≥103°F today · 15 d/yr by 30 yrs out
- Wind 6/10 Major 27% chance of damaging wind over 30 yrs
- Air quality 4/10 Moderate 5 unhealthy d/yr today · 7 by 30 yrs out
Nearby sold comps map
Loading sold comps map…
Walkable amenities ~0.75 mi
Loading nearby amenities…
Taxation est. · year 1
- Rental income
- $19,316
- − Mortgage interest
- −$8,962
- − Property taxes
- −$368
- − Insurance
- −$800
- − Repairs & maintenance
- −$1,545
- − Management
- −$1,545
- − Depreciation
- −$4,655
- Taxable income
- $1,440
- Est. tax owed @ 24.0%
- −$346
- After-tax cash flow
- $3,677/yr
For passive investors: Depreciation is non-cash, so a rental often shows a tax loss while cash-flowing — sheltering income. Rental losses are passive: they offset passive income freely, and up to $25,000/yr can offset ordinary (W-2) income if you actively participate and your MAGI is under $100k (phasing out to $0 by $150k); unused losses carry forward. On sale, claimed depreciation is recaptured at up to 25%, and gains may owe capital-gains tax (a 1031 exchange can defer both). Figures are a year-1 estimate at your 24.0% rate — not tax advice; consult a CPA.
Schools (NCES district)
- District
- Baltimore City Public Schools
- NCES district ID
- 2400090
- Math proficiency
- 7% ▼ -9.00%
- Reading proficiency
- 16% ▼ -5.00%
- Median HH income
- $42,108
- Composite
- 10.08/100
- National rank
- #9805
- State rank
- #24 of 24 in MD
Livability — Baltimore
- Score
- 76/100
- State rank
- #90
- US rank
- #3396
Category grades
Schools grade is shown separately in the Schools card above.
Census & demographics
- Census place
- Baltimore, MD
- City population
- 588,727
- Population (ZIP)
- 6,593
Population outlook (Baltimore County) Hauer SSP2
- Today (2025)
- 624,249 people
- By 2030
- 621,541 · -0.4%
- By 2040
- 609,756 · -2.3%
- By 2050
- 597,249 · -4.3%
- By 2075
- 552,236 · -11.5%
- By 2100
- 513,934 · -17.7%
Race, ethnicity, and origin ACS 2023
- Neighborhood character
- Diverse neighborhood (Simpson 0.61)
- Race & ethnicity
- White 59% Black 18% Two or more races 13% Hispanic / Latino 8% Asian 4%
- Hispanic origin (detail)
- Mexican 4% Puerto Rican 3%
- Common ancestry
- Slovak 7% Romanian 2% Scotch-Irish 1%
- Foreign-born
- 7% · Canada, Jamaica
- Languages at home
- 91% English-only · Spanish 7% Tagalog/Filipino 1% Other Indo-European 1%
Political lean MEDSL · Baltimore
- 2024 margin
- Solid D (+73.0) · D 85.2% · R 12.2% · Other 2.6%
- 2008→2024 swing
- -2.5pp toward R · 2008: 75.5pp · 2024: 73.0pp
- All cycles
- 2024: D+73.0 2020: D+76.6 2016: D+74.6 2012: D+76.4 2008: D+75.5
Not yet ingested
- Civics
- —
Market trends
- HPI YoY
- ▲ 7.75%
- Current HPI
- 318.79
- Rent YoY
- —
- Metro
- —
- State GDP YoY
- ▲ 2.97%
- F500 in state
- 12
Industry mix (Fortune 500 HQ in MD)
| Industry | F500 HQs | Revenue |
|---|---|---|
| Aerospace / Defense | 1 | $71B |
|
||
| Utilities | 1 | $25B |
|
||
| Hotels | 1 | $24B |
|
||
| Consumer Goods | 1 | $7B |
|
||
| Real Estate | 1 | $6B |
|
||
| Chemicals | 1 | $2B |
|
||
Price history
+150.4% since first listed8 events — show timeline
- 2026-06-10 Coming Soon $160,000 BRIGHT MLS
- 2007-05-21 Sold (Public Records) $85,000 Public Records
- 2007-03-23 Sold (MLS) $85,000 MRIS
- 2007-02-07 Delisted — MRIS
- 2006-09-29 Listed $84,900 MRIS
- 2006-05-05 Sold (Public Records) $55,620 Public Records
- 1997-11-14 Sold (Public Records) $19,500 Public Records
- 1993-06-04 Sold (Public Records) $63,900 Public Records
Property tax history
-8.3%/yrLatest (2025): $368 · +27.0% YoY. Source: county tax records.
Cash-flow waterfall
monthlySold comps — $/sqft
last 12 mo · ≤1 miLoading sold comps…