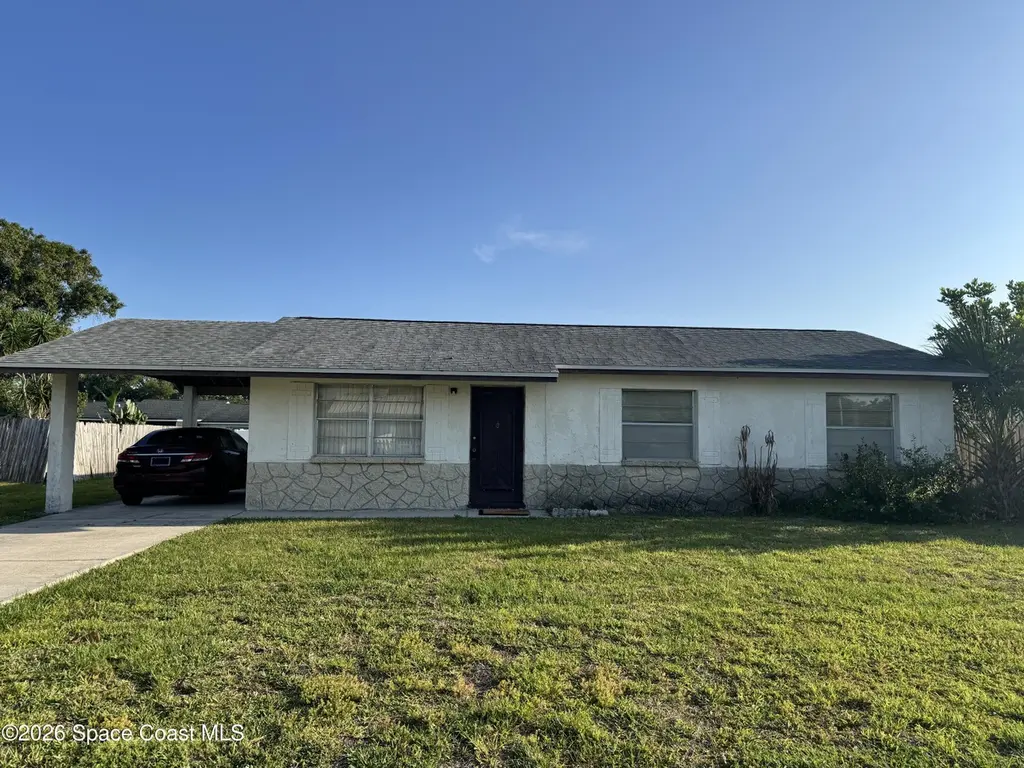
2868 Kensington Dr · Melbourne, FL
Flood risk 4/10 · Minor
- FEMA flood zone
- X (unshaded)
- Chance of flooding over 30 yrs
- 0.2%
- Est. flood insurance / yr
- $507 – $1,088
Fire risk 1/10 · Minimal
- Est. fire insurance / yr
- $947 – $1,759
Heat risk 10/10 · Severe
- Hot days now (above 105°F)
- 7 days/yr
- Hot days in 30 yrs
- 24 days/yr
Wind risk 10/10 · Severe
- Chance of severe wind over 30 yrs
- 99.0%
Air-quality risk 1/10 · Minimal
- Unhealthy air days now
- 0 days/yr
- Unhealthy air days in 30 yrs
- 0 days/yr
Risk factors via First Street. Map © Google.
Why this score? — see what drove the B- grade
The composite is a weighted blend of 9 inputs, each scored 0–100. Each bar is that input's sub-score; the figure is the points it added to the 100-point composite (weight × sub-score).
- Cash flow +30.0/30.0
- DSCR +10.0/10.0
- 1% rule +7.8/10.0
- ARV discount +7.5/15.0
- Schools +4.7/10.0
- Rent growth +2.6/5.0
- Livability +2.5/5.0
- Condition / age +2.5/5.0
- Appreciation +0.0/10.0
$149,900
🖨 Deal sheet (PDF) 📄 Offer letter ✓ Due diligence
Listing remarks
In the heart of Melbourne, this 3 BR, 2 BA concrete block home offers an incredible opportunity for investors or buyers ready to create their dream home from the ground up. This one-story single family property features a functional layout, one-car carport, and the freedom of NO HOA. Conveniently situated within walking distance to Eastern Florida State College, Longleaf Elementary School, shopping, dining, and everyday conveniences, the location is ideal for future homeowners or rental potential. With solid construction, city water and sewer and a prime location near major roadways, beaches, employers, and the Space Coast lifestyle, this property is packed with upside potential. Full renov
Key facts
- Solid construction
- City water and sewer
- One car carport
Tags
Property features AI
Finance
- Other: Partially furnished; Lot dimensions roughly 75 x 110 (0.19 acres)
Exterior
- Parking: Attached carport (1 space)
- Utilities: Public sewer; Cable available; Electricity available; Water available; Sewer available
- Home design: Single-family residence; One story; Entry level: 1; Property faces south
- Construction: Block and concrete construction; Shingle roof; Built area approximately 1,480 total / 1,260 living area; Pets allowed
- Exterior features: Cleared lot; City street frontage; Asphalt road surface
Interior
- Bedrooms: 3 bedrooms
- Bathrooms: 2 full bathrooms
- Heating & cooling: Central heating (electric); Central air conditioning (electric)
- Interior features: Primary bedroom located downstairs
Neighborhood map
What this means for you Summary
Snapshot
- This is a 2-bed/2.0-bath single-family listed at $150k.
Deal economics
- At list price, monthly cash flow is $619 ($7k/yr) — positive.
- The deal already cash-flows at list — no discount required.
- Meets the 1% rule at list price ($2k rent vs $150k).
Location & tenants
- Location reads: area grade B — affects rentability + tenant quality, not the cash-flow math above.
- Brevard (suburban): math 53% / reading 57% proficiency, ranked #19 of 73 in FL (top 26%) — acceptable for families but not a draw, mixed tenant base, ~2y average lease.
- Zoned schools: Sherwood Elementary School (math 52% / reading 62%, grade C+, #781 of 2,144 statewide, top 38%, 458 students, 65% FRL); Lyndon B. Johnson Middle School (math 40% / reading 42%, grade F, #353 of 571 statewide, top 63%, 610 students, 61% FRL); Eau Gallie High School (math 20% / reading 49%, grade F, #386 of 667 statewide, top 59%, 1,586 students, 55% FRL) — zoned schools average 60% FRL vs 43% district-wide (17 pts higher); higher-poverty schools than district average — tighter screening recommended.
- Market conditions: Rents flat; 335 active listings in the ZIP; 6 comparable units currently listed for rent nearby; rentals at typical pace (median 25d on market — plan ~3-4 weeks tenant-placement turnaround); 4,602 units permitted in Brevard County in 2024 (702 in 5+ unit buildings).
- This rent runs 36% of the median local income ($65k/yr) — at the standard rent-burdened threshold; future hikes will face affordability resistance.
Forward outlook
- Local home prices are declining (-3.0%/yr); year-one equity from $1k of loan paydown is wiped out by about $4k of value loss. Plan a longer hold.
- Brevard County population projected at +15% by 2050 — modest demand growth; plan on rents tracking national, not racing it.
- At projected returns (-3.0% appreciation + 0.5% rent growth), your $42k cash investment doubles in ~9 years — after that, you're playing with house money.
Negotiation context
- Only 3 days on market — expect competitive offers; lowballing is unlikely to land.
- Current owner paid $57k; list at $150k implies a 163% gain — meaningful room to come down on a strong offer.
Risks & watch-outs
- Climate carrying-cost: severe wind risk, 99% chance of damaging wind over 30y; extreme-heat days projected 7→24/yr by 2055 (HVAC capex compounding) — expect insurance premiums to compound above CPI over the hold.
Questions for the listing agent
- Built in 1978 — when were the roof, HVAC, electrical panel, plumbing, and water heater last replaced?
- Is there a deadline driving the sale (1031 exchange, divorce, estate, relocation)? That informs how much negotiation room exists.
- What's the average days-on-market for RENTAL listings here right now (not sales)? A rising rental-DOM trend means longer vacancies and softer asking-rent achievability than the comps imply.
- What's the recent tenant-quality profile in this submarket — average credit score on applications, eviction rate, late-payment / NSF rate, and stable-employment percentage? A property-management company in the area should have these aggregated.
- How much new for-sale + rental construction is in the pipeline within 1–3 miles? Heavy new supply typically softens prices + rents 12–24 months out; constrained supply supports both.
Investment metrics
- 1% rule
- 1.28% ✓
- Cap rate
- 11.25%
- Cash-on-cash
- 17.70%
- DSCR
- 1.79
- GRM
- 6.5
CMA / ARV
No comps found within radius.
Projected returns pro-forma
-3.0% appreciation · 0.53% rent growth · sell at horizon
- IRR
- 6.6%
- Equity multiple
- 1.25×
- Total profit
- $10,435
- Equity at exit
- $22,351
- IRR
- 13.8%
- Equity multiple
- 1.99×
- Total profit
- $41,451
- Equity at exit
- $12,961
Cash invested: $41,972 (down + closing). Projections, not guarantees.
Landlord ↔ Tenant lean methodology
- Overall (STATE)
- 87 Strongly Landlord-Friendly
- State Florida
- 87 Strongly Landlord-Friendly · R+3
- County
- — inherits STATE
- City
- — inherits STATE
ZIP-level market 32935
- Rents YoY
- 0.5%
- Active inventory
- 335
- Price-to-rent
- 6.5×
Monthly cashflow live
- Estimated rent
- $1,921 high interval (Pro) →
- Mortgage (P&I)
- −$786
- Tax from tax record
- −$50 /mo · $596/yr
- Insurance
- −$62
- HOA
- −$0
- Vacancy / Maint / Mgmt
- −$403
- Net cashflow
- $619
Break-even live
Sensitivity live
| Price | -10% $704 | -5% $662 | +0% $619 | +5% $577 | +10% $534 |
|---|---|---|---|---|---|
| Rent | -10% $467 | -5% $543 | +0% $619 | +5% $695 | +10% $771 |
| Rate | -1.0pp $695 | -0.5pp $657 | base $619 | +0.5pp $580 | +1.0pp $541 |
UW: 25.0% down · 7.5% · 30yr · 1.5% tax · 5.0% vac · 8.0% maint · 8.0% mgmt
Financing live
Cash to close
- Down payment
- $37,475
- Closing costs
- $4,497
- Reserves months
- —
- Total cash needed
- —
Loan-product check · same deal, 3 products live
Conventional
25% down · 7.5% · 30yr
- Down + closing
- —
- Monthly P&I
- —
- Monthly cashflow
- —
- DSCR
- —
- Eligible?
- —
Personal DTI + credit; lowest rate.
DSCR
20% down · 8.5% · 30yr
- Down + closing
- —
- Monthly P&I
- —
- Monthly cashflow
- —
- DSCR
- —
- Eligible?
- —
No personal income docs; deal must DSCR.
Hard money
10% down · 12.0% · 12mo
- Down + closing
- —
- Monthly P&I
- —
- Monthly cashflow
- —
- DSCR
- —
- Eligible?
- —
Short-term bridge; refi at stabilization.
Rent comps 6 comps
| Address | Beds | Baths | Sqft | Rent | $/sqft | DOM | Units | Dist |
|---|---|---|---|---|---|---|---|---|
| 2796 Lancaster Rd Melbourne, FL | 3.0 | 2.0 | 1180 | $2,195 | $1.86 | 22d | 1 | 0.12mi |
| 4465 Preserve Dr Melbourne, FL | 1.0–3.0 | 1.0–2.0 | 1027 | $1,732 | $1.69 | 15d | 13 | 0.42mi |
| 2544 Coventry Rd Melbourne, FL | 3.0 | 2.0 | 1100 | $2,100 | $1.91 | 25d | 1 | 0.52mi |
| 2107 Little John Rd Melbourne, FL | 3.0 | 1.0 | 936 | $1,600 | $1.71 | 25d | 1 | 0.91mi |
| 1900 Post Rd Melbourne, FL | 1.0–3.0 | 1.0–2.0 | 840 | $1,626 | $1.94 | 15d | 10 | 1.12mi |
| 2544 Park Place Blvd Melbourne, FL | 3.0 | 2.0 | 1830 | $2,150 | $1.17 | 25d | 1 | 1.48mi |
Listing history 4 events
-
2026-05-11status Pending
-
2026-05-08$149,900 Active
-
1991-05-01soldstatus $56,900
-
1978-11-01soldstatus $29,900
ⓘ Source: listings_history table (triggers on properties + properties_extension) + one-shot
backfill from property_details.listing_events for pre-trigger history.
Tax reassessment forecast FL · Resets to sale price
- Current annual tax
- $596 · $50/mo
- Projected year-2 tax
- $1,244 · $104/mo
- Expected delta
- +$648/yr (+$54/mo · 108.7%)
ⓘ Screening estimate from a state-policy table — verify with the county assessor before closing.
Climate risk First Street
- Flood 4/10 Moderate FEMA zone X (unshaded) · 20% chance over 30 yrs
- Wildfire 1/10 Low
- Heat 10/10 Extreme 7 d/yr ≥105°F today · 24 d/yr by 30 yrs out
- Wind 10/10 Extreme 99% chance of damaging wind over 30 yrs
- Air quality 1/10 Low 0 unhealthy d/yr today · 0 by 30 yrs out
Nearby sold comps map
Loading sold comps map…
Walkable amenities ~0.75 mi
Loading nearby amenities…
Taxation est. · year 1
- Rental income
- $23,050
- − Mortgage interest
- −$8,397
- − Property taxes
- −$596
- − Insurance
- −$750
- − Repairs & maintenance
- −$1,844
- − Management
- −$1,844
- − Depreciation
- −$4,361
- Taxable income
- $5,259
- Est. tax owed @ 24.0%
- −$1,262
- After-tax cash flow
- $6,169/yr
For passive investors: Depreciation is non-cash, so a rental often shows a tax loss while cash-flowing — sheltering income. Rental losses are passive: they offset passive income freely, and up to $25,000/yr can offset ordinary (W-2) income if you actively participate and your MAGI is under $100k (phasing out to $0 by $150k); unused losses carry forward. On sale, claimed depreciation is recaptured at up to 25%, and gains may owe capital-gains tax (a 1031 exchange can defer both). Figures are a year-1 estimate at your 24.0% rate — not tax advice; consult a CPA.
Schools (NCES district)
- District
- Brevard
- NCES district ID
- 1200150
- Math proficiency
- 53% ▼ -9.00%
- Reading proficiency
- 57% ▼ -4.00%
- Median HH income
- $49,426
- Composite
- 46.86/100
- National rank
- #2370
- State rank
- #19 of 73 in FL
Livability — Melbourne
No livability data for this city. (Only ~50 U.S. cities are tracked.)
Census & demographics
- Census place
- Melbourne, FL
- County
- Brevard County · 602,871 people
- City population
- 178,420
- Metro
- Palm Bay-Melbourne-Titusville, FL
- Population (ZIP)
- 41,965
- Household income
- $64,588
- Rent vs Own
- Severe rent burden
- 1747.0
Population outlook (Brevard County) Hauer SSP2
- Today (2025)
- 623,254 people
- By 2030
- 648,420 · +4.0%
- By 2040
- 690,009 · +10.7%
- By 2050
- 715,669 · +14.8%
- By 2075
- 775,744 · +24.5%
- By 2100
- 776,687 · +24.6%
Race, ethnicity, and origin ACS 2023
- Neighborhood character
- Predominantly White (74%)
- Race & ethnicity
- White 74% Hispanic / Latino 13% Two or more races 9% Black 5% Asian 2%
- Hispanic origin (detail)
- Mexican 3% Puerto Rican 5%
- Common ancestry
- Slovak 2% Romanian 2% Lithuanian 2%
- Foreign-born
- 9% · Canada, Vietnam, Jamaica
- Languages at home
- 88% English-only · Spanish 8% Other Indo-European 1% Tagalog/Filipino 1%
Political lean MEDSL · Brevard
- 2024 margin
- Strong R (+20.8) · D 39.1% · R 59.9% · Other 1.0%
- 2008→2024 swing
- -10.4pp toward R · 2008: -10.4pp · 2024: -20.8pp
- All cycles
- 2024: R+20.8 2020: R+16.4 2016: R+19.8 2012: R+12.7 2008: R+10.4
Not yet ingested
- Civics
- —
Market trends
- HPI YoY
- ▼ -185.48%
- Current HPI
- 308.7443
- Rent YoY
- ▲ 0.53%
- Metro
- Palm Bay-Melbourne-Titusville, FL
- State GDP YoY
- ▲ 3.28%
- F500 in state
- 36
Industry mix (Fortune 500 HQ in FL)
| Industry | F500 HQs | Revenue |
|---|---|---|
| Industrial Technology | 2 | $29B |
|
||
| Insurance | 2 | $17B |
|
||
| Retail | 1 | $60B |
|
||
| Technology Distribution | 1 | $58B |
|
||
| Homebuilding | 1 | $35B |
|
||
| Technology Manufacturing | 1 | $35B |
|
||
Price history
+401.3% since first listed4 events — show timeline
- 2026-05-11 Pending — SCMLS
- 2026-05-08 Listed $149,900 SCMLS
- 1991-05-01 Sold (Public Records) $56,900 Public Records
- 1978-11-01 Sold (Public Records) $29,900 Public Records
Property tax history
+1.3%/yrLatest (2025): $596 · +4.2% YoY. Source: county tax records.
Cash-flow waterfall
monthlySold comps — $/sqft
last 12 mo · ≤1 miLoading sold comps…