 Duplex
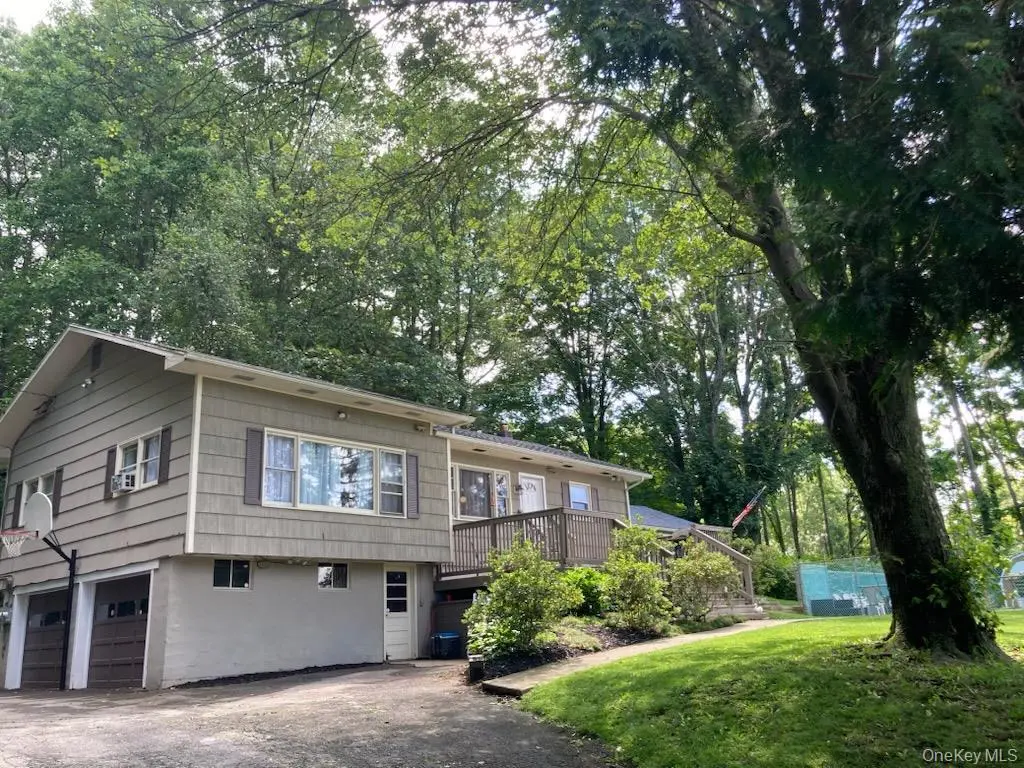
747 Bloomingburg Rd · Bloomingburg, NY
Flood risk 1/10 · Minimal
- FEMA flood zone
- X (unshaded)
- Chance of flooding over 30 yrs
- 0.0%
- Est. flood insurance / yr
- $473 – $860
Fire risk 3/10 · Minor
- Est. fire insurance / yr
- $691 – $1,283
Heat risk 4/10 · Minor
- Hot days now (above 98°F)
- 7 days/yr
- Hot days in 30 yrs
- 15 days/yr
Wind risk 3/10 · Minor
- Chance of severe wind over 30 yrs
- 7.0%
Air-quality risk 2/10 · Minimal
- Unhealthy air days now
- 1 days/yr
- Unhealthy air days in 30 yrs
- 2 days/yr
Risk factors via First Street. Map © Google.
Why this score? — see what drove the D+ grade
The composite is a weighted blend of 9 inputs, each scored 0–100. Each bar is that input's sub-score; the figure is the points it added to the 100-point composite (weight × sub-score).
- Cash flow +17.6/30.0
- ARV discount +7.5/15.0
- DSCR +5.5/10.0
- 1% rule +5.1/10.0
- Schools +3.8/10.0
- Rent growth +2.5/5.0
- Livability +2.5/5.0
- Condition / age +2.5/5.0
- Appreciation +1.6/10.0
$369,000
🖨 Deal sheet (PDF) 📄 Offer letter ✓ Due diligence
Multi-family units
County records classify this as Multi-Family (2-4 Unit). Listing-text estimate: 2 units. confirmed
Listing remarks
Welcome to 747 Bloomingburg Road , a versatile legal 2 family split-level home set on nearly an acre of land in the heart of the Hudson Valley. The main residence offers generous living space with 3 bedrooms and 2 full baths, while a self-contained studio apartment with its own private entrance provides an incredible opportunity for rental income or a perfect setup for extended family, guests, or a home office suite. Whether you're an owner-occupant looking to offset your mortgage or an investor seeking a turnkey income property, this home delivers real flexibility. Enjoy summer days in your private in-ground pool, and take advantage of the 2 car garage tucked under the home alongside a sem
Key facts
- 2-family designation
- In-ground pool
- Private entrance
Tags
Property features AI
Exterior
- Parking: Driveway; Garage; 6 total parking spaces; 2-car garage
- Utilities: Septic tank; Electricity connected; Natural gas connected; Private trash collection
- Home design: Duplex
- Construction: Frame construction
- Exterior features: Private pool; No waterfront
Interior
- Bedrooms: One 3-bedroom unit
- Bathrooms: 3 full bathrooms
- Heating & cooling: Central air conditioning; Oil heating
- Interior features: First-floor bedroom; First-floor full bathroom; Primary bathroom
- Laundry & utility: Laundry in basement
Neighborhood map
What this means for you Summary
Snapshot
- This is a 2 × 2-bed/1.5-bath units multifamily listed at $369k.
Deal economics
- At list price, monthly cash flow is $288 ($3k/yr) — positive. Per door: $144/mo.
- The deal already cash-flows at list — no discount required.
- Meets the 1% rule at list price ($4k rent vs $369k).
- Recommended offer: $358k (3.0% below list) — sets the bar for market timing.
- Cap rate 7.2% vs local median 3.6% in Bloomingburg — top-decile yield for the area; either an underpriced asset or a hidden risk that comps aren't pricing in. Stress-test before assuming the spread holds.
Location & tenants
- Location reads 49/100 on livability (#1,175 in NY) — a working-class tenant base; expect higher turnover. Watch: cost of living D+, housing D+, crime F.
- Pine Bush Central School District (rural): math 38% / reading 45% proficiency, ranked #468 of 590 in NY (top 79%) — families likely to look elsewhere, expect single-tenant / working-renter base with shorter leases.
- Zoned schools: Pine Bush Elementary School (math 12% / reading 45%, grade F, #1,771 of 2,108 statewide, top 84%, 649 students, 53% FRL); Crispell Middle School (math 17% / reading 46%, grade F, #522 of 729 statewide, top 73%, 633 students, 52% FRL); Pine Bush Senior High School (math 92% / reading 67%, grade A-, #518 of 1,100 statewide, top 51%, 1,615 students, 56% FRL) — zoned schools average 54% FRL vs 29% district-wide (25 pts higher); higher-poverty schools than district average — tighter screening recommended.
- Market conditions: 83 active listings in the ZIP; 1 comparable units currently listed for rent nearby; 1,746 units permitted in Orange County in 2024 (1,265 in 5+ unit buildings).
Forward outlook
- Local home prices are declining (-3.0%/yr); year-one equity from $3k of loan paydown is wiped out by about $11k of value loss. Plan a longer hold.
Negotiation context
- It's been on market 42 days — a 3% lower offer ($358k) is reasonable based on typical stale-listing flexibility.
- 2 sale attempts with the ask held roughly flat each time — persistent listings suggest the price (not the market) is what's stuck; bring a comps-based counter.
- Current owner paid $110k; list at $369k implies a 235% gain — meaningful room to come down on a strong offer.
Risks & watch-outs
- Watch-outs: built in 1957 — expect roof / HVAC / electrical / plumbing capex.
Questions for the listing agent
- It's been on market 42 days. Have you received any prior offers? Is the seller open to a 3% concession, seller financing, or rate buy-down credit?
- Can we see the unit-by-unit rent roll, current vacancy, and any below-market leases? What's the average tenancy length?
- What capital expenditures (roof, boiler, parking lot, exteriors) have been made in the last 5 years, and what's planned in the next 2?
- Built in 1957 — when were the roof, HVAC, electrical panel, plumbing, and water heater last replaced?
- Is there a deadline driving the sale (1031 exchange, divorce, estate, relocation)? That informs how much negotiation room exists.
- Schools are F-rated, which usually means shorter tenancies and higher turnover. Who's the typical renter profile here, and what's been the actual vacancy rate?
- Crime grade is F in this area — have there been break-ins, vandalism, or insurance claims at this property in the last 3 years? What carrier currently insures it and at what premium?
- The area grade is low — what's the realistic commute time and amenity access for the typical tenant pool here? Any planned neighborhood developments (good or bad) we should know about?
- What's the average days-on-market for RENTAL listings here right now (not sales)? A rising rental-DOM trend means longer vacancies and softer asking-rent achievability than the comps imply.
- What's the recent tenant-quality profile in this submarket — average credit score on applications, eviction rate, late-payment / NSF rate, and stable-employment percentage? A property-management company in the area should have these aggregated.
- How much new apartment / multifamily construction is in the pipeline within 1–3 miles? Heavy new supply (>2% of stock underway) typically softens rents 12–24 months out; light construction supports rent growth.
Investment metrics
- 1% rule
- 1.01% ✓
- Cap rate
- 7.23%
- Cash-on-cash
- 3.34%
- DSCR
- 1.15
- GRM
- 8.3
CMA / ARV
- ARV (median comp)
- $1,119,515
- List price
- $369,000
- Delta
- -67.04%
- Verdict
- UNDERPRICED
- Comps
- 2 within 2.0 mi
Projected returns pro-forma
-3.0% appreciation · 3.0% rent growth · sell at horizon
- IRR
- -11.0%
- Equity multiple
- 0.60×
- Total profit
- $-41,361
- Equity at exit
- $55,019
- IRR
- -1.7%
- Equity multiple
- 0.88×
- Total profit
- $-11,955
- Equity at exit
- $31,904
Cash invested: $103,320 (down + closing). Projections, not guarantees.
Landlord ↔ Tenant lean methodology
- Overall (STATE)
- 15 Strongly Tenant-Friendly
- State New York
- 15 Strongly Tenant-Friendly · D+10
- County
- — inherits STATE
- City
- — inherits STATE
ZIP-level market 12721
- Home prices YoY
- -2.1%
- Active inventory
- 83
- Price-to-rent
- 16.5×
Monthly cashflow live
- Estimated rent
- $3,718 medium interval (Pro) →
- Mortgage (P&I)
- −$1,935
- Tax from tax record
- −$561 /mo · $6,730/yr
- Insurance
- −$154
- HOA
- −$0
- Vacancy / Maint / Mgmt
- −$781
- Net cashflow
- $288
Break-even live
Sensitivity live
| Price | -10% $496 | -5% $392 | +0% $288 | +5% $183 | +10% $79 |
|---|---|---|---|---|---|
| Rent | -10% $-6 | -5% $141 | +0% $288 | +5% $434 | +10% $581 |
| Rate | -1.0pp $473 | -0.5pp $381 | base $288 | +0.5pp $192 | +1.0pp $95 |
2-unit breakdown (identical units grouped — click to expand)
| Units | Beds | Baths | Est. rent |
|---|---|---|---|
| 2× units | 2 | 1.5 | $3,718 |
| #1 | 2 | 1.5 | $1,859 |
| #2 | 2 | 1.5 | $1,859 |
| Total (2 units) | $3,718 | ||
UW: 25.0% down · 7.5% · 30yr · 1.5% tax · 5.0% vac · 8.0% maint · 8.0% mgmt
Financing live
Cash to close
- Down payment
- $92,250
- Closing costs
- $11,070
- Reserves months
- —
- Total cash needed
- —
Loan-product check · same deal, 3 products live
Conventional
25% down · 7.5% · 30yr
- Down + closing
- —
- Monthly P&I
- —
- Monthly cashflow
- —
- DSCR
- —
- Eligible?
- —
Personal DTI + credit; lowest rate.
DSCR
20% down · 8.5% · 30yr
- Down + closing
- —
- Monthly P&I
- —
- Monthly cashflow
- —
- DSCR
- —
- Eligible?
- —
No personal income docs; deal must DSCR.
Hard money
10% down · 12.0% · 12mo
- Down + closing
- —
- Monthly P&I
- —
- Monthly cashflow
- —
- DSCR
- —
- Eligible?
- —
Short-term bridge; refi at stabilization.
Rent comps 1 comps
| Address | Beds | Baths | Sqft | Rent | $/sqft | DOM | Units | Dist |
|---|---|---|---|---|---|---|---|---|
| 90 North Rd Bloomingburg, NY | 3.0 | 1.0 | 1400 | $2,700 | $1.93 | 21d | 1 | 1.16mi |
Listing history 8 events
-
2026-06-02status $369,000 Pending 42 DOM
-
2026-06-01days on market $369,000 Active 42 DOM
-
2026-05-31days on market $369,000 Active 41 DOM
-
2026-05-30days on market $369,000 Active 40 DOM
-
2026-04-21historical
-
2026-04-20$369,000 Active
-
2026-04-20$369,000 Active 1663-char remark
-
2001-08-02soldstatus $110,000
ⓘ Source: listings_history table (triggers on properties + properties_extension) + one-shot
backfill from property_details.listing_events for pre-trigger history.
Tax reassessment forecast NY · Partial reset (capped growth)
- Current annual tax
- $6,730 · $561/mo
- Projected year-2 tax
- $6,730 · $561/mo
- Expected delta
- $0/yr ($0/mo · 0.0%)
ⓘ Screening estimate from a state-policy table — verify with the county assessor before closing.
Climate risk First Street
- Flood 1/10 Low FEMA zone X (unshaded) · 0% chance over 30 yrs
- Wildfire 3/10 Moderate
- Heat 4/10 Moderate 7 d/yr ≥98°F today · 15 d/yr by 30 yrs out
- Wind 3/10 Moderate 7% chance of damaging wind over 30 yrs
- Air quality 2/10 Low 1 unhealthy d/yr today · 2 by 30 yrs out
Nearby sold comps map
Loading sold comps map…
Walkable amenities ~0.75 mi
Loading nearby amenities…
Taxation est. · year 1
- Rental income
- $44,616
- − Mortgage interest
- −$20,670
- − Property taxes
- −$6,730
- − Insurance
- −$1,845
- − Repairs & maintenance
- −$3,569
- − Management
- −$3,569
- − Depreciation
- −$10,735
- Taxable loss
- −$2,502
- Est. tax savings @ 24.0%
- +$600
- After-tax cash flow
- $4,051/yr
For passive investors: Depreciation is non-cash, so a rental often shows a tax loss while cash-flowing — sheltering income. Rental losses are passive: they offset passive income freely, and up to $25,000/yr can offset ordinary (W-2) income if you actively participate and your MAGI is under $100k (phasing out to $0 by $150k); unused losses carry forward. On sale, claimed depreciation is recaptured at up to 25%, and gains may owe capital-gains tax (a 1031 exchange can defer both). Figures are a year-1 estimate at your 24.0% rate — not tax advice; consult a CPA.
Schools (NCES district)
- District
- Pine Bush Central School District
- NCES district ID
- 3623010
- Math proficiency
- 38% ▼ -16.00%
- Reading proficiency
- 45% ▼ -7.00%
- Median HH income
- $72,525
- Composite
- 37.87/100
- National rank
- #4324
- State rank
- #468 of 590 in NY
Livability — Bloomingburg
- Score
- 49/100
- State rank
- #1175
- US rank
- #25817
Category grades
Schools grade is shown separately in the Schools card above.
Census & demographics
- Population (ZIP)
- 7,590
Population outlook (Orange County) Hauer SSP2
- Today (2025)
- 379,830 people
- By 2030
- 378,955 · -0.2%
- By 2040
- 375,444 · -1.2%
- By 2050
- 369,311 · -2.8%
- By 2075
- 354,233 · -6.7%
- By 2100
- 318,150 · -16.2%
Race, ethnicity, and origin ACS 2023
- Neighborhood character
- Predominantly White (76%)
- Race & ethnicity
- White 76% Two or more races 14% Hispanic / Latino 13% Black 3% Asian 1%
- Hispanic origin (detail)
- Puerto Rican 8% Cuban 2% Dominican 2%
- Common ancestry
- Romanian 4% Scandinavian 4% Iranian 3%
- Foreign-born
- 4% · Canada
- Languages at home
- 79% English-only · German/W. Germanic 12% Spanish 5% Other Indo-European 1%
Political lean MEDSL · Orange
- 2024 margin
- Lean R (+8.4) · D 45.8% · R 54.2%
- 2008→2024 swing
- -12.5pp toward R · 2008: 4.1pp · 2024: -8.4pp
- All cycles
- 2024: R+8.4 2020: R+0.2 2016: R+6.5 2012: D+5.2 2008: D+4.1
Not yet ingested
- Civics
- —
Market trends
- HPI YoY
- ▼ -6.80%
- Current HPI
- 320.383
- Rent YoY
- —
- Metro
- —
- State GDP YoY
- ▲ 2.60%
- F500 in state
- 92
Industry mix (Fortune 500 HQ in NY)
| Industry | F500 HQs | Revenue |
|---|---|---|
| Financial Services | 10 | $950B |
|
||
| Consumer Goods | 9 | $162B |
|
||
| Insurance | 4 | $225B |
|
||
| Telecommunications | 2 | $144B |
|
||
| Pharmaceuticals | 2 | $112B |
|
||
| Media / Entertainment | 2 | $69B |
|
||
Price history
+235.5% since first listed5 events — show timeline
- 2026-06-02 Pending — OneKey® MLS as Distributed by MLS Grid
- 2026-04-21 Listing Removed — OneKey® MLS as Distributed by MLS Grid
- 2026-04-20 Listed $369,000 OneKey® MLS as Distributed by MLS Grid
- 2026-04-20 Listed $369,000 OneKey® MLS as Distributed by MLS Grid
- 2001-08-02 Sold (Public Records) $110,000 Public Records
Property tax history
+0.3%/yrLatest (2025): $6,730 · +4.7% YoY. Source: county tax records.
Cash-flow waterfall
monthlySold comps — $/sqft
last 12 mo · ≤1 miLoading sold comps…