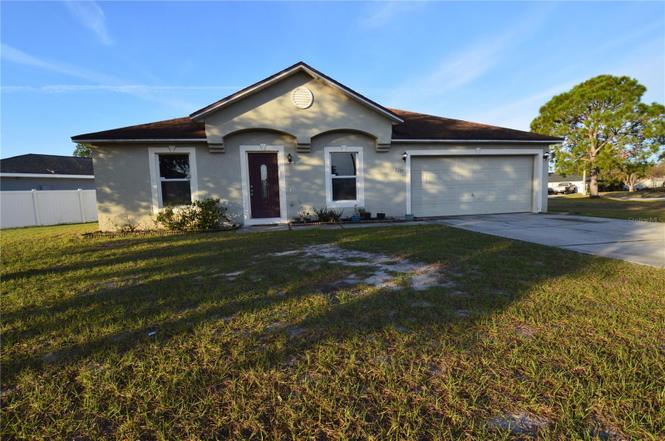
1617 Perdido Ct · Poinciana, FL
Flood risk 1/10 · Minimal
- FEMA flood zone
- X (unshaded)
- Chance of flooding over 30 yrs
- 0.0%
- Est. flood insurance / yr
- $507 – $1,088
Fire risk 5/10 · Moderate
- Est. fire insurance / yr
- $947 – $1,759
Heat risk 9/10 · Severe
- Hot days now (above 108°F)
- 7 days/yr
- Hot days in 30 yrs
- 25 days/yr
Wind risk 9/10 · Severe
- Chance of severe wind over 30 yrs
- 99.0%
Air-quality risk 1/10 · Minimal
- Unhealthy air days now
- 0 days/yr
- Unhealthy air days in 30 yrs
- 0 days/yr
Risk factors via First Street. Map © Google.
Why this score? — see what drove the D- grade
The composite is a weighted blend of 9 inputs, each scored 0–100. Each bar is that input's sub-score; the figure is the points it added to the 100-point composite (weight × sub-score).
- Cash flow +10.1/30.0
- ARV discount +7.5/15.0
- Appreciation +4.3/10.0
- Schools +3.5/10.0
- 1% rule +3.3/10.0
- DSCR +2.9/10.0
- Livability +2.9/5.0
- Rent growth +2.8/5.0
- Condition / age +2.5/5.0
$230,000
🖨 Deal sheet 📄 Offer letter ✓ Due diligence
Listing remarks MLS
NOT A SHORT SALE. 3/2 block home. Split plan, large eat-in kitchen. Selling as is with right to inspect. Contact listing agent for more information. NEW KITCHEN, NEW COUNTER TOP, NEW STAINLESS STEEL APPLIANCES, FRESHLY PAINTED. Selling as is with right to inspect. Purchase this property for as little as 3% down! Please contact listing agent for more information.
Key facts
- Poinciana community
- Fully tiled
- Granite counter tops
Tags
Property features AI
Finance
- Other: Total acreage: under 1/4 acre (approx. 0.18 acres)
- HOA & community: HOA: POINCIANA VILLAGES; HOA fee $100 monthly (includes cable TV and internet); Community amenities: Dog park, Park, Playground; Pets allowed
Exterior
- Parking: Attached 2-car garage (20 x 20)
- Utilities: Public water; Public sewer; Cable available
- Home design: Single family residence; Planned Unit Development (PUD); One-story; Northeast facing; Entry level: One
- Construction: Block construction; Shingle roof; Slab foundation; Built as single-story
- Exterior features: Other exterior features; Asphalt road
Interior
- Kitchen: Dishwasher; Garbage disposal; Range; Refrigerator
- Bedrooms: 3 bedrooms
- Flooring: Ceramic tile; Tile flooring (general)
- Bathrooms: 2 full bathrooms
- Heating & cooling: Central heating; Central air conditioning
- Interior features: Ceiling fans; Thermostat
- Laundry & utility: Laundry closet
Neighborhood map
What this means for you Summary
Snapshot
- This is a 3-bed/2.0-bath single-family listed at $230k.
Deal economics
- At list price, monthly cash flow is $-133 ($-2k/yr) — negative.
- To cash-flow at today's rent, offer at most $206k (10.2% below list).
- To meet the 1% rule (rent ≥ 1% of price), the offer needs to be $192k (16.7% below list).
- Recommended offer: $192k (16.7% below list) — sets the bar for 1% rule.
- Cap rate 5.6% vs local median 4.3% in Poinciana — top-decile yield for the area; either an underpriced asset or a hidden risk that comps aren't pricing in. Stress-test before assuming the spread holds.
Location & tenants
- Location reads 57/100 on livability (#859 in FL) — a working-class tenant base; expect higher turnover. Strengths: cost of living A+, housing A+; Watch: employment D+, schools F, amenities F.
- Polk (suburban): math 39% / reading 43% proficiency, ranked #62 of 73 in FL (top 85%) — families likely to look elsewhere, expect single-tenant / working-renter base with shorter leases.
- Market conditions: Rents rising (+1.1%/yr); 1151 active listings in the ZIP; 40 comparable units currently listed for rent nearby; rentals at typical pace (median 21d on market — plan ~3-4 weeks tenant-placement turnaround); 10,384 units permitted in Polk County in 2024 (1,716 in 5+ unit buildings).
- This rent runs 33% of the median local income ($69k/yr) — at the standard rent-burdened threshold; future hikes will face affordability resistance.
Forward outlook
- Local home prices are declining (-1.5%/yr); year-one equity from $2k of loan paydown is wiped out by about $3k of value loss. Plan a longer hold.
- Polk County population projected at +33% by 2050 — long-run rental-demand tailwind backs the buy-and-hold thesis.
Negotiation context
- It's been on market 129 days — a 12% lower offer ($202k) is reasonable based on typical stale-listing flexibility.
- 3 sale attempts since 16y ago; this cycle's ask has dropped $19k (8%) from the opening price — seller is motivated, your offer sets the floor, not the list.
- Current owner paid $73k; list at $230k implies a 215% gain — meaningful room to come down on a strong offer.
Risks & watch-outs
- Climate carrying-cost: severe wind risk, 99% chance of damaging wind over 30y; moderate wildfire risk; extreme-heat days projected 7→25/yr by 2055 (HVAC capex compounding) — expect insurance premiums to compound above CPI over the hold.
Questions for the listing agent
- What do current leases actually rent for vs. the listed asking? Can we see a recent rent roll and the last 12 months of T-12 income?
- It's been on market 129 days. Have you received any prior offers? Is the seller open to a 17% concession, seller financing, or rate buy-down credit?
- What does the HOA fee cover, when was the last increase, and are there any pending special assessments or reserve-fund shortfalls?
- Why hasn't it sold? Are there any deal-killer items the seller is aware of (foundation, flood, title, zoning, code violations)?
- Is there a deadline driving the sale (1031 exchange, divorce, estate, relocation)? That informs how much negotiation room exists.
- Schools are F-rated, which usually means shorter tenancies and higher turnover. Who's the typical renter profile here, and what's been the actual vacancy rate?
- The area grade is low — what's the realistic commute time and amenity access for the typical tenant pool here? Any planned neighborhood developments (good or bad) we should know about?
- What's the average days-on-market for RENTAL listings here right now (not sales)? A rising rental-DOM trend means longer vacancies and softer asking-rent achievability than the comps imply.
- What's the recent tenant-quality profile in this submarket — average credit score on applications, eviction rate, late-payment / NSF rate, and stable-employment percentage? A property-management company in the area should have these aggregated.
- How much new for-sale + rental construction is in the pipeline within 1–3 miles? Heavy new supply typically softens prices + rents 12–24 months out; constrained supply supports both.
Investment metrics
- 1% rule
- 0.83% ✗
- Cap rate
- 5.60%
- Cash-on-cash
- -2.48%
- DSCR
- 0.89
- GRM
- 10.0
CMA / ARV
No comps found within radius.
Projected returns pro-forma
-1.48% appreciation · 1.14% rent growth · sell at horizon
- IRR
- -13.1%
- Equity multiple
- 0.47×
- Total profit
- $-34,172
- Equity at exit
- $50,283
- IRR
- -8.0%
- Equity multiple
- 0.37×
- Total profit
- $-40,556
- Equity at exit
- $48,459
Cash invested: $64,400 (down + closing). Projections, not guarantees.
Landlord ↔ Tenant lean methodology
- Overall (STATE)
- 87 Strongly Landlord-Friendly
- State Florida
- 87 Strongly Landlord-Friendly · R+3
- County
- — inherits STATE
- City
- — inherits STATE
ZIP-level market 34759
- Home prices YoY
- -0.5%
- Rents YoY
- 1.1%
- Active inventory
- 1151
- Price-to-rent
- 10.0×
Monthly cashflow live
- Estimated rent
- $1,916 high interval (Pro) →
- Mortgage (P&I)
- −$1,206
- Tax from tax record
- −$245 /mo · $2,940/yr
- Insurance
- −$96
- HOA
- −$100
- Vacancy / Maint / Mgmt
- −$402
- Net cashflow
- $-133
Break-even live
UW: 25.0% down · 7.5% · 30yr · 1.5% tax · 5.0% vac · 8.0% maint · 8.0% mgmt
Financing live
Cash to close
- Down payment
- $57,500
- Closing costs
- $6,900
- Reserves months
- —
- Total cash needed
- —
Loan-product check · same deal, 3 products live
Conventional
25% down · 7.5% · 30yr
- Down + closing
- —
- Monthly P&I
- —
- Monthly cashflow
- —
- DSCR
- —
- Eligible?
- —
Personal DTI + credit; lowest rate.
DSCR
20% down · 8.5% · 30yr
- Down + closing
- —
- Monthly P&I
- —
- Monthly cashflow
- —
- DSCR
- —
- Eligible?
- —
No personal income docs; deal must DSCR.
Hard money
10% down · 12.0% · 12mo
- Down + closing
- —
- Monthly P&I
- —
- Monthly cashflow
- —
- DSCR
- —
- Eligible?
- —
Short-term bridge; refi at stabilization.
Rent comps 40 comps
| Address | Beds | Baths | Sqft | Rent | $/sqft | DOM | Units | Dist |
|---|---|---|---|---|---|---|---|---|
| 1637 Sail Dr Kissimmee, FL | 3.0 | 2.0 | 1250 | $1,720 | $1.38 | 3d | 1 | 0.12mi |
| 116 Sail Way Kissimmee, FL | 4.0 | 2.0 | 1661 | $1,805 | $1.09 | 11d | 1 | 0.16mi |
| 1613 Sail Dr Kissimmee, FL | 3.0 | 2.0 | 1711 | $1,625 | $0.95 | 23d | 1 | 0.20mi |
| 10 Trout Way Unit A Kissimmee, FL | 3.0 | 2.0 | 1162 | $1,750 | $1.51 | 23d | 1 | 0.22mi |
| 10 Trout Way Unit B Poinciana, FL | 3.0 | 2.0 | 1162 | $1,749 | $1.51 | 21d | 1 | 0.22mi |
| 12 Trout Way Unit A Kissimmee, FL | 3.0 | 2.0 | 1162 | $1,750 | $1.51 | 21d | 1 | 0.23mi |
| 12 Trout Way Unit B Kissimmee, FL | 3.0 | 2.0 | 1162 | $1,750 | $1.51 | 23d | 1 | 0.23mi |
| 1707 Sail Ct Kissimmee, FL | 4.0 | 2.5 | 1823 | $2,015 | $1.11 | 3d | 1 | 0.23mi |
| 21 Trout Way Unit A Poinciana, FL | 3.0 | 2.0 | 1162 | $1,750 | $1.51 | 23d | 1 | 0.24mi |
| 16 Trout Way Kissimmee, FL | 3.0 | 2.0 | 1304 | $1,775 | $1.36 | 3d | 1 | 0.25mi |
| 1658 Redfin Dr Kissimmee, FL | 4.0 | 2.0 | 1661 | $1,810 | $1.09 | 3d | 1 | 0.40mi |
| 1660 Redfin Dr Kissimmee, FL | 4.0 | 2.0 | 1661 | $1,975 | $1.19 | 3d | 1 | 0.40mi |
| 1662 Redfin Dr Kissimmee, FL | 4.0 | 2.5 | 1852 | $1,940 | $1.05 | 23d | 1 | 0.40mi |
| 12 Herring Ct Kissimmee, FL | 3.0 | 2.0 | 1055 | $1,613 | $1.53 | 23d | 1 | 0.43mi |
| 104 Herring Ln Kissimmee, FL | 4.0 | 2.0 | 1699 | $1,925 | $1.13 | 3d | 1 | 0.52mi |
| 106 Herring Ln Kissimmee, FL | 3.0 | 2.0 | 1062 | $1,575 | $1.48 | 2d | 1 | 0.52mi |
| 1701 Pilchard Dr Kissimmee, FL | 4.0 | 2.0 | 1720 | $2,050 | $1.19 | 23d | 1 | 0.59mi |
| 202 Snapper Way Kissimmee, FL | 4.0 | 2.0 | 1670 | $2,050 | $1.23 | 3d | 1 | 0.59mi |
| 1731 Minnow Ct Kissimmee, FL | 3.0 | 2.0 | 1209 | $1,750 | $1.45 | 23d | 1 | 0.60mi |
| 5 Flatfish Dr Kissimmee, FL | 4.0 | 2.0 | 1650 | $2,150 | $1.30 | 23d | 1 | 0.63mi |
| 241 Grouper Ct Kissimmee, FL | 4.0 | 2.0 | 1762 | $2,000 | $1.14 | 23d | 1 | 0.64mi |
| 1884 Snapper Dr Kissimmee, FL | 4.0 | 2.0 | 1682 | $1,985 | $1.18 | 14d | 1 | 0.65mi |
| 8 Flatfish Dr Kissimmee, FL | 3.0 | 2.0 | 1392 | $1,650 | $1.19 | 3d | 1 | 0.65mi |
| 223 Grouper Ct Kissimmee, FL | 3.0 | 2.0 | 1475 | $1,595 | $1.08 | 23d | 1 | 0.68mi |
| 260 Grouper Ct Kissimmee, FL | 2.0 | 2.0 | 1130 | $1,400 | $1.24 | 2d | 1 | 0.74mi |
| 205 Dogfish Ln Kissimmee, FL | 4.0 | 2.0 | 1578 | $1,680 | $1.06 | 13d | 1 | 0.80mi |
| 149 Conch Dr Kissimmee, FL | 3.0 | 2.0 | 1578 | $1,700 | $1.08 | 19d | 1 | 0.95mi |
| 310 Dogfish Way Kissimmee, FL | 4.0 | 2.0 | 1700 | $1,950 | $1.15 | 23d | 1 | 0.98mi |
| 321 Drum Ln Poinciana, FL | 3.0 | 2.0 | 1785 | $1,715 | $0.96 | 19d | 1 | 0.98mi |
| 320 Kingfish Dr Kissimmee, FL | 3.0 | 3.0 | 1606 | $1,795 | $1.12 | 23d | 1 | 0.99mi |
| 308 Bass Ct Kissimmee, FL | 3.0 | 2.0 | 1613 | $1,850 | $1.15 | 23d | 1 | 1.04mi |
| 308 Bass Ct Kissimmee, FL | 4.0 | 2.0 | 1614 | $2,100 | $1.30 | 3d | 1 | 1.04mi |
| 352 Kingfish Dr Kissimmee, FL | 4.0 | 2.0 | 1670 | $1,950 | $1.17 | 23d | 1 | 1.07mi |
| 1405 Teal Ct Poinciana, FL | 4.0 | 2.0 | 1605 | $1,700 | $1.06 | 23d | 1 | 1.11mi |
| 313 Amberjack Ct Kissimmee, FL | 3.0 | 2.0 | 1243 | $1,750 | $1.41 | 23d | 1 | 1.14mi |
| 307 Michigan Ln Kissimmee, FL | 4.0 | 2.0 | 1673 | $1,744 | $1.04 | 13d | 1 | 1.17mi |
| 1406 Orlando Pl Poinciana, FL | 3.0 | 2.0 | 1257 | $1,450 | $1.15 | 3d | 1 | 1.18mi |
| 1907 Manatee Dr Kissimmee, FL | 4.0 | 2.0 | 1803 | $1,795 | $1.00 | 23d | 1 | 1.22mi |
| 1912 Manatee Dr Kissimmee, FL | 4.0 | 2.5 | 1420 | $1,995 | $1.40 | 23d | 1 | 1.26mi |
| 1951 Michigan Dr Kissimmee, FL | 4.0 | 2.0 | 1562 | $2,060 | $1.32 | 13d | 1 | 1.28mi |
HOA detail
- Monthly dues
- $100 · $1,200/yr
Listing history 21 events
-
2026-06-18days on market $230,000 Active 129 DOM
-
2026-06-17days on market $230,000 Active 128 DOM
-
2026-06-16days on market $230,000 Active 127 DOM
-
2026-06-15days on market $230,000 Active 126 DOM
-
2026-06-13days on market $230,000 Active 124 DOM
-
2026-06-10days on market $230,000 Active 121 DOM
-
2026-06-09days on market $230,000 Active 120 DOM
-
2026-06-08pricedays on market $230,000 Active 119 DOM
-
2026-06-07days on market $249,000 Active 118 DOM
-
2026-06-05days on market $249,000 Active 115 DOM
-
2026-06-03days on market $249,000 Active 113 DOM
-
2026-06-01days on market $249,000 Active 112 DOM
-
2026-05-31days on market $249,000 Active 111 DOM
-
2026-02-09$249,000 Active
-
2011-08-02soldstatus $73,000
-
2011-07-26soldstatus $73,000 364-char remark
Show marketing remark (364 chars)
NOT A SHORT SALE. 3/2 block home. Split plan, large eat-in kitchen. Selling as is with right to inspect. Contact listing agent for more information. NEW KITCHEN, NEW COUNTER TOP, NEW STAINLESS STEEL APPLIANCES, FRESHLY PAINTED. Selling as is with right to inspect. Purchase this property for as little as 3% down! Please contact listing agent for more information.
-
2011-02-02$74,900 364-char remark
Show marketing remark (364 chars)
NOT A SHORT SALE. 3/2 block home. Split plan, large eat-in kitchen. Selling as is with right to inspect. Contact listing agent for more information. NEW KITCHEN, NEW COUNTER TOP, NEW STAINLESS STEEL APPLIANCES, FRESHLY PAINTED. Selling as is with right to inspect. Purchase this property for as little as 3% down! Please contact listing agent for more information.
-
2010-07-09soldstatus $60,000 452-char remark
Show marketing remark (452 chars)
NOT A SHORT SALE. 3/2 block home. Split plan, large eat-in kitchen. Selling as is with right to inspect. Up to 3.5% closing costs paid if closed by 6/30/10. See attachments or contact listing agent for more information. Selling as is with right to inspect. Purchase this property for as little as 3% down! This property is approved for HomePath Mortgage & HomePath Renovation Mortgage Financing. Please contact listing agent for more information.
-
2010-05-14$59,360 452-char remark
Show marketing remark (452 chars)
NOT A SHORT SALE. 3/2 block home. Split plan, large eat-in kitchen. Selling as is with right to inspect. Up to 3.5% closing costs paid if closed by 6/30/10. See attachments or contact listing agent for more information. Selling as is with right to inspect. Purchase this property for as little as 3% down! This property is approved for HomePath Mortgage & HomePath Renovation Mortgage Financing. Please contact listing agent for more information.
-
2006-08-01soldstatus $175,000
-
2005-07-19soldstatus $145,000
ⓘ Source: listings_history table (triggers on properties + properties_extension) + one-shot
backfill from property_details.listing_events for pre-trigger history.
Tax reassessment forecast FL · Resets to sale price
- Current annual tax
- $2,940 · $245/mo
- Projected year-2 tax
- $2,940 · $245/mo
- Expected delta
- $0/yr ($0/mo · 0.0%)
ⓘ Screening estimate from a state-policy table — verify with the county assessor before closing.
Climate risk First Street
- Flood 1/10 Low FEMA zone X (unshaded) · 0% chance over 30 yrs
- Wildfire 5/10 Major
- Heat 9/10 Extreme 7 d/yr ≥108°F today · 25 d/yr by 30 yrs out
- Wind 9/10 Extreme 99% chance of damaging wind over 30 yrs
- Air quality 1/10 Low 0 unhealthy d/yr today · 0 by 30 yrs out
Nearby sold comps map
Loading sold comps map…
Walkable amenities ~0.75 mi
Loading nearby amenities…
Taxation est. · year 1
- Rental income
- $22,997
- − Mortgage interest
- −$12,884
- − Property taxes
- −$2,940
- − Insurance
- −$1,150
- − Repairs & maintenance
- −$1,840
- − Management
- −$1,840
- − HOA
- −$1,200
- − Depreciation
- −$6,691
- Taxable loss
- −$5,548
- Est. tax savings @ 24.0%
- +$1,331
- After-tax cash flow
- $-265/yr
For passive investors: Depreciation is non-cash, so a rental often shows a tax loss while cash-flowing — sheltering income. Rental losses are passive: they offset passive income freely, and up to $25,000/yr can offset ordinary (W-2) income if you actively participate and your MAGI is under $100k (phasing out to $0 by $150k); unused losses carry forward. On sale, claimed depreciation is recaptured at up to 25%, and gains may owe capital-gains tax (a 1031 exchange can defer both). Figures are a year-1 estimate at your 24.0% rate — not tax advice; consult a CPA.
Schools (NCES district)
- District
- Polk
- NCES district ID
- 1201590
- Math proficiency
- 39% ▼ -11.00%
- Reading proficiency
- 43% ▼ -4.00%
- Median HH income
- $43,979
- Composite
- 34.74/100
- National rank
- #5132
- State rank
- #62 of 73 in FL
Livability — Poinciana
- Score
- 57/100
- State rank
- #859
- US rank
- #21760
Category grades
Schools grade is shown separately in the Schools card above.
Census & demographics
- Census place
- Poinciana, FL
- County
- Polk County · 740,051 people
- City population
- 91,336
- Metro
- Lakeland-Winter Haven, FL
- Population (ZIP)
- 44,568
- Household income
- $69,373
- Rent vs Own
- Severe rent burden
- 1186.0
Population outlook (Polk County) Hauer SSP2
- Today (2025)
- 752,975 people
- By 2030
- 804,621 · +6.9%
- By 2040
- 906,117 · +20.3%
- By 2050
- 1,000,476 · +32.9%
- By 2075
- 1,197,520 · +59.0%
- By 2100
- 1,271,518 · +68.9%
Race, ethnicity, and origin ACS 2023
- Neighborhood character
- Diverse neighborhood (Simpson 0.62)
- Race & ethnicity
- Hispanic / Latino 55% White 21% Two or more races 20% Black 19%
- Hispanic origin (detail)
- Mexican 2% Puerto Rican 38% Cuban 6% Dominican 3%
- Common ancestry
- Hispanic 3% Romanian 2% Scotch-Irish 1%
- Foreign-born
- 17% · Canada, Jamaica
- Languages at home
- 49% English-only · Spanish 48% French/Haitian/Cajun 2%
Political lean MEDSL · Polk
- 2024 margin
- Strong R (+20.7) · D 39.2% · R 59.9%
- 2008→2024 swing
- -14.6pp toward R · 2008: -6.1pp · 2024: -20.7pp
- All cycles
- 2024: R+20.7 2020: R+14.4 2016: R+14.1 2012: R+6.8 2008: R+6.1
Not yet ingested
- Civics
- —
Market trends
- HPI YoY
- ▼ -1.48%
- Current HPI
- 276.6861
- Rent YoY
- ▲ 1.14%
- Metro
- Lakeland-Winter Haven, FL
- State GDP YoY
- ▲ 3.28%
- F500 in state
- 36
Industry mix (Fortune 500 HQ in FL)
| Industry | F500 HQs | Revenue |
|---|---|---|
| Industrial Technology | 2 | $29B |
|
||
| Insurance | 2 | $17B |
|
||
| Retail | 1 | $60B |
|
||
| Technology Distribution | 1 | $58B |
|
||
| Homebuilding | 1 | $35B |
|
||
| Technology Manufacturing | 1 | $35B |
|
||
Price history
+71.7% since first listed8 events — show timeline
- 2026-02-09 Listed $249,000 Stellar MLS as Distributed by MLS Grid
- 2011-08-02 Sold (Public Records) $73,000 Public Records
- 2011-07-26 Sold (MLS) $73,000 Stellar MLS as Distributed by MLS Grid
- 2011-02-02 Listed $74,900 Stellar MLS as Distributed by MLS Grid
- 2010-07-09 Sold (MLS) $60,000 Stellar MLS as Distributed by MLS Grid
- 2010-05-14 Listed $59,360 Stellar MLS as Distributed by MLS Grid
- 2006-08-01 Sold (Public Records) $175,000 Public Records
- 2005-07-19 Sold (Public Records) $145,000 Public Records
Property tax history
+11.8%/yrLatest (2025): $2,940 · +7.0% YoY. Source: county tax records.
Cash-flow waterfall
monthlySold comps — $/sqft
last 12 mo · ≤1 miLoading sold comps…