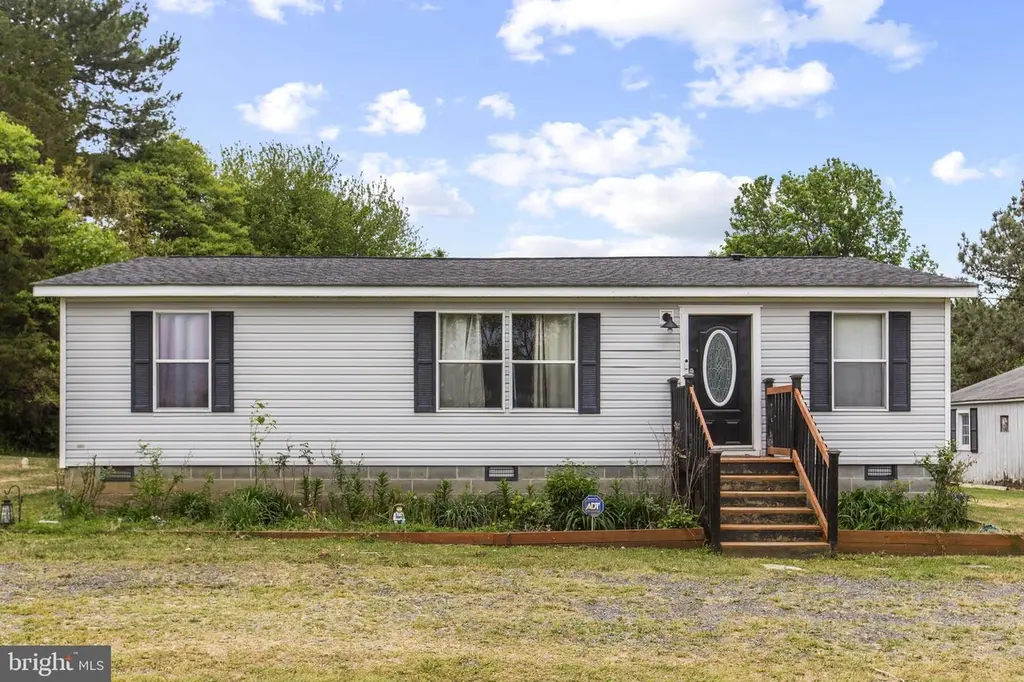
154 Worrell Ln · Colonial Beach, VA
Flood risk 1/10 · Minimal
- FEMA flood zone
- X (unshaded)
- Chance of flooding over 30 yrs
- 0.0%
- Est. flood insurance / yr
- $507 – $1,088
Fire risk 5/10 · Moderate
- Est. fire insurance / yr
- $666 – $1,236
Heat risk 8/10 · Major
- Hot days now (above 107°F)
- 7 days/yr
- Hot days in 30 yrs
- 16 days/yr
Wind risk 6/10 · Moderate
- Chance of severe wind over 30 yrs
- 27.0%
Air-quality risk 2/10 · Minimal
- Unhealthy air days now
- 2 days/yr
- Unhealthy air days in 30 yrs
- 2 days/yr
Risk factors via First Street. Map © Google.
Why this score? — see what drove the C- grade
The composite is a weighted blend of 9 inputs, each scored 0–100. Each bar is that input's sub-score; the figure is the points it added to the 100-point composite (weight × sub-score).
- Cash flow +16.7/30.0
- ARV discount +14.1/15.0
- DSCR +5.2/10.0
- Schools +4.0/10.0
- 1% rule +3.4/10.0
- Livability +3.0/5.0
- Rent growth +2.5/5.0
- Condition / age +2.5/5.0
- Appreciation +0.0/10.0
$239,500
🖨 Deal sheet 📄 Offer letter ✓ Due diligence
Listing remarks MLS
Please call LA or schedule showing through MRIS to get combo code. Thanks.
Key facts
- Wood flooring
- Wooden cabinets
- Tile flooring
Tags
Property features AI
Exterior
- Parking: Detached private garage with two spaces; Garage door opener
- Utilities: Public water; Public sewer; Electric service available
- Home design: Manufactured home; Single-story entry (main-level living implied)
- Construction: Built using block, frame, modular/manufactured components and vinyl siding; Block foundation with crawl space; Pitched shingle roof; Above-grade living area only (no below-grade area)
- Exterior features: Lot with other/unspecified features; No tidal water on the property; Pets allowed with no restrictions
Interior
- Kitchen: Microwave; Electric oven/range; Refrigerator
- Bedrooms: Three bedrooms on the main level
- Flooring: Carpet; Wood
- Bathrooms: Two full bathrooms (main level)
- Heating & cooling: Ceiling fan cooling; Other heating and hot water systems
- Interior features: Ceiling fans; Carpeted areas
- Laundry & utility: Main-floor laundry
Neighborhood map
What this means for you Summary
Snapshot
- This is a 3-bed/2.0-bath single-family listed at $240k.
Deal economics
- At list price, monthly cash flow is $147 ($2k/yr) — positive.
- The deal already cash-flows at list — no discount required.
- To meet the 1% rule (rent ≥ 1% of price), the offer needs to be $202k (15.6% below list).
- Recommended offer: $202k (15.6% below list) — sets the bar for 1% rule.
- Cap rate 7.0% vs local median 4.4% in Colonial Beach — top-decile yield for the area; either an underpriced asset or a hidden risk that comps aren't pricing in. Stress-test before assuming the spread holds.
Location & tenants
- Location reads 59/100 on livability (#460 in VA) — a working-class tenant base; expect higher turnover. Strengths: crime B, cost of living B; Watch: amenities F, commute F, health & safety F.
- Westmoreland County Public School District (rural): math 34% / reading 59% proficiency, ranked #105 of 131 in VA (top 80%) — families likely to look elsewhere, expect single-tenant / working-renter base with shorter leases; 64% free/reduced lunch — lower-income household profile, screen leases tightly.
- Zoned schools: Montross Middle (math 38% / reading 58%, grade C-, #247 of 342 statewide, top 74%, 309 students, 101% FRL) — zoned schools average 101% FRL vs 64% district-wide (36 pts higher); higher-poverty schools than district average — tighter screening recommended.
- Market conditions: 197 active listings in the ZIP; 220 units permitted in Westmoreland County in 2024 (0 in 5+ unit buildings).
- This rent runs 37% of the median local income ($65k/yr) — at the standard rent-burdened threshold; future hikes will face affordability resistance.
Forward outlook
- Local home prices are declining (-3.0%/yr); year-one equity from $2k of loan paydown is wiped out by about $7k of value loss. Plan a longer hold.
- Westmoreland County population projected to shrink 7% by 2050 — rents likely to lag national; underwrite the cash flow, not the appreciation.
Negotiation context
- It's been on market 55 days — a 3% lower offer ($232k) is reasonable based on typical stale-listing flexibility.
- 8 sale attempts since 16y ago; this cycle's ask has dropped $40k (14%) from the opening price — seller is motivated, your offer sets the floor, not the list.
- Current owner paid $148k; list at $240k implies a 62% gain — meaningful room to come down on a strong offer.
Risks & watch-outs
- Climate carrying-cost: major wind risk, 27% chance of damaging wind over 30y; moderate wildfire risk; extreme-heat days projected 7→16/yr by 2055 (HVAC capex compounding) — expect insurance premiums to compound above CPI over the hold.
Questions for the listing agent
- It's been on market 55 days. Have you received any prior offers? Is the seller open to a 16% concession, seller financing, or rate buy-down credit?
- Is there a deadline driving the sale (1031 exchange, divorce, estate, relocation)? That informs how much negotiation room exists.
- Schools are B-rated — typically a magnet for longer-tenancy family renters. What's the average tenant stay here, and is there a school-zone premium baked into asking?
- What's the average days-on-market for RENTAL listings here right now (not sales)? A rising rental-DOM trend means longer vacancies and softer asking-rent achievability than the comps imply.
- What's the recent tenant-quality profile in this submarket — average credit score on applications, eviction rate, late-payment / NSF rate, and stable-employment percentage? A property-management company in the area should have these aggregated.
- How much new for-sale + rental construction is in the pipeline within 1–3 miles? Heavy new supply typically softens prices + rents 12–24 months out; constrained supply supports both.
Investment metrics
- 1% rule
- 0.84% ✗
- Cap rate
- 7.03%
- Cash-on-cash
- 2.63%
- DSCR
- 1.12
- GRM
- 9.9
CMA / ARV
- ARV (median comp)
- $280,538
- List price
- $239,500
- Delta
- -14.63%
- Verdict
- UNDERPRICED
- Comps
- 1 within 2.0 mi
Projected returns pro-forma
-3.0% appreciation · 3.0% rent growth · sell at horizon
- IRR
- -12.2%
- Equity multiple
- 0.56×
- Total profit
- $-29,549
- Equity at exit
- $35,710
- IRR
- -3.1%
- Equity multiple
- 0.79×
- Total profit
- $-14,071
- Equity at exit
- $20,708
Cash invested: $67,060 (down + closing). Projections, not guarantees.
Landlord ↔ Tenant lean methodology
- Overall (STATE)
- 55 Moderately Landlord-Leaning
- State Virginia
- 55 Moderately Landlord-Leaning · D+2
- County
- — inherits STATE
- City
- — inherits STATE
ZIP-level market 22443
- Active inventory
- 197
- Price-to-rent
- 9.9×
Monthly cashflow live
- Estimated rent
- $2,022 medium interval (Pro) →
- Mortgage (P&I)
- −$1,256
- Tax from tax record
- −$95 /mo · $1,139/yr
- Insurance
- −$100
- HOA
- −$0
- Vacancy / Maint / Mgmt
- −$425
- Net cashflow
- $147
Break-even live
UW: 25.0% down · 7.5% · 30yr · 1.5% tax · 5.0% vac · 8.0% maint · 8.0% mgmt
Financing live
Cash to close
- Down payment
- $59,875
- Closing costs
- $7,185
- Reserves months
- —
- Total cash needed
- —
Loan-product check · same deal, 3 products live
Conventional
25% down · 7.5% · 30yr
- Down + closing
- —
- Monthly P&I
- —
- Monthly cashflow
- —
- DSCR
- —
- Eligible?
- —
Personal DTI + credit; lowest rate.
DSCR
20% down · 8.5% · 30yr
- Down + closing
- —
- Monthly P&I
- —
- Monthly cashflow
- —
- DSCR
- —
- Eligible?
- —
No personal income docs; deal must DSCR.
Hard money
10% down · 12.0% · 12mo
- Down + closing
- —
- Monthly P&I
- —
- Monthly cashflow
- —
- DSCR
- —
- Eligible?
- —
Short-term bridge; refi at stabilization.
Listing history 39 events
-
2026-06-18days on market $239,500 Active 55 DOM
-
2026-06-17days on market $239,500 Active 54 DOM
-
2026-06-16days on market $239,500 Active 53 DOM
-
2026-06-15days on market $239,500 Active 52 DOM
-
2026-06-14days on market $239,500 Active 50 DOM
-
2026-06-13days on market $239,500 Active 49 DOM
-
2026-06-10days on market $239,500 Active 47 DOM
-
2026-06-09days on market $239,500 Active 46 DOM
-
2026-06-09price $239,500 Active 45 DOM
-
2026-06-08days on market $249,500 Active 45 DOM
-
2026-06-07days on market $249,500 Active 44 DOM
-
2026-06-03days on market $249,500 Active 40 DOM
-
2026-06-02days on market $249,500 Active 39 DOM
-
2026-06-01days on market $249,500 Active 38 DOM
-
2026-05-31days on market $249,500 Active 37 DOM
-
2026-05-31days on market $249,500 Active 36 DOM
-
2026-05-13price $258,900 812-char remark
-
2026-05-05price $268,900 812-char remark
-
2026-04-30price $278,900 812-char remark
-
2026-04-24$279,000 Active 812-char remark
-
2014-11-05soldstatus $147,500
-
2014-11-04historical 74-char remark
Show marketing remark (74 chars)
Please call LA or schedule showing through MRIS to get combo code. Thanks.
-
2014-11-03soldstatus $147,500 Sold 74-char remark
Show marketing remark (74 chars)
Please call LA or schedule showing through MRIS to get combo code. Thanks.
-
2014-11-03soldstatus $147,500
Show marketing remark (74 chars)
Please call LA or schedule showing through MRIS to get combo code. Thanks.
-
2014-09-26status Contract 74-char remark
Show marketing remark (74 chars)
Please call LA or schedule showing through MRIS to get combo code. Thanks.
-
2014-09-25historical
Show marketing remark (74 chars)
Please call LA or schedule showing through MRIS to get combo code. Thanks.
-
2014-09-04status Active 74-char remark
Show marketing remark (74 chars)
Please call LA or schedule showing through MRIS to get combo code. Thanks.
-
2014-08-09status Contract 74-char remark
Show marketing remark (74 chars)
Please call LA or schedule showing through MRIS to get combo code. Thanks.
-
2014-07-29$149,900 Active 74-char remark
Show marketing remark (74 chars)
Please call LA or schedule showing through MRIS to get combo code. Thanks.
-
2014-07-29$149,900
Show marketing remark (74 chars)
Please call LA or schedule showing through MRIS to get combo code. Thanks.
-
2011-01-27historical Expired
-
2011-01-27historical
-
2010-11-02Active
-
2010-11-01$179,900
-
2010-09-20historical Expired
-
2010-09-20historical
-
2010-06-19Active
-
2010-06-19$179,900
-
2006-01-31soldstatus $155,000
ⓘ Source: listings_history table (triggers on properties + properties_extension) + one-shot
backfill from property_details.listing_events for pre-trigger history.
Tax reassessment forecast VA · Resets to sale price
- Current annual tax
- $1,139 · $95/mo
- Projected year-2 tax
- $1,964 · $164/mo
- Expected delta
- +$825/yr (+$69/mo · 72.4%)
ⓘ Screening estimate from a state-policy table — verify with the county assessor before closing.
Climate risk First Street
- Flood 1/10 Low FEMA zone X (unshaded) · 0% chance over 30 yrs
- Wildfire 5/10 Major
- Heat 8/10 Severe 7 d/yr ≥107°F today · 16 d/yr by 30 yrs out
- Wind 6/10 Major 27% chance of damaging wind over 30 yrs
- Air quality 2/10 Low 2 unhealthy d/yr today · 2 by 30 yrs out
Nearby sold comps map
Loading sold comps map…
Walkable amenities ~0.75 mi
Loading nearby amenities…
Taxation est. · year 1
- Rental income
- $24,267
- − Mortgage interest
- −$13,416
- − Property taxes
- −$1,139
- − Insurance
- −$1,198
- − Repairs & maintenance
- −$1,941
- − Management
- −$1,941
- − Depreciation
- −$6,967
- Taxable loss
- −$2,335
- Est. tax savings @ 24.0%
- +$561
- After-tax cash flow
- $2,323/yr
For passive investors: Depreciation is non-cash, so a rental often shows a tax loss while cash-flowing — sheltering income. Rental losses are passive: they offset passive income freely, and up to $25,000/yr can offset ordinary (W-2) income if you actively participate and your MAGI is under $100k (phasing out to $0 by $150k); unused losses carry forward. On sale, claimed depreciation is recaptured at up to 25%, and gains may owe capital-gains tax (a 1031 exchange can defer both). Figures are a year-1 estimate at your 24.0% rate — not tax advice; consult a CPA.
Schools (NCES district)
- District
- Westmoreland County Public School District
- NCES district ID
- 5103980
- Math proficiency
- 34% ▼ -47.00%
- Reading proficiency
- 59% ▼ -11.00%
- Median HH income
- $51,665
- Composite
- 39.94/100
- National rank
- #3845
- State rank
- #105 of 131 in VA
Livability — Colonial Beach
- Score
- 59/100
- State rank
- #460
- US rank
- #19615
Category grades
Schools grade is shown separately in the Schools card above.
Census & demographics
- County
- Westmoreland County · 10,011 people
- City population
- 10,011
- Metro
- nan
- Population (ZIP)
- 10,011
- Household income
- $64,810
- Rent vs Own
- Severe rent burden
- 126.0
Population outlook (Westmoreland County) Hauer SSP2
- Today (2025)
- 17,643 people
- By 2030
- 17,520 · -0.7%
- By 2040
- 17,041 · -3.4%
- By 2050
- 16,397 · -7.1%
- By 2075
- 15,012 · -14.9%
- By 2100
- 12,917 · -26.8%
Race, ethnicity, and origin ACS 2023
- Neighborhood character
- Predominantly White (71%)
- Race & ethnicity
- White 71% Black 15% Two or more races 7% Hispanic / Latino 6% Asian 2%
- Hispanic origin (detail)
- Mexican 5%
- Common ancestry
- Slovak 2% Italian 2% Scotch-Irish 1%
- Foreign-born
- 3% · Canada
- Languages at home
- 96% English-only · Spanish 3%
Political lean MEDSL · Westmoreland
- 2024 margin
- R (+14.3) · D 42.4% · R 56.7%
- 2008→2024 swing
- -24.5pp toward R · 2008: 10.2pp · 2024: -14.3pp
- All cycles
- 2024: R+14.3 2020: R+8.2 2016: R+7.3 2012: D+0.5 2008: D+10.2
Not yet ingested
- Civics
- —
Market trends
- HPI YoY
- ▼ -127.23%
- Current HPI
- 152.1518
- Rent YoY
- —
- Metro
- nan
- State GDP YoY
- ▲ 2.40%
- F500 in state
- 50
Industry mix (Fortune 500 HQ in VA)
| Industry | F500 HQs | Revenue |
|---|---|---|
| Aerospace / Defense | 4 | $236B |
|
||
| Technology / Defense | 3 | $32B |
|
||
| Financial Services | 2 | $176B |
|
||
| Utilities | 2 | $27B |
|
||
| Insurance | 2 | $25B |
|
||
| Technology | 2 | $15B |
|
||
Price history
+54.5% since first listed26 events — show timeline
- 2026-06-09 Price Changed $239,500 BRIGHT MLS
- 2026-05-29 Price Changed $249,500 BRIGHT MLS
- 2026-05-21 Price Changed $257,900 BRIGHT MLS
- 2026-05-13 Price Changed $258,900 BRIGHT MLS
- 2026-05-05 Price Changed $268,900 BRIGHT MLS
- 2026-04-30 Price Changed $278,900 BRIGHT MLS
- 2026-04-24 Listed $279,000 BRIGHT MLS
- 2014-11-05 Sold (Public Records) $147,500 Public Records
- 2014-11-04 Delisted — MRIS
- 2014-11-03 Sold (MLS) $147,500 BRIGHT MLS
- 2014-11-03 Sold (MLS) $147,500 MRIS
- 2014-09-26 Pending — MRIS
- 2014-09-25 Listing Removed — BRIGHT MLS
- 2014-09-04 Relisted — MRIS
- 2014-08-09 Pending — MRIS
- 2014-07-29 Listed $149,900 MRIS
- 2014-07-29 Listed $149,900 BRIGHT MLS
- 2011-01-27 Delisted — MRIS
- 2011-01-27 Listing Removed — BRIGHT MLS
- 2010-11-02 Listed — MRIS
- 2010-11-01 Listed $179,900 BRIGHT MLS
- 2010-09-20 Delisted — MRIS
- 2010-09-20 Listing Removed — BRIGHT MLS
- 2010-06-19 Listed — MRIS
- 2010-06-19 Listed $179,900 BRIGHT MLS
- 2006-01-31 Sold (Public Records) $155,000 Public Records
Property tax history
+8.5%/yrLatest (2025): $1,139 · +0.0% YoY. Source: county tax records.
Cash-flow waterfall
monthlySold comps — $/sqft
last 12 mo · ≤1 miLoading sold comps…