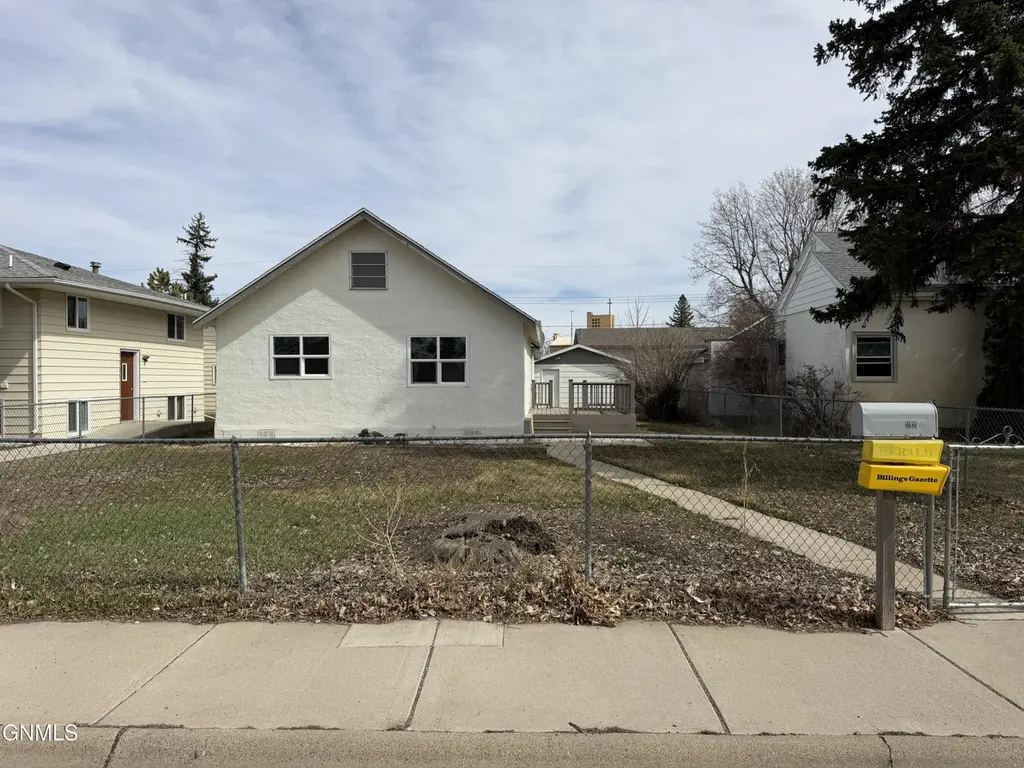
220 7th Ave SW · Sidney, MT
Flood risk 1/10 · Minimal
- FEMA flood zone
- X (unshaded)
- Chance of flooding over 30 yrs
- 0.0%
- Est. flood insurance / yr
- $507 – $1,088
Fire risk 3/10 · Minor
- Est. fire insurance / yr
- $918 – $1,706
Heat risk 3/10 · Minor
- Hot days now (above 98°F)
- 7 days/yr
- Hot days in 30 yrs
- 13 days/yr
Wind risk 1/10 · Minimal
- Chance of severe wind over 30 yrs
- —
Air-quality risk 3/10 · Minor
- Unhealthy air days now
- 2 days/yr
- Unhealthy air days in 30 yrs
- 2 days/yr
Risk factors via First Street. Map © Google.
Why this score? — see what drove the D- grade
The composite is a weighted blend of 9 inputs, each scored 0–100. Each bar is that input's sub-score; the figure is the points it added to the 100-point composite (weight × sub-score).
- Cash flow +15.9/30.0
- DSCR +4.9/10.0
- 1% rule +4.7/10.0
- Livability +3.7/5.0
- Schools +3.6/10.0
- Rent growth +2.5/5.0
- Condition / age +2.5/5.0
- ARV discount +2.1/15.0
- Appreciation +0.0/10.0
$138,000
🖨 Deal sheet 📄 Offer letter ✓ Due diligence
Key facts
- 7,000 sq ft lot
- 2 garage spots
- Built 1922
Property features AI
Exterior
- Parking: Detached rear-facing garage with 2 spaces
- Utilities: Public water; Public sewer
- Home design: Single family residence; Residential property
- Construction: Stucco construction; Slab foundation; Built area above grade: 1,710 finished
- Exterior features: Chain link full fencing; No additional exterior features listed
Interior
- Kitchen: Electric range; Oven; Refrigerator
- Bathrooms: 1 full bathroom
- Heating & cooling: Forced air heating (natural gas); Wood stove; Ceiling fan(s); Has heating
- Interior features: Electric range, oven, refrigerator; Water softener; Wood stove fireplace (1 total); Ceiling fans
- Laundry & utility: Water softener
Neighborhood map
What this means for you Summary
Snapshot
- This is a 3-bed/1.0-bath single-family listed at $138k.
Deal economics
- At list price, monthly cash flow is $66 ($789/yr) — positive.
- The deal already cash-flows at list — no discount required.
- To meet the 1% rule (rent ≥ 1% of price), the offer needs to be $134k (3.1% below list).
- Recommended offer: $134k (3.1% below list) — sets the bar for 1% rule.
Location & tenants
- Location reads 74/100 on livability (#37 in MT, #4,485 nationally) — a middle-class / working-renter tenant base. Strengths: cost of living A+, housing A+, health & safety A+; Watch: crime C-, amenities F, commute F.
- Sidney H S (town): math 35% / reading 40% proficiency, ranked #149 of 339 in MT (top 44%) — families likely to look elsewhere, expect single-tenant / working-renter base with shorter leases.
- Market conditions: 7 active listings in the ZIP.
Forward outlook
- Local home prices are declining (-3.0%/yr); year-one equity from $954 of loan paydown is wiped out by about $4k of value loss. Plan a longer hold.
- Richland County population projected at +93% by 2050 — long-run rental-demand tailwind backs the buy-and-hold thesis.
Negotiation context
- Only 14 days on market — expect competitive offers; lowballing is unlikely to land.
Risks & watch-outs
- Watch-outs: built in 1922 — expect roof / HVAC / electrical / plumbing capex.
Questions for the listing agent
- Built in 1922 — when were the roof, HVAC, electrical panel, plumbing, and water heater last replaced?
- Is there a deadline driving the sale (1031 exchange, divorce, estate, relocation)? That informs how much negotiation room exists.
- The area grade is low — what's the realistic commute time and amenity access for the typical tenant pool here? Any planned neighborhood developments (good or bad) we should know about?
- What's the average days-on-market for RENTAL listings here right now (not sales)? A rising rental-DOM trend means longer vacancies and softer asking-rent achievability than the comps imply.
- What's the recent tenant-quality profile in this submarket — average credit score on applications, eviction rate, late-payment / NSF rate, and stable-employment percentage? A property-management company in the area should have these aggregated.
- How much new for-sale + rental construction is in the pipeline within 1–3 miles? Heavy new supply typically softens prices + rents 12–24 months out; constrained supply supports both.
Investment metrics
- 1% rule
- 0.97% ✗
- Cap rate
- 6.86%
- Cash-on-cash
- 2.04%
- DSCR
- 1.09
- GRM
- 8.6
CMA / ARV
- ARV (on-the-fly)
- $123,240
- Comps found
- 1
Show comp detail 1 sale within ~0.75 mi
| Address | Dist | Beds/Ba | Sqft | Sold | Price | $/sf | Match |
|---|---|---|---|---|---|---|---|
| 301 West Main St | 0.22mi | 2/1.0 (-1) | 1,170 (+14%) | 21mo | $140,000 | $120 | 44 |
Match score weights: distance 35% · size 25% · config 20% · recency 20%. Top-matched comps best support the ARV.
Projected returns pro-forma
-3.0% appreciation · 3.0% rent growth · sell at horizon
- IRR
- -13.0%
- Equity multiple
- 0.53×
- Total profit
- $-18,134
- Equity at exit
- $20,576
- IRR
- -4.0%
- Equity multiple
- 0.74×
- Total profit
- $-10,226
- Equity at exit
- $11,932
Cash invested: $38,640 (down + closing). Projections, not guarantees.
Landlord ↔ Tenant lean methodology
- Overall (STATE)
- 82 Strongly Landlord-Friendly
- State Montana
- 82 Strongly Landlord-Friendly · R+11
- County
- — inherits STATE
- City
- — inherits STATE
ZIP-level market 59270
- Active inventory
- 7
- Price-to-rent
- 8.6×
Monthly cashflow live
- Estimated rent
- $1,338 medium interval (Pro) →
- Mortgage (P&I)
- −$724
- Tax from tax record
- −$210 /mo · $2,519/yr
- Insurance
- −$58
- HOA
- −$0
- Vacancy / Maint / Mgmt
- −$281
- Net cashflow
- $66
Break-even live
UW: 25.0% down · 7.5% · 30yr · 1.5% tax · 5.0% vac · 8.0% maint · 8.0% mgmt
Financing live
Cash to close
- Down payment
- $34,500
- Closing costs
- $4,140
- Reserves months
- —
- Total cash needed
- —
Loan-product check · same deal, 3 products live
Conventional
25% down · 7.5% · 30yr
- Down + closing
- —
- Monthly P&I
- —
- Monthly cashflow
- —
- DSCR
- —
- Eligible?
- —
Personal DTI + credit; lowest rate.
DSCR
20% down · 8.5% · 30yr
- Down + closing
- —
- Monthly P&I
- —
- Monthly cashflow
- —
- DSCR
- —
- Eligible?
- —
No personal income docs; deal must DSCR.
Hard money
10% down · 12.0% · 12mo
- Down + closing
- —
- Monthly P&I
- —
- Monthly cashflow
- —
- DSCR
- —
- Eligible?
- —
Short-term bridge; refi at stabilization.
Listing history 11 events
-
2026-06-18days on market $138,000 Active 14 DOM
-
2026-06-17days on market $138,000 Active 13 DOM
-
2026-06-16days on market $138,000 Active 12 DOM
-
2026-06-15days on market $138,000 Active 11 DOM
-
2026-06-14days on market $138,000 Active 9 DOM
-
2026-06-13days on market $138,000 Active 8 DOM
-
2026-06-10days on market $138,000 Active 6 DOM
-
2026-06-09days on market $138,000 Active 5 DOM
-
2026-06-08days on market $138,000 Active 4 DOM
-
2026-06-07days on market $138,000 Active 3 DOM
-
2026-06-05$138,000 Active 1 DOM
ⓘ Source: listings_history table (triggers on properties + properties_extension) + one-shot
backfill from property_details.listing_events for pre-trigger history.
Tax reassessment forecast MT · Resets to sale price
- Current annual tax
- $2,519 · $210/mo
- Projected year-2 tax
- $2,519 · $210/mo
- Expected delta
- $0/yr ($0/mo · 0.0%)
ⓘ Screening estimate from a state-policy table — verify with the county assessor before closing.
Climate risk First Street
- Flood 1/10 Low FEMA zone X (unshaded) · 0% chance over 30 yrs
- Wildfire 3/10 Moderate
- Heat 3/10 Moderate 7 d/yr ≥98°F today · 13 d/yr by 30 yrs out
- Wind 1/10 Low
- Air quality 3/10 Moderate 2 unhealthy d/yr today · 2 by 30 yrs out
Nearby sold comps map
Loading sold comps map…
Walkable amenities ~0.75 mi
Loading nearby amenities…
Taxation est. · year 1
- Rental income
- $16,053
- − Mortgage interest
- −$7,730
- − Property taxes
- −$2,519
- − Insurance
- −$690
- − Repairs & maintenance
- −$1,284
- − Management
- −$1,284
- − Depreciation
- −$4,015
- Taxable loss
- −$1,469
- Est. tax savings @ 24.0%
- +$353
- After-tax cash flow
- $1,141/yr
For passive investors: Depreciation is non-cash, so a rental often shows a tax loss while cash-flowing — sheltering income. Rental losses are passive: they offset passive income freely, and up to $25,000/yr can offset ordinary (W-2) income if you actively participate and your MAGI is under $100k (phasing out to $0 by $150k); unused losses carry forward. On sale, claimed depreciation is recaptured at up to 25%, and gains may owe capital-gains tax (a 1031 exchange can defer both). Figures are a year-1 estimate at your 24.0% rate — not tax advice; consult a CPA.
Schools (NCES district)
- District
- Sidney H S
- NCES district ID
- 3024230
- Math proficiency
- 35% ▲ 5.00%
- Reading proficiency
- 40% ▲ 5.00%
- Median HH income
- $60,761
- Composite
- 35.97/100
- National rank
- #9546
- State rank
- #149 of 339 in MT
Livability — Sidney
- Score
- 74/100
- State rank
- #37
- US rank
- #4485
Category grades
Schools grade is shown separately in the Schools card above.
Census & demographics
- Census place
- Sidney, MT
- County
- Richland County · 8,571 people
- City population
- 8,571
- Metro
- nan
- Population (ZIP)
- 8,571
- Household income
- $72,630
- Rent vs Own
- Severe rent burden
- 25.0
Population outlook (Richland County) Hauer SSP2
- Today (2025)
- 16,895 people
- By 2030
- 19,713 · +16.7%
- By 2040
- 25,884 · +53.2%
- By 2050
- 32,631 · +93.1%
- By 2075
- 50,915 · +201.4%
- By 2100
- 65,767 · +289.3%
Race, ethnicity, and origin ACS 2023
- Neighborhood character
- Predominantly White (86%)
- Race & ethnicity
- White 86% Hispanic / Latino 6% Two or more races 6% Pacific Islander 1%
- Hispanic origin (detail)
- Mexican 5%
- Common ancestry
- Portuguese 19% Slovak 3% Iranian 2%
- Foreign-born
- 3% · Canada
- Languages at home
- 97% English-only · Spanish 2% Other Asian/Pacific 1%
Political lean MEDSL · Richland
- 2024 margin
- Solid R (+68.0) · D 14.7% · R 82.6% · Other 2.7%
- 2008→2024 swing
- -24.1pp toward R · 2008: -43.9pp · 2024: -68.0pp
- All cycles
- 2024: R+68.0 2020: R+67.7 2016: R+66.8 2012: R+54.0 2008: R+43.9
Not yet ingested
- Civics
- —
Market trends
- HPI YoY
- ▼ -149.09%
- Current HPI
- 118.0931
- Rent YoY
- —
- Metro
- nan
- State GDP YoY
- ▲ 3.41%
- F500 in state
- 2
Industry mix (Fortune 500 HQ in MT)
| Industry | F500 HQs | Revenue |
|---|---|---|
| Technology / Analytics | 1 | $2B |
|
||
Price history
3 events — show timeline
- 2026-06-04 Listed $138,000 GNMLS
- 1993-09-03 Sold (Public Records) — Public Records
- 1992-10-30 Sold (Public Records) — Public Records
Property tax history
+12.8%/yrLatest (2025): $2,519 · +40.7% YoY. Source: county tax records.
Cash-flow waterfall
monthlySold comps — $/sqft
last 12 mo · ≤1 miLoading sold comps…