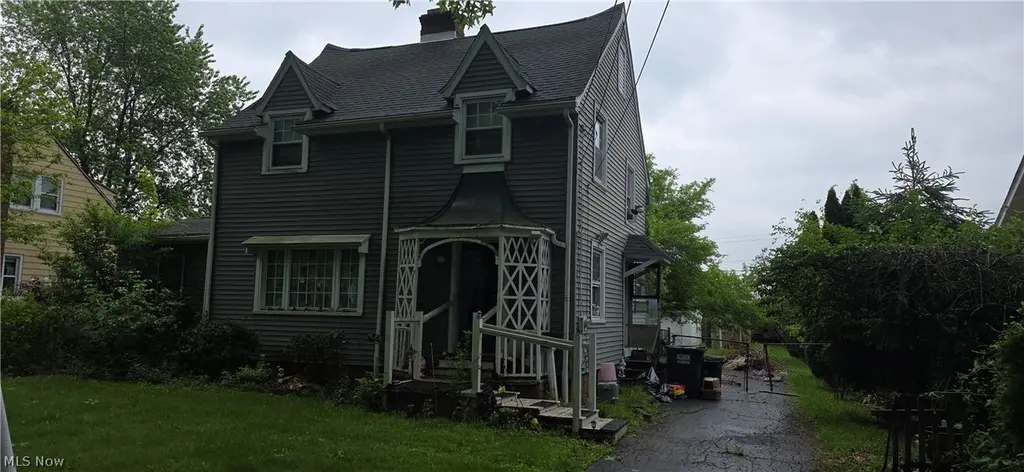
41 Crestline Pl · Youngstown, OH
Flood risk 1/10 · Minimal
- FEMA flood zone
- X (unshaded)
- Chance of flooding over 30 yrs
- 0.0%
- Est. flood insurance / yr
- $473 – $860
Fire risk 1/10 · Minimal
- Est. fire insurance / yr
- $713 – $1,323
Heat risk 3/10 · Minor
- Hot days now (above 97°F)
- 7 days/yr
- Hot days in 30 yrs
- 18 days/yr
Wind risk 1/10 · Minimal
- Chance of severe wind over 30 yrs
- —
Air-quality risk 2/10 · Minimal
- Unhealthy air days now
- 1 days/yr
- Unhealthy air days in 30 yrs
- 2 days/yr
Risk factors via First Street. Map © Google.
Why this score? — see what drove the B grade
The composite is a weighted blend of 9 inputs, each scored 0–100. Each bar is that input's sub-score; the figure is the points it added to the 100-point composite (weight × sub-score).
- Cash flow +26.9/30.0
- ARV discount +15.0/15.0
- DSCR +9.3/10.0
- 1% rule +7.2/10.0
- Schools +5.7/10.0
- Rent growth +4.1/5.0
- Livability +4.0/5.0
- Condition / age +2.5/5.0
- Appreciation +0.0/10.0
$99,000
🖨 Deal sheet 📄 Offer letter ✓ Due diligence
Listing remarks MLS
Updated move in condition; new kitchen w/ ceramic flooring; new windows & doors; new Berber carpet; gas furnace - less than 10 years old; family room/office w/ door to private deck.
Key facts
- Newer roof
- Newer siding
- Newer windows
Tags
Property features AI
Finance
- Financial info: Annual tax amount reported (2025)
Exterior
- Parking: Detached garage; 2 garage spaces
- Utilities: Public water; Public sewer
- Home design: 2-story home; Fixer condition
- Construction: Built (year per public records); Frame construction; Asphalt/fiberglass roof
- Exterior features: Lot about 0.264 acres; Aluminum siding
Interior
- Bedrooms: Total rooms: 10
- Bathrooms: One full bathroom (main level)
- Heating & cooling: Gas heating; Central air conditioning
- Interior features: Full basement; One fireplace (living area)
Neighborhood map
What this means for you Summary
Snapshot
- This is a 3-bed/1.0-bath single-family listed at $99k.
Deal economics
- At list price, monthly cash flow is $273 ($3k/yr) — positive.
- The deal already cash-flows at list — no discount required.
- Meets the 1% rule at list price ($1k rent vs $99k).
- Recommended offer: $98k (1.5% below list) — sets the bar for market timing.
- Cap rate 9.6% vs local median 7.0% in Youngstown — top-decile yield for the area; either an underpriced asset or a hidden risk that comps aren't pricing in. Stress-test before assuming the spread holds.
Location & tenants
- Location reads 81/100 on livability (#99 in OH, #1,506 nationally) — a professional / high-income tenant draw. Strengths: amenities A+, commute A+, cost of living A+; Watch: crime F, employment F.
- Boardman Local (urban): math 63% / reading 71% proficiency, ranked #189 of 656 in OH (top 29%) — acceptable for families but not a draw, mixed tenant base, ~2y average lease.
- Market conditions: Rents rising fast (+6.6%/yr); 136 active listings in the ZIP; 9 comparable units currently listed for rent nearby; rentals at typical pace (median 21d on market — plan ~3-4 weeks tenant-placement turnaround); 147 units permitted in Mahoning County in 2024 (0 in 5+ unit buildings).
Forward outlook
- Local home prices are declining (-3.0%/yr); year-one equity from $684 of loan paydown is wiped out by about $3k of value loss. Plan a longer hold.
- Mahoning County population projected at -14% by 2050 — secular population decline; favor cash flow + early exit over multi-decade hold.
- At projected returns (-3.0% appreciation + 6.6% rent growth), your $28k cash investment doubles in ~8 years — after that, you're playing with house money.
Negotiation context
- It's been on market 20 days — a 2% lower offer ($98k) is reasonable based on typical stale-listing flexibility.
- 3 sale attempts since 27y ago with the ask held roughly flat each time — persistent listings suggest the price (not the market) is what's stuck; bring a comps-based counter.
Risks & watch-outs
- Watch-outs: built in 1931 — expect roof / HVAC / electrical / plumbing capex.
Questions for the listing agent
- Built in 1931 — when were the roof, HVAC, electrical panel, plumbing, and water heater last replaced?
- Is there a deadline driving the sale (1031 exchange, divorce, estate, relocation)? That informs how much negotiation room exists.
- Crime grade is F in this area — have there been break-ins, vandalism, or insurance claims at this property in the last 3 years? What carrier currently insures it and at what premium?
- What's the average days-on-market for RENTAL listings here right now (not sales)? A rising rental-DOM trend means longer vacancies and softer asking-rent achievability than the comps imply.
- What's the recent tenant-quality profile in this submarket — average credit score on applications, eviction rate, late-payment / NSF rate, and stable-employment percentage? A property-management company in the area should have these aggregated.
- How much new for-sale + rental construction is in the pipeline within 1–3 miles? Heavy new supply typically softens prices + rents 12–24 months out; constrained supply supports both.
Investment metrics
- 1% rule
- 1.22% ✓
- Cap rate
- 9.60%
- Cash-on-cash
- 11.81%
- DSCR
- 1.53
- GRM
- 6.8
CMA / ARV
- ARV (on-the-fly)
- $149,760
- Comps found
- 12
Show comp detail 12 sales within ~0.75 mi
| Address | Dist | Beds/Ba | Sqft | Sold | Price | $/sf | Match |
|---|---|---|---|---|---|---|---|
| 7027 Amherst Ave | 0.31mi | 3/1.0 | 1,308 (+2%) | 1mo | $155,000 | $119 | 81 |
| 7355 Westview Dr | 0.39mi | 3/2.0 | 1,239 (-3%) | 10mo | $180,000 | $145 | 64 |
| 7427 Westview | 0.46mi | 3/1.5 | 1,216 (-5%) | 10mo | $142,000 | $117 | 60 |
| 79 Woodview Ave | 0.18mi | 3/1.0 | 1,089 (-15%) | 8mo | $161,000 | $148 | 60 |
| 7387 Oregon Trl | 0.60mi | 3/1.0 | 1,200 (-6%) | 6mo | $125,000 | $104 | 57 |
| 6510 Glendale Ave | 0.54mi | 3/1.0 | 1,368 (+7%) | 8mo | $135,000 | $99 | 56 |
| 7408 Glenwood Ave | 0.70mi | 3/1.0 | 1,335 (+4%) | 10mo | $140,000 | $105 | 52 |
| 107 Oakley Ave | 0.51mi | 3/1.0 | 1,122 (-12%) | 8mo | $152,500 | $136 | 49 |
| 154 Aylesboro Ave | 0.55mi | 3/1.0 | 1,444 (+13%) | 9mo | $150,000 | $104 | 46 |
| 90 Woodrow Ave | 0.68mi | 3/1.5 | 1,170 (-9%) | 11mo | $109,900 | $94 | 43 |
| 6721 Glenwood Ave | 0.68mi | 2/1.0 (-1) | 1,141 (-11%) | 8mo | $130,000 | $114 | 38 |
| 103 Wildwood Dr | 0.70mi | 3/1.5 | 1,451 (+13%) | 7mo | $170,000 | $117 | 37 |
Match score weights: distance 35% · size 25% · config 20% · recency 20%. Top-matched comps best support the ARV.
Projected returns pro-forma
-3.0% appreciation · 6.56% rent growth · sell at horizon
- IRR
- 5.2%
- Equity multiple
- 1.21×
- Total profit
- $5,840
- Equity at exit
- $14,761
- IRR
- 17.7%
- Equity multiple
- 2.71×
- Total profit
- $47,352
- Equity at exit
- $8,560
Cash invested: $27,720 (down + closing). Projections, not guarantees.
Landlord ↔ Tenant lean methodology
- Overall (STATE)
- 73 Landlord-Friendly
- State Ohio
- 73 Landlord-Friendly · R+6
- County
- — inherits STATE
- City
- — inherits STATE
ZIP-level market 44512
- Home prices YoY
- -21.0%
- Rents YoY
- 6.6%
- Active inventory
- 136
- Price-to-rent
- 6.8×
Monthly cashflow live
- Estimated rent
- $1,210 high interval (Pro) →
- Mortgage (P&I)
- −$519
- Tax from tax record
- −$123 /mo · $1,473/yr
- Insurance
- −$41
- HOA
- −$0
- Vacancy / Maint / Mgmt
- −$254
- Net cashflow
- $273
Break-even live
UW: 25.0% down · 7.5% · 30yr · 1.5% tax · 5.0% vac · 8.0% maint · 8.0% mgmt
Financing live
Cash to close
- Down payment
- $24,750
- Closing costs
- $2,970
- Reserves months
- —
- Total cash needed
- —
Loan-product check · same deal, 3 products live
Conventional
25% down · 7.5% · 30yr
- Down + closing
- —
- Monthly P&I
- —
- Monthly cashflow
- —
- DSCR
- —
- Eligible?
- —
Personal DTI + credit; lowest rate.
DSCR
20% down · 8.5% · 30yr
- Down + closing
- —
- Monthly P&I
- —
- Monthly cashflow
- —
- DSCR
- —
- Eligible?
- —
No personal income docs; deal must DSCR.
Hard money
10% down · 12.0% · 12mo
- Down + closing
- —
- Monthly P&I
- —
- Monthly cashflow
- —
- DSCR
- —
- Eligible?
- —
Short-term bridge; refi at stabilization.
Rent comps 9 comps
| Address | Beds | Baths | Sqft | Rent | $/sqft | DOM | Units | Dist |
|---|---|---|---|---|---|---|---|---|
| 7116 Claybourne Ave Youngstown, OH | 3.0 | 1.5 | 1020 | $1,600 | $1.57 | 21d | 1 | 0.24mi |
| 7125 Locust Ave Unit 7125-11 Youngstown, OH | 2.0 | 1.0 | 880 | $950 | $1.08 | 21d | 1 | 0.41mi |
| 86 Ferncliff Ave Youngstown, OH | 2.0 | 1.0 | 1027 | $1,200 | $1.17 | 21d | 1 | 0.42mi |
| 80 Romaine Ave Unit B Youngstown, OH | 2.0 | 1.0 | 1000 | $795 | $0.80 | 13d | 1 | 0.66mi |
| 500 Boardman Canfield Rd Youngstown, OH | 1.0–2.0 | 1.0–1.5 | 821 | $1,005 | $1.22 | 13d | 1 | 0.96mi |
| 7956 Market St Youngstown, OH | 2.0 | 1.0–2.0 | 1025 | $1,080 | $1.05 | 13d | 1 | 1.26mi |
| 413 Mathews Rd Boardman, OH | 2.0 | 1.0 | 1000 | $1,200 | $1.20 | 44d | 1 | 1.26mi |
| 457 Mathews Rd Boardman, OH | 3.0 | 1.0 | 1200 | $1,300 | $1.08 | 44d | 1 | 1.32mi |
| 6300 South Ave Youngstown, OH | 1.0–2.0 | 1.0–2.0 | 743 | $950 | $1.28 | 13d | 1 | 1.45mi |
Listing history 16 events
-
2026-06-19days on market $99,000 Active 20 DOM
-
2026-06-18days on market $99,000 Active 19 DOM
-
2026-06-17days on market $99,000 Active 18 DOM
-
2026-06-16days on market $99,000 Active 17 DOM
-
2026-06-15days on market $99,000 Active 16 DOM
-
2026-06-14days on market $99,000 Active 14 DOM
-
2026-06-13days on market $99,000 Active 13 DOM
-
2026-06-10days on market $99,000 Active 11 DOM
-
2026-06-09days on market $99,000 Active 10 DOM
-
2026-06-08days on market $99,000 Active 9 DOM
-
2026-06-07days on market $99,000 Active 8 DOM
-
2026-06-05days on market $99,000 Active 5 DOM
-
2026-06-02days on market $99,000 Active 3 DOM
-
2026-06-01days on market $99,000 Active 2 DOM
-
2026-05-30remarks 699-char remark
-
2026-05-30$99,000 Active 1 DOM
ⓘ Source: listings_history table (triggers on properties + properties_extension) + one-shot
backfill from property_details.listing_events for pre-trigger history.
Tax reassessment forecast OH · Partial reset (capped growth)
- Current annual tax
- $1,473 · $123/mo
- Projected year-2 tax
- $1,509 · $126/mo
- Expected delta
- +$36/yr (+$3/mo · 2.4%)
ⓘ Screening estimate from a state-policy table — verify with the county assessor before closing.
Climate risk First Street
- Flood 1/10 Low FEMA zone X (unshaded) · 0% chance over 30 yrs
- Wildfire 1/10 Low
- Heat 3/10 Moderate 7 d/yr ≥97°F today · 18 d/yr by 30 yrs out
- Wind 1/10 Low
- Air quality 2/10 Low 1 unhealthy d/yr today · 2 by 30 yrs out
Nearby sold comps map
Loading sold comps map…
Walkable amenities ~0.75 mi
Loading nearby amenities…
Taxation est. · year 1
- Rental income
- $14,521
- − Mortgage interest
- −$5,546
- − Property taxes
- −$1,473
- − Insurance
- −$495
- − Repairs & maintenance
- −$1,162
- − Management
- −$1,162
- − Depreciation
- −$2,880
- Taxable income
- $1,804
- Est. tax owed @ 24.0%
- −$433
- After-tax cash flow
- $2,841/yr
For passive investors: Depreciation is non-cash, so a rental often shows a tax loss while cash-flowing — sheltering income. Rental losses are passive: they offset passive income freely, and up to $25,000/yr can offset ordinary (W-2) income if you actively participate and your MAGI is under $100k (phasing out to $0 by $150k); unused losses carry forward. On sale, claimed depreciation is recaptured at up to 25%, and gains may owe capital-gains tax (a 1031 exchange can defer both). Figures are a year-1 estimate at your 24.0% rate — not tax advice; consult a CPA.
Schools (NCES district)
- District
- Boardman Local
- NCES district ID
- 3904830
- Math proficiency
- 63% ▼ -13.00%
- Reading proficiency
- 71% ▼ -8.00%
- Median HH income
- $47,613
- Composite
- 56.62/100
- National rank
- #1142
- State rank
- #189 of 656 in OH
Livability — Youngstown
- Score
- 81/100
- State rank
- #99
- US rank
- #1506
Category grades
Schools grade is shown separately in the Schools card above.
Census & demographics
- County
- Mahoning County · 84,956 people
- City population
- 28,503
- Metro
- Youngstown-Warren-Boardman, OH-PA
- Population (ZIP)
- 32,536
- Household income
- $63,317
- Rent vs Own
- Severe rent burden
- 910.0
Population outlook (Mahoning County) Hauer SSP2
- Today (2025)
- 223,932 people
- By 2030
- 218,387 · -2.5%
- By 2040
- 205,367 · -8.3%
- By 2050
- 193,606 · -13.5%
- By 2075
- 173,694 · -22.4%
- By 2100
- 151,147 · -32.5%
Race, ethnicity, and origin ACS 2023
- Neighborhood character
- Predominantly White (81%)
- Race & ethnicity
- White 81% Black 9% Two or more races 6% Hispanic / Latino 5%
- Hispanic origin (detail)
- Mexican 1% Puerto Rican 2%
- Common ancestry
- Romanian 6% Lithuanian 1% Slovak 1%
- Foreign-born
- 4% · Canada
- Languages at home
- 94% English-only · Spanish 2% Arabic 2% Other Indo-European 1%
Political lean MEDSL · Mahoning
- 2024 margin
- Lean R (+9.4) · D 44.9% · R 54.4%
- 2008→2024 swing
- -36.1pp toward R · 2008: 26.6pp · 2024: -9.4pp
- All cycles
- 2024: R+9.4 2020: R+1.9 2016: D+3.0 2012: D+27.7 2008: D+26.6
Not yet ingested
- Civics
- —
Market trends
- HPI YoY
- ▼ -56.75%
- Current HPI
- 213.1446
- Rent YoY
- ▲ 6.56%
- Metro
- Youngstown-Warren-Boardman, OH-PA
- State GDP YoY
- ▲ 1.98%
- F500 in state
- 48
Industry mix (Fortune 500 HQ in OH)
| Industry | F500 HQs | Revenue |
|---|---|---|
| Insurance | 3 | $145B |
|
||
| Industrial Machinery | 3 | $49B |
|
||
| Financial Services | 3 | $24B |
|
||
| Consumer Goods | 2 | $93B |
|
||
| Aerospace / Defense | 2 | $47B |
|
||
| Utilities | 2 | $33B |
|
||
Price history
+106.2% since first listed9 events — show timeline
- 2026-05-30 Listed $99,000 MLSNOW
- 2004-02-20 Sold (Public Records) $88,000 Public Records
- 2004-02-20 Sold (MLS) $88,000 MLSNOW
- 2004-01-20 Listed $89,900 MLSNOW
- 2001-07-05 Sold (Public Records) $115,000 Public Records
- 2000-01-31 Sold (Public Records) $76,000 Public Records
- 1999-12-16 Listing Removed — MLSNOW
- 1999-09-16 Listed $79,900 MLSNOW
- 1998-05-28 Sold (Public Records) $48,000 Public Records
Property tax history
+2.2%/yrLatest (2025): $1,473 · -3.4% YoY. Source: county tax records.
Cash-flow waterfall
monthlySold comps — $/sqft
last 12 mo · ≤1 miLoading sold comps…