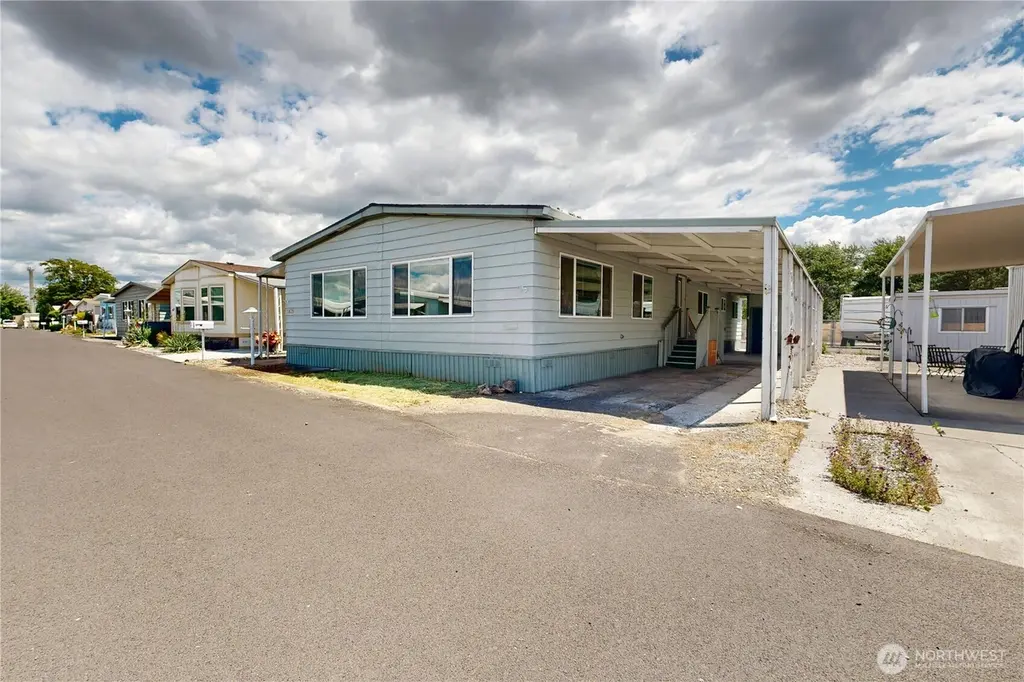
1425 Emerald St · Walla Walla, WA
Flood risk 3/10 · Minor
- FEMA flood zone
- —
- Chance of flooding over 30 yrs
- 0.09%
- Est. flood insurance / yr
- —
Fire risk 2/10 · Minimal
- Est. fire insurance / yr
- $604 – $1,122
Heat risk 4/10 · Minor
- Hot days now (above 98°F)
- 7 days/yr
- Hot days in 30 yrs
- 15 days/yr
Wind risk 1/10 · Minimal
- Chance of severe wind over 30 yrs
- —
Air-quality risk 8/10 · Major
- Unhealthy air days now
- 11 days/yr
- Unhealthy air days in 30 yrs
- 14 days/yr
Risk factors via First Street. Map © Google.
Why this score? — see what drove the B+ grade
The composite is a weighted blend of 9 inputs, each scored 0–100. Each bar is that input's sub-score; the figure is the points it added to the 100-point composite (weight × sub-score).
- Cash flow +30.0/30.0
- ARV discount +15.0/15.0
- 1% rule +10.0/10.0
- DSCR +10.0/10.0
- Schools +4.1/10.0
- Livability +4.0/5.0
- Rent growth +3.1/5.0
- Condition / age +2.5/5.0
- Appreciation +0.0/10.0
$95,000
🖨 Deal sheet 📄 Offer letter ✓ Due diligence
Listing remarks
This large 3-bedroom, 2-bath mobile home is situated in the charming Golden West Estates, a 55+ community. Inside, you'll find roomy living spaces, a separate dining area with built-in storage, a kitchen offering plenty of cabinetry, and a primary suite featuring two closets plus a bathroom with both a walk-in tub and separate walk-in shower. Outdoors, there's a covered carport for parking, a powered garden shed, and a side deck. While this home needs some TLC, it presents great potential—perfect for bringing your ideas to life on a budget!
Key facts
- Two closets
- Primary suite
- Walk-in tub
Tags
Property features AI
Finance
- Other: Calculated building area 1836; Structure type: Manufactured House
- Financial info: Land lease amount applies; Listing terms: Cash or Conventional
- HOA & community: Located in Golden West Estates (senior community); Park amenities include clubhouse and pool; Land lease
Exterior
- Parking: Carport
- Utilities: Public water (City of WW); Public sewer (City of WW); Power provided by Pacific Power
- Home design: Manufactured double-wide home; One story; Bath off primary; Walk-in closet; Mobile home remains
- Construction: Metal/vinyl construction materials; Composition roof
- Exterior features: Metal/vinyl exterior; Patio/porch/deck; Paved lot
Interior
- Kitchen: Dishwasher; Refrigerator; Stove/Range
- Bedrooms: 3 bedrooms
- Flooring: Laminate; Vinyl
- Bathrooms: 2 full bathrooms
- Heating & cooling: Forced air heating; Electric energy source
- Interior features: Fireplace (electric)
- Laundry & utility: Utility room
Neighborhood map
What this means for you Summary
Snapshot
- This is a 3-bed/2.0-bath manufactured listed at $95k.
Deal economics
- At list price, monthly cash flow is $817 ($10k/yr) — positive.
- The deal already cash-flows at list — no discount required.
- Meets the 1% rule at list price ($2k rent vs $95k).
- Cap rate 16.6% vs local median 2.3% in Walla Walla — top-decile yield for the area; either an underpriced asset or a hidden risk that comps aren't pricing in. Stress-test before assuming the spread holds.
Location & tenants
- Location reads 79/100 on livability (#105 in WA, #2,015 nationally) — a middle-class / working-renter tenant base. Strengths: amenities A+, commute A+, housing A+; Watch: schools C-.
- Walla Walla Public Schools (urban): math 41% / reading 50% proficiency, ranked #179 of 291 in WA (top 62%) — families likely to look elsewhere, expect single-tenant / working-renter base with shorter leases.
- Market conditions: Rents rising (+2.4%/yr); 422 active listings in the ZIP; 8 comparable units currently listed for rent nearby; rentals lingering (median 44d on market — plan ~5-8 weeks vacancy on turnover, expect pricing pressure); 100% of comp listings sitting > 30 days — soft ceiling on asking rent; 206 units permitted in Walla Walla County in 2024 (50 in 5+ unit buildings).
- This rent runs 31% of the median local income ($72k/yr) — at the standard rent-burdened threshold; future hikes will face affordability resistance.
Forward outlook
- Local home prices are declining (-3.0%/yr); year-one equity from $657 of loan paydown is wiped out by about $3k of value loss. Plan a longer hold.
- Walla Walla County population projected at +8% by 2050 — modest demand growth; plan on rents tracking national, not racing it.
- At projected returns (-3.0% appreciation + 2.4% rent growth), your $27k cash investment doubles in ~4 years — after that, you're playing with house money.
Negotiation context
- Only 8 days on market — expect competitive offers; lowballing is unlikely to land.
- Current owner paid $38k; list at $95k implies a 150% gain — meaningful room to come down on a strong offer.
Questions for the listing agent
- Built in 1979 — when were the roof, HVAC, electrical panel, plumbing, and water heater last replaced?
- Is there a deadline driving the sale (1031 exchange, divorce, estate, relocation)? That informs how much negotiation room exists.
- What's the average days-on-market for RENTAL listings here right now (not sales)? A rising rental-DOM trend means longer vacancies and softer asking-rent achievability than the comps imply.
- What's the recent tenant-quality profile in this submarket — average credit score on applications, eviction rate, late-payment / NSF rate, and stable-employment percentage? A property-management company in the area should have these aggregated.
- How much new for-sale + rental construction is in the pipeline within 1–3 miles? Heavy new supply typically softens prices + rents 12–24 months out; constrained supply supports both.
Investment metrics
- 1% rule
- 1.96% ✓
- Cap rate
- 16.61%
- Cash-on-cash
- 36.86%
- DSCR
- 2.64
- GRM
- 4.2
CMA / ARV
- ARV (on-the-fly)
- $189,108
- Comps found
- 10
Show comp detail 10 sales within ~0.75 mi
| Address | Dist | Beds/Ba | Sqft | Sold | Price | $/sf | Match |
|---|---|---|---|---|---|---|---|
| 66 Onyx St | 0.07mi | 3/2.0 | 1,794 (-2%) | 6mo | $80,000 | $45 | 88 |
| 1427 Jasper St | 0.06mi | 3/2.0 | 1,624 (-12%) | 4mo | $180,000 | $111 | 74 |
| 542 NE Fleetwood Ave | 0.69mi | 3/2.0 | 1,801 (-2%) | 2mo | $227,500 | $126 | 63 |
| 520 Troutdale Ave | 0.62mi | 3/2.0 | 1,792 (-2%) | 10mo | $130,000 | $73 | 59 |
| 923 NE Belroy | 0.59mi | 3/2.0 | 2,046 (+11%) | 0mo | $135,000 | $66 | 53 |
| 815 NE Karol Loop | 0.62mi | 3/2.0 | 1,743 (-5%) | 12mo | $250,000 | $143 | 52 |
| 974 NE Chelan St | 0.54mi | 2/2.0 (-1) | 1,680 (-8%) | 7mo | $129,000 | $77 | 50 |
| 915 NE Chelan St | 0.61mi | 3/2.0 | 1,620 (-12%) | 10mo | $127,500 | $79 | 44 |
| 1319 Rancho Villa Dr | 0.59mi | 3/2.0 | 1,620 (-12%) | 19mo | $167,500 | $103 | 37 |
| 1353 NW Rancho Villa Dr | 0.61mi | 3/2.0 | 1,560 (-15%) | 17mo | $183,000 | $117 | 33 |
Match score weights: distance 35% · size 25% · config 20% · recency 20%. Top-matched comps best support the ARV.
Projected returns pro-forma
-3.0% appreciation · 2.4% rent growth · sell at horizon
- IRR
- 32.1%
- Equity multiple
- 2.34×
- Total profit
- $35,556
- Equity at exit
- $14,165
- IRR
- 38.8%
- Equity multiple
- 4.52×
- Total profit
- $93,550
- Equity at exit
- $8,214
Cash invested: $26,600 (down + closing). Projections, not guarantees.
Landlord ↔ Tenant lean methodology
- Overall (STATE)
- 28 Tenant-Leaning
- State Washington
- 28 Tenant-Leaning · D+8
- County
- — inherits STATE
- City
- — inherits STATE
ZIP-level market 99362
- Rents YoY
- 2.4%
- Active inventory
- 422
- Price-to-rent
- 4.2×
Monthly cashflow live
- Estimated rent
- $1,865 high interval (Pro) →
- Mortgage (P&I)
- −$498
- Tax est. 1.5%
- −$119 /mo · $1,425/yr
- Insurance
- −$40
- HOA
- −$0
- Vacancy / Maint / Mgmt
- −$392
- Net cashflow
- $817
Break-even live
UW: 25.0% down · 7.5% · 30yr · 1.5% tax · 5.0% vac · 8.0% maint · 8.0% mgmt
Financing live
Cash to close
- Down payment
- $23,750
- Closing costs
- $2,850
- Reserves months
- —
- Total cash needed
- —
Loan-product check · same deal, 3 products live
Conventional
25% down · 7.5% · 30yr
- Down + closing
- —
- Monthly P&I
- —
- Monthly cashflow
- —
- DSCR
- —
- Eligible?
- —
Personal DTI + credit; lowest rate.
DSCR
20% down · 8.5% · 30yr
- Down + closing
- —
- Monthly P&I
- —
- Monthly cashflow
- —
- DSCR
- —
- Eligible?
- —
No personal income docs; deal must DSCR.
Hard money
10% down · 12.0% · 12mo
- Down + closing
- —
- Monthly P&I
- —
- Monthly cashflow
- —
- DSCR
- —
- Eligible?
- —
Short-term bridge; refi at stabilization.
Rent comps 8 comps
| Address | Beds | Baths | Sqft | Rent | $/sqft | DOM | Units | Dist |
|---|---|---|---|---|---|---|---|---|
| 265 Avery St Walla Walla, WA | 3.0 | 2.5 | 1268 | $1,995 | $1.57 | 44d | 1 | 0.47mi |
| 218 E Whitman Dr Unit 1 College Place, WA | 4.0 | 2.5 | 1485 | $2,240 | $1.51 | 44d | 1 | 1.14mi |
| 70 NE Rose St Unit B College Place, WA | 3.0 | 1.0 | 1500 | $1,300 | $0.87 | 44d | 1 | 1.15mi |
| 425 N 7th Ave Apt 2 Walla Walla, WA | 4.0 | 2.5 | 1697 | $1,795 | $1.06 | 44d | 1 | 1.17mi |
| 310 SE 3rd St Unit 4 College Place, WA | 2.0 | 1.0 | 1300 | $1,300 | $1.00 | 44d | 1 | 1.19mi |
| 24 SE 4th St College Place, WA | 3.0 | 1.0 | 1270 | $2,045 | $1.61 | 44d | 1 | 1.35mi |
| 1908 Sunset Dr Unit 217 Walla Walla, WA | 3.0 | 2.5 | 1500 | $2,050 | $1.37 | 44d | 1 | 1.39mi |
| 512 S College Ave #1 College Place, WA | 3.0 | 1.0 | 1328 | $1,785 | $1.34 | 44d | 1 | 1.44mi |
Listing history 8 events
-
2026-06-19days on market $95,000 Active 8 DOM
-
2026-06-18days on market $95,000 Active 7 DOM
-
2026-06-17days on market $95,000 Active 6 DOM
-
2026-06-16days on market $95,000 Active 5 DOM
-
2026-06-15days on market $95,000 Active 4 DOM
-
2026-06-14days on market $95,000 Active 2 DOM
-
2026-06-12remarks 546-char remark
-
2026-06-12$95,000 Active 1 DOM
ⓘ Source: listings_history table (triggers on properties + properties_extension) + one-shot
backfill from property_details.listing_events for pre-trigger history.
Climate risk First Street
- Flood 3/10 Moderate 9% chance over 30 yrs
- Wildfire 2/10 Low
- Heat 4/10 Moderate 7 d/yr ≥98°F today · 15 d/yr by 30 yrs out
- Wind 1/10 Low
- Air quality 8/10 Severe 11 unhealthy d/yr today · 14 by 30 yrs out
Nearby sold comps map
Loading sold comps map…
Walkable amenities ~0.75 mi
Loading nearby amenities…
Taxation est. · year 1
- Rental income
- $22,384
- − Mortgage interest
- −$5,321
- − Property taxes
- −$1,425
- − Insurance
- −$475
- − Repairs & maintenance
- −$1,791
- − Management
- −$1,791
- − Depreciation
- −$2,764
- Taxable income
- $8,818
- Est. tax owed @ 24.0%
- −$2,116
- After-tax cash flow
- $7,689/yr
For passive investors: Depreciation is non-cash, so a rental often shows a tax loss while cash-flowing — sheltering income. Rental losses are passive: they offset passive income freely, and up to $25,000/yr can offset ordinary (W-2) income if you actively participate and your MAGI is under $100k (phasing out to $0 by $150k); unused losses carry forward. On sale, claimed depreciation is recaptured at up to 25%, and gains may owe capital-gains tax (a 1031 exchange can defer both). Figures are a year-1 estimate at your 24.0% rate — not tax advice; consult a CPA.
Schools (NCES district)
- District
- Walla Walla Public Schools
- NCES district ID
- 5309450
- Math proficiency
- 41% ▲ 3.00%
- Reading proficiency
- 50% ▼ -1.00%
- Median HH income
- $46,207
- Composite
- 40.88/100
- National rank
- #7531
- State rank
- #179 of 291 in WA
Livability — Walla Walla
- Score
- 79/100
- State rank
- #105
- US rank
- #2015
Category grades
Schools grade is shown separately in the Schools card above.
Census & demographics
- Census place
- Walla Walla, WA
- County
- Walla Walla County · 52,990 people
- City population
- 42,853
- Metro
- Walla Walla, WA
- Population (ZIP)
- 42,853
- Household income
- $72,474
- Rent vs Own
- Severe rent burden
- 1238.0
Population outlook (Walla Walla County) Hauer SSP2
- Today (2025)
- 63,088 people
- By 2030
- 64,417 · +2.1%
- By 2040
- 66,563 · +5.5%
- By 2050
- 68,337 · +8.3%
- By 2075
- 73,235 · +16.1%
- By 2100
- 74,878 · +18.7%
Race, ethnicity, and origin ACS 2023
- Neighborhood character
- Predominantly White (69%)
- Race & ethnicity
- White 69% Hispanic / Latino 22% Two or more races 9% Black 2% Asian 2% Native American 2%
- Hispanic origin (detail)
- Mexican 17%
- Common ancestry
- Slovak 3% Portuguese 3% Lithuanian 3%
- Foreign-born
- 9% · Canada, China
- Languages at home
- 83% English-only · Spanish 15% Chinese 1%
Political lean MEDSL · Walla Walla
- 2024 margin
- Lean R (+8.1) · D 44.6% · R 52.7% · Other 2.7%
- 2008→2024 swing
- +8.5pp toward D · 2008: -16.6pp · 2024: -8.1pp
- All cycles
- 2024: R+8.1 2020: R+8.7 2016: R+16.4 2012: R+22.3 2008: R+16.6
Not yet ingested
- Civics
- —
Market trends
- HPI YoY
- ▼ -488.03%
- Current HPI
- 321.6891
- Rent YoY
- ▲ 2.40%
- Metro
- Walla Walla, WA
- State GDP YoY
- ▲ 4.65%
- F500 in state
- 22
Industry mix (Fortune 500 HQ in WA)
| Industry | F500 HQs | Revenue |
|---|---|---|
| Retail | 2 | $269B |
|
||
| Technology / Retail | 1 | $638B |
|
||
| Technology | 1 | $245B |
|
||
| Telecommunications | 1 | $38B |
|
||
| Food / Beverage | 1 | $36B |
|
||
| Automotive / Trucks | 1 | $34B |
|
||
Price history
+150.0% since first listed2 events — show timeline
- 2026-06-11 Listed $95,000 NWMLS as Distributed by MLS Grid
- 2006-01-06 Sold (Public Records) $38,000 Public Records
Property tax history
-14.6%/yrLatest (2026): $96 · +0.1% YoY. Source: county tax records.
Cash-flow waterfall
monthlySold comps — $/sqft
last 12 mo · ≤1 miLoading sold comps…