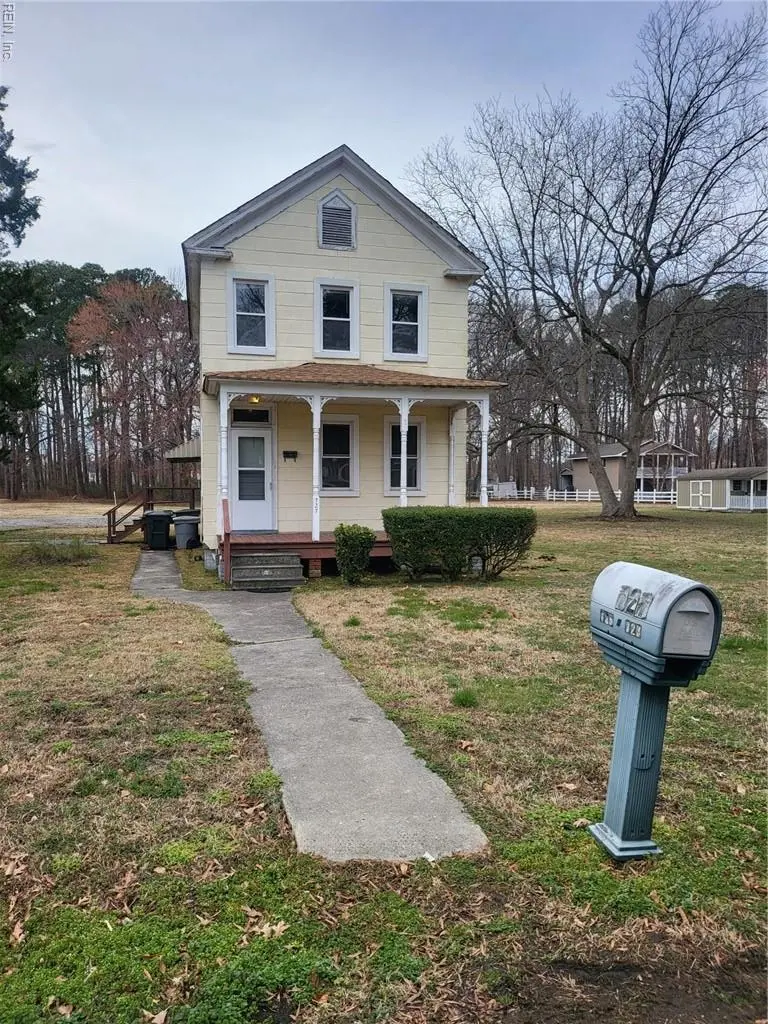
727 Bellwood Rd · Hampton, VA
Flood risk 4/10 · Minor
- FEMA flood zone
- X (shaded)
- Chance of flooding over 30 yrs
- 0.22%
- Est. flood insurance / yr
- $473 – $860
Fire risk 1/10 · Minimal
- Est. fire insurance / yr
- $666 – $1,236
Heat risk 9/10 · Severe
- Hot days now (above 106°F)
- 7 days/yr
- Hot days in 30 yrs
- 17 days/yr
Wind risk 8/10 · Major
- Chance of severe wind over 30 yrs
- 80.0%
Air-quality risk 2/10 · Minimal
- Unhealthy air days now
- 1 days/yr
- Unhealthy air days in 30 yrs
- 1 days/yr
Risk factors via First Street. Map © Google.
Why this score? — see what drove the B- grade
The composite is a weighted blend of 9 inputs, each scored 0–100. Each bar is that input's sub-score; the figure is the points it added to the 100-point composite (weight × sub-score).
- Cash flow +23.3/30.0
- ARV discount +15.0/15.0
- DSCR +7.5/10.0
- 1% rule +5.8/10.0
- Schools +5.5/10.0
- Livability +3.8/5.0
- Rent growth +3.5/5.0
- Condition / age +2.5/5.0
- Appreciation +0.0/10.0
$175,000
🖨 Deal sheet 📄 Offer letter ✓ Due diligence
Listing remarks MLS
Priced to sell ASAP! Priced under city assessment! Priced to sell as-is, where-is. 2 story, 3 bedrooms, 1.5 bath farmhouse! Renters just moved out! Clean but needs love! This is a cash purchase only. New subdivision going in behind home.
Key facts
- 0.23 acre lot
- Built 1911
- Listed 72 days
Neighborhood map
What this means for you Summary
Snapshot
- This is a 3-bed/1.5-bath single-family listed at $175k.
Deal economics
- At list price, monthly cash flow is $321 ($4k/yr) — positive.
- The deal already cash-flows at list — no discount required.
- Meets the 1% rule at list price ($2k rent vs $175k).
- Recommended offer: $164k (6.0% below list) — sets the bar for market timing.
- Cap rate 8.5% vs local median 4.5% in Hampton — top-decile yield for the area; either an underpriced asset or a hidden risk that comps aren't pricing in. Stress-test before assuming the spread holds.
Location & tenants
- Location reads 75/100 on livability (#133 in VA, #4,302 nationally) — a middle-class / working-renter tenant base. Strengths: housing A+, health & safety A+, cost of living A; Watch: crime C-, amenities D+, commute F.
- Hampton City Public School District (urban): math 60% / reading 70% proficiency, ranked #40 of 131 in VA (top 30%) — acceptable for families but not a draw, mixed tenant base, ~2y average lease.
- Market conditions: Rents rising fast (+4.0%/yr); 231 active listings in the ZIP; 19 comparable units currently listed for rent nearby; rentals at typical pace (median 24d on market — plan ~3-4 weeks tenant-placement turnaround); 68 units permitted in Hampton city in 2024 (0 in 5+ unit buildings).
- This rent runs 31% of the median local income ($73k/yr) — at the standard rent-burdened threshold; future hikes will face affordability resistance.
Forward outlook
- Local home prices are declining (-3.0%/yr); year-one equity from $1k of loan paydown is wiped out by about $5k of value loss. Plan a longer hold.
- Hampton County population projected at -13% by 2050 — secular population decline; favor cash flow + early exit over multi-decade hold.
Negotiation context
- It's been on market 72 days — a 6% lower offer ($164k) is reasonable based on typical stale-listing flexibility.
- 3 sale attempts with the ask held roughly flat each time — persistent listings suggest the price (not the market) is what's stuck; bring a comps-based counter.
- Current owner paid $45k; list at $175k implies a 289% gain — meaningful room to come down on a strong offer.
Risks & watch-outs
- Watch-outs: built in 1911 — expect roof / HVAC / electrical / plumbing capex.
- Climate carrying-cost: severe wind risk, 80% chance of damaging wind over 30y; extreme-heat days projected 7→17/yr by 2055 (HVAC capex compounding) — expect insurance premiums to compound above CPI over the hold.
Questions for the listing agent
- It's been on market 72 days. Have you received any prior offers? Is the seller open to a 6% concession, seller financing, or rate buy-down credit?
- Built in 1911 — when were the roof, HVAC, electrical panel, plumbing, and water heater last replaced?
- Why hasn't it sold? Are there any deal-killer items the seller is aware of (foundation, flood, title, zoning, code violations)?
- Is there a deadline driving the sale (1031 exchange, divorce, estate, relocation)? That informs how much negotiation room exists.
- Schools are B-rated — typically a magnet for longer-tenancy family renters. What's the average tenant stay here, and is there a school-zone premium baked into asking?
- What's the average days-on-market for RENTAL listings here right now (not sales)? A rising rental-DOM trend means longer vacancies and softer asking-rent achievability than the comps imply.
- What's the recent tenant-quality profile in this submarket — average credit score on applications, eviction rate, late-payment / NSF rate, and stable-employment percentage? A property-management company in the area should have these aggregated.
- How much new for-sale + rental construction is in the pipeline within 1–3 miles? Heavy new supply typically softens prices + rents 12–24 months out; constrained supply supports both.
Investment metrics
- 1% rule
- 1.08% ✓
- Cap rate
- 8.49%
- Cash-on-cash
- 7.85%
- DSCR
- 1.35
- GRM
- 7.7
CMA / ARV
- ARV (median comp)
- $246,667
- List price
- $175,000
- Delta
- -29.05%
- Verdict
- UNDERPRICED
- Comps
- 20 within 1.0 mi
Show comp detail 12 sales within ~0.75 mi
| Address | Dist | Beds/Ba | Sqft | Sold | Price | $/sf | Match |
|---|---|---|---|---|---|---|---|
| 727 Bellwood Rd | 0.00mi | 3/1.5 | 1,278 (0%) | 1mo | $160,000 | $125 | 99 |
| 723 Spruce Rd | 0.51mi | 3/2.0 | 1,237 (-3%) | 1mo | $299,900 | $242 | 68 |
| 116 Latham Dr | 0.57mi | 3/1.0 | 1,294 (+1%) | 4mo | $170,000 | $131 | 66 |
| 8513 Orcutt Ave | 0.72mi | 3/1.0 | 1,282 (+0%) | 3mo | $259,900 | $203 | 62 |
| 5004 Arony St | 0.67mi | 4/2.0 (+1) | 1,250 (-2%) | 4mo | $285,000 | $228 | 55 |
| 648 Bellwood Rd | 0.23mi | 4/2.0 (+1) | 1,458 (+14%) | 6mo | $299,900 | $206 | 54 |
| 308 Mattox Dr | 0.75mi | 4/2.5 (+1) | 1,312 (+3%) | 6mo | $275,000 | $210 | 47 |
| 2 Bobs Ct | 0.64mi | 3/2.0 | 1,433 (+12%) | 2mo | $295,000 | $206 | 47 |
| 633 Sedgefield Dr | 0.68mi | 4/1.0 (+1) | 1,180 (-8%) | 4mo | $110,500 | $94 | 45 |
| 212 Tyler Ave | 0.67mi | 3/2.0 | 1,142 (-11%) | 6mo | $255,000 | $223 | 44 |
| 618 Mclawhorne Dr | 0.69mi | 3/2.0 | 1,130 (-12%) | 6mo | $270,000 | $239 | 41 |
| 5 Marval Cir | 0.70mi | 3/2.0 | 1,119 (-12%) | 6mo | $321,400 | $287 | 40 |
Match score weights: distance 35% · size 25% · config 20% · recency 20%. Top-matched comps best support the ARV.
Projected returns pro-forma
-3.0% appreciation · 4.05% rent growth · sell at horizon
- IRR
- -3.2%
- Equity multiple
- 0.88×
- Total profit
- $-5,900
- Equity at exit
- $26,093
- IRR
- 7.6%
- Equity multiple
- 1.61×
- Total profit
- $29,672
- Equity at exit
- $15,131
Cash invested: $49,000 (down + closing). Projections, not guarantees.
Landlord ↔ Tenant lean methodology
- Overall (STATE)
- 55 Moderately Landlord-Leaning
- State Virginia
- 55 Moderately Landlord-Leaning · D+2
- County
- — inherits STATE
- City
- — inherits STATE
ZIP-level market 23666
- Home prices YoY
- -15.7%
- Rents YoY
- 4.0%
- Active inventory
- 231
- Price-to-rent
- 7.7×
Monthly cashflow live
- Estimated rent
- $1,894 high interval (Pro) →
- Mortgage (P&I)
- −$918
- Tax from tax record
- −$185 /mo · $2,216/yr
- Insurance
- −$73
- HOA
- −$0
- Vacancy / Maint / Mgmt
- −$398
- Net cashflow
- $321
Break-even live
UW: 25.0% down · 7.5% · 30yr · 1.5% tax · 5.0% vac · 8.0% maint · 8.0% mgmt
Financing live
Cash to close
- Down payment
- $43,750
- Closing costs
- $5,250
- Reserves months
- —
- Total cash needed
- —
Loan-product check · same deal, 3 products live
Conventional
25% down · 7.5% · 30yr
- Down + closing
- —
- Monthly P&I
- —
- Monthly cashflow
- —
- DSCR
- —
- Eligible?
- —
Personal DTI + credit; lowest rate.
DSCR
20% down · 8.5% · 30yr
- Down + closing
- —
- Monthly P&I
- —
- Monthly cashflow
- —
- DSCR
- —
- Eligible?
- —
No personal income docs; deal must DSCR.
Hard money
10% down · 12.0% · 12mo
- Down + closing
- —
- Monthly P&I
- —
- Monthly cashflow
- —
- DSCR
- —
- Eligible?
- —
Short-term bridge; refi at stabilization.
Rent comps 19 comps
| Address | Beds | Baths | Sqft | Rent | $/sqft | DOM | Units | Dist |
|---|---|---|---|---|---|---|---|---|
| 606 Randolph Rd Newport News, VA | 3.0 | 1.0 | 989 | $1,475 | $1.49 | 43d | 1 | 0.51mi |
| 531 Bulkeley Pl Newport News, VA | 2.0–3.0 | 1.0–1.5 | 780 | $1,891 | $2.42 | 1d | 20 | 0.65mi |
| 268 Town Pointe Way Newport News, VA | 3.0 | 2.5 | 1587 | $2,200 | $1.39 | 43d | 1 | 0.66mi |
| 116 Tyler Ave Unit 1A Newport News, VA | 2.0 | 1.0 | 950 | $1,075 | $1.13 | 43d | 1 | 0.70mi |
| 5014 Hazelwood Rd Newport News, VA | 3.0 | 1.0 | 955 | $1,900 | $1.99 | 1d | 1 | 0.76mi |
| 315 Piez Ave Newport News, VA | 2.0 | 1.0 | 1081 | $1,395 | $1.29 | 11d | 1 | 0.95mi |
| 23 Green Ct Newport News, VA | 3.0 | 1.5 | 1200 | $2,000 | $1.67 | 14d | 1 | 1.05mi |
| 207 Ferguson Ave Newport News, VA | 3.0 | 1.0 | 1350 | $1,495 | $1.11 | 23d | 1 | 1.05mi |
| 39 Westover Rd Newport News, VA | 3.0 | 1.5 | 1850 | $2,000 | $1.08 | 14d | 1 | 1.09mi |
| 24 Brandon Rd Newport News, VA | 3.0 | 1.5 | 1574 | $2,495 | $1.59 | 43d | 1 | 1.11mi |
| 604 Big Bethel Rd Hampton, VA | 3.0 | 1.5 | 1139 | $2,300 | $2.02 | 43d | 1 | 1.15mi |
| 346 Sitka Ct Hampton, VA | 3.0 | 1.5 | 1210 | $1,675 | $1.38 | 23d | 1 | 1.16mi |
| 101 Basswood Dr Newport News, VA | 4.0 | 2.0 | 1409 | $2,395 | $1.70 | 43d | 1 | 1.18mi |
| 25 Franklin Rd Newport News, VA | 3.0 | 1.5 | 1521 | $1,750 | $1.15 | 7d | 1 | 1.19mi |
| 314 Martha Lee Dr Hampton, VA | 3.0 | 2.0 | 1210 | $2,200 | $1.82 | 23d | 1 | 1.22mi |
| 100 Tricia Ln Newport News, VA | 2.0 | 1.0 | 900 | $1,250 | $1.39 | 23d | 1 | 1.36mi |
| 32 Gambol St Newport News, VA | 3.0 | 2.5 | 1650 | $2,500 | $1.52 | 3d | 1 | 1.37mi |
| 119 Yorkshire Ter Hampton, VA | 4.0 | 1.5 | 1499 | $2,500 | $1.67 | 23d | 1 | 1.42mi |
| 674 Summer Day Ct Newport News, VA | 2.0–3.0 | 2.0 | 986 | $1,502 | $1.52 | 4d | 4 | 1.44mi |
Listing history 8 events
-
2026-05-15status Pending 237-char remark
Show marketing remark (237 chars)
Priced to sell ASAP! Priced under city assessment! Priced to sell as-is, where-is. 2 story, 3 bedrooms, 1.5 bath farmhouse! Renters just moved out! Clean but needs love! This is a cash purchase only. New subdivision going in behind home.
-
2026-05-14status Under Contract 237-char remark
Show marketing remark (237 chars)
Priced to sell ASAP! Priced under city assessment! Priced to sell as-is, where-is. 2 story, 3 bedrooms, 1.5 bath farmhouse! Renters just moved out! Clean but needs love! This is a cash purchase only. New subdivision going in behind home.
-
2026-05-14status Pending
Show marketing remark (237 chars)
Priced to sell ASAP! Priced under city assessment! Priced to sell as-is, where-is. 2 story, 3 bedrooms, 1.5 bath farmhouse! Renters just moved out! Clean but needs love! This is a cash purchase only. New subdivision going in behind home.
-
2026-05-11historical Active Under Contract 237-char remark
Show marketing remark (237 chars)
Priced to sell ASAP! Priced under city assessment! Priced to sell as-is, where-is. 2 story, 3 bedrooms, 1.5 bath farmhouse! Renters just moved out! Clean but needs love! This is a cash purchase only. New subdivision going in behind home.
-
2026-03-02$175,000 Active 237-char remark
Show marketing remark (237 chars)
Priced to sell ASAP! Priced under city assessment! Priced to sell as-is, where-is. 2 story, 3 bedrooms, 1.5 bath farmhouse! Renters just moved out! Clean but needs love! This is a cash purchase only. New subdivision going in behind home.
-
2026-03-02$175,000 Active
Show marketing remark (237 chars)
Priced to sell ASAP! Priced under city assessment! Priced to sell as-is, where-is. 2 story, 3 bedrooms, 1.5 bath farmhouse! Renters just moved out! Clean but needs love! This is a cash purchase only. New subdivision going in behind home.
-
1991-03-01soldstatus $45,000
ⓘ Source: listings_history table (triggers on properties + properties_extension) + one-shot
backfill from property_details.listing_events for pre-trigger history.
Tax reassessment forecast VA · Resets to sale price
- Current annual tax
- $2,216 · $185/mo
- Projected year-2 tax
- $2,216 · $185/mo
- Expected delta
- $0/yr ($0/mo · 0.0%)
ⓘ Screening estimate from a state-policy table — verify with the county assessor before closing.
Climate risk First Street
- Flood 4/10 Moderate FEMA zone X (shaded) · 22% chance over 30 yrs
- Wildfire 1/10 Low
- Heat 9/10 Extreme 7 d/yr ≥106°F today · 17 d/yr by 30 yrs out
- Wind 8/10 Severe 80% chance of damaging wind over 30 yrs
- Air quality 2/10 Low 1 unhealthy d/yr today · 1 by 30 yrs out
Nearby sold comps map
Loading sold comps map…
Walkable amenities ~0.75 mi
Loading nearby amenities…
Taxation est. · year 1
- Rental income
- $22,725
- − Mortgage interest
- −$9,803
- − Property taxes
- −$2,216
- − Insurance
- −$875
- − Repairs & maintenance
- −$1,818
- − Management
- −$1,818
- − Depreciation
- −$5,091
- Taxable income
- $1,104
- Est. tax owed @ 24.0%
- −$265
- After-tax cash flow
- $3,584/yr
For passive investors: Depreciation is non-cash, so a rental often shows a tax loss while cash-flowing — sheltering income. Rental losses are passive: they offset passive income freely, and up to $25,000/yr can offset ordinary (W-2) income if you actively participate and your MAGI is under $100k (phasing out to $0 by $150k); unused losses carry forward. On sale, claimed depreciation is recaptured at up to 25%, and gains may owe capital-gains tax (a 1031 exchange can defer both). Figures are a year-1 estimate at your 24.0% rate — not tax advice; consult a CPA.
Schools (NCES district)
- District
- Hampton City Public School District
- NCES district ID
- 5101800
- Math proficiency
- 60% ▼ -21.00%
- Reading proficiency
- 70% ▼ -4.00%
- Median HH income
- $50,089
- Composite
- 55.19/100
- National rank
- #1272
- State rank
- #40 of 131 in VA
Livability — Hampton
- Score
- 75/100
- State rank
- #133
- US rank
- #4302
Category grades
Schools grade is shown separately in the Schools card above.
Census & demographics
- Census place
- Hampton, VA
- County
- Hampton City · 132,421 people
- City population
- 132,421
- Metro
- Virginia Beach-Norfolk-Newport News, VA-NC
- Population (ZIP)
- 54,233
- Household income
- $72,568
- Rent vs Own
- Severe rent burden
- 2951.0
Population outlook (Hampton County) Hauer SSP2
- Today (2025)
- 134,055 people
- By 2030
- 131,753 · -1.7%
- By 2040
- 125,017 · -6.7%
- By 2050
- 116,825 · -12.9%
- By 2075
- 97,033 · -27.6%
- By 2100
- 76,188 · -43.2%
Race, ethnicity, and origin ACS 2023
- Neighborhood character
- Diverse neighborhood (Simpson 0.65)
- Race & ethnicity
- Black 51% White 29% Two or more races 10% Hispanic / Latino 9% Asian 4%
- Hispanic origin (detail)
- Mexican 3% Puerto Rican 3%
- Common ancestry
- Italian 1% Lithuanian 1% Romanian 1%
- Foreign-born
- 7% · Canada, Vietnam
- Languages at home
- 90% English-only · Spanish 5% Vietnamese 1% Arabic 1%
Political lean MEDSL · Hampton
- 2024 margin
- Solid D (+39.9) · D 69.2% · R 29.4% · Other 1.4%
- 2008→2024 swing
- +1.0pp no change · 2008: 38.9pp · 2024: 39.9pp
- All cycles
- 2024: D+39.9 2020: D+42.2 2016: D+37.8 2012: D+45.4 2008: D+38.9
Not yet ingested
- Civics
- —
Market trends
- HPI YoY
- ▼ -49.01%
- Current HPI
- 262.821
- Rent YoY
- ▲ 4.05%
- Metro
- Virginia Beach-Norfolk-Newport News, VA-NC
- State GDP YoY
- ▲ 2.40%
- F500 in state
- 50
Industry mix (Fortune 500 HQ in VA)
| Industry | F500 HQs | Revenue |
|---|---|---|
| Aerospace / Defense | 4 | $236B |
|
||
| Technology / Defense | 3 | $32B |
|
||
| Financial Services | 2 | $176B |
|
||
| Utilities | 2 | $27B |
|
||
| Insurance | 2 | $25B |
|
||
| Technology | 2 | $15B |
|
||
Price history
+288.9% since first listed8 events — show timeline
- 2026-05-15 Pending — CBRAR
- 2026-05-14 Pending — REINMLS
- 2026-05-14 Pending — WMLS
- 2026-05-11 Contingent — REINMLS
- 2026-03-02 Listed $175,000 WMLS
- 2026-03-02 Listed $175,000 REINMLS
- 2026-03-02 Listed $175,000 CBRAR
- 1991-03-01 Sold (Public Records) $45,000 Public Records
Property tax history
+7.9%/yrLatest (2025): $2,216 · +7.7% YoY. Source: county tax records.
Cash-flow waterfall
monthlySold comps — $/sqft
last 12 mo · ≤1 miLoading sold comps…