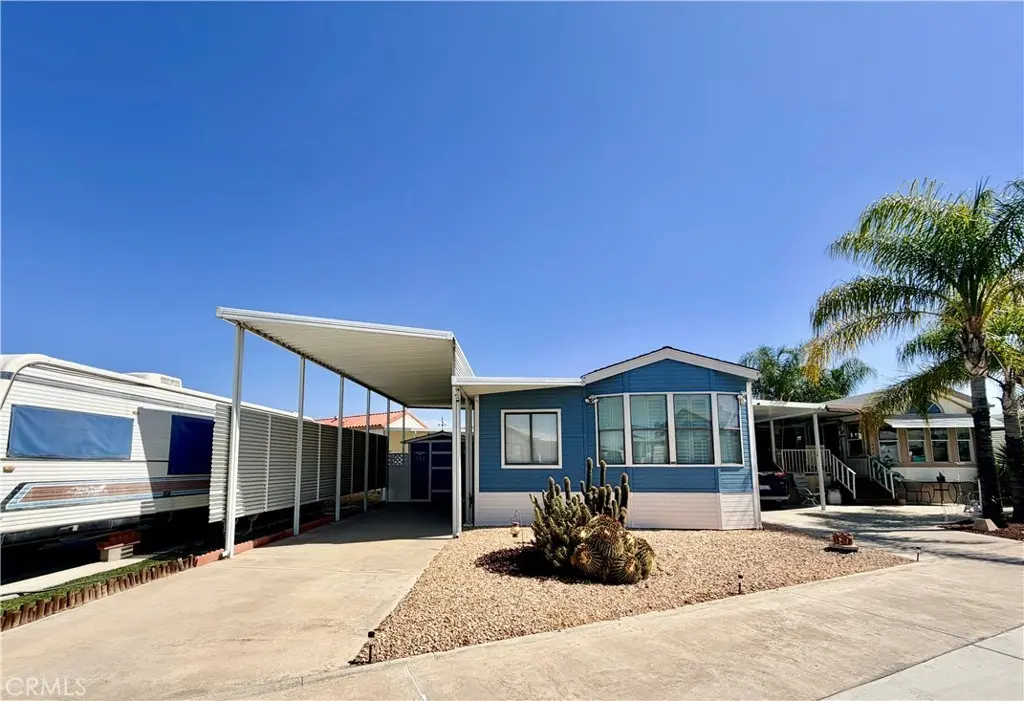
1295 S Cawston #521 · Hemet, CA
Flood risk 4/10 · Minor
- FEMA flood zone
- X (shaded)
- Chance of flooding over 30 yrs
- 0.24%
- Est. flood insurance / yr
- $507 – $1,088
Fire risk 7/10 · Major
- Est. fire insurance / yr
- $659 – $1,223
Heat risk 7/10 · Major
- Hot days now (above 104°F)
- 6 days/yr
- Hot days in 30 yrs
- 18 days/yr
Wind risk 1/10 · Minimal
- Chance of severe wind over 30 yrs
- —
Air-quality risk 6/10 · Moderate
- Unhealthy air days now
- 9 days/yr
- Unhealthy air days in 30 yrs
- 11 days/yr
Risk factors via First Street. Map © Google.
Why this score? — see what drove the C grade
The composite is a weighted blend of 9 inputs, each scored 0–100. Each bar is that input's sub-score; the figure is the points it added to the 100-point composite (weight × sub-score).
- Cash flow +24.6/30.0
- 1% rule +8.3/10.0
- DSCR +8.0/10.0
- ARV discount +7.5/15.0
- Rent growth +3.4/5.0
- Livability +2.6/5.0
- Schools +2.5/10.0
- Condition / age +2.5/5.0
- Appreciation +0.0/10.0
$115,000
🖨 Deal sheet (PDF) 📄 Offer letter ✓ Due diligence
Listing remarks
OWN YOUR LAND! Welcome home to Mt Shadows RV Resort 55+ gated community. Beautiful 1990 Cavco trailer with addition approx. 500 sq ft of living space. Covered back patio with enclosed vinyl fencing in the backyard great for entertaining. Back door entrance to the enclosed patio room could be used as a den or second bedroom. The home has vaulted ceilings, ceiling fans and shows light and bright with wood shutters on the front windows. Kitchen open to living & dining room with propane gas stove, refrigerator included. Master bedroom has extra built-in storage cabinets & mirrored wardrobe closet doors. Bathroom has a step-in shower with extra cabinet. Covered back porch great for e
Key facts
- Gated community
- Covered back patio
- Step-in shower
Tags
Property features AI
Finance
- Financial info: Association fee $292 monthly
- HOA & community: Part of Mt Shadows RV Resort association; Monthly association fee; Association amenities: grounds maintenance, sewer, trash, utilities, clubhouse, billiard room, cable TV, pool, multipurpose recreational room, spa, water, pet-friendly (with rules), banquet facilities, gym/exercise room, card room, meeting room; call for rules; Senior community
Exterior
- Parking: Attached carport
- Security: Gated community
- Utilities: Public sewer; District/public water
- Home design: Planned development community; No common walls (detached); Single-story; Entry level at ground floor; Has a view
- Construction: Manufactured home construction
- Exterior features: Manufactured house; Composition roof; Vinyl fencing; Awning; Covered rear porch; Patio; Close to clubhouse; Front and back yard; Community pool (association, in-ground, heated, gunite)
Interior
- Kitchen: Propane range/oven/stove (free-standing); Electric water heater; Breakfast nook; Has appliances
- Bedrooms: Primary bedroom on main floor
- Flooring: Vinyl flooring; Carpet
- Bathrooms: One 3/4 bathroom with vanity area and shower; Main level bathroom
- Heating & cooling: Heat pump; Central furnace; Central cooling (heat pump)
- Interior features: Ceiling fan; Cathedral/vaulted ceilings; Skylights; Custom window coverings; Back door entry; One-level home; Gated community access; Has spa (association, in-ground, community, heated, gunite)
- Laundry & utility: Inside laundry with washer and dryer included; Electric dryer hookup and washer hookup
Neighborhood map
What this means for you Summary
Snapshot
- This is a 1-bed/1.0-bath manufactured listed at $115k.
Deal economics
- At list price, monthly cash flow is $239 ($3k/yr) — positive.
- The deal already cash-flows at list — no discount required.
- Meets the 1% rule at list price ($2k rent vs $115k).
- Recommended offer: $112k (3.0% below list) — sets the bar for market timing.
- Cap rate 8.8% vs local median 4.8% in Hemet — top-decile yield for the area; either an underpriced asset or a hidden risk that comps aren't pricing in. Stress-test before assuming the spread holds.
Location & tenants
- Location reads 51/100 on livability (#1,056 in CA) — a working-class tenant base; expect higher turnover. Strengths: housing A+; Watch: crime D+, schools F, amenities F.
- Hemet Unified (suburban): math 19% / reading 41% proficiency, ranked #360 of 517 in CA (top 70%) — families likely to look elsewhere, expect single-tenant / working-renter base with shorter leases; 66% free/reduced lunch — lower-income household profile, screen leases tightly.
- Market conditions: Rents rising (+3.7%/yr); 291 active listings in the ZIP; 9,195 units permitted in Riverside County in 2024 (1,512 in 5+ unit buildings).
Forward outlook
- Local home prices are declining (-3.0%/yr); year-one equity from $795 of loan paydown is wiped out by about $3k of value loss. Plan a longer hold.
- Riverside County population projected at +22% by 2050 — long-run rental-demand tailwind backs the buy-and-hold thesis.
Negotiation context
- It's been on market 37 days — a 3% lower offer ($112k) is reasonable based on typical stale-listing flexibility.
Risks & watch-outs
- Climate carrying-cost: major wildfire risk; extreme-heat days projected 6→18/yr by 2055 (HVAC capex compounding) — expect insurance premiums to compound above CPI over the hold.
Questions for the listing agent
- It's been on market 37 days. Have you received any prior offers? Is the seller open to a 3% concession, seller financing, or rate buy-down credit?
- What does the HOA fee cover, when was the last increase, and are there any pending special assessments or reserve-fund shortfalls?
- Is there a deadline driving the sale (1031 exchange, divorce, estate, relocation)? That informs how much negotiation room exists.
- Schools are F-rated, which usually means shorter tenancies and higher turnover. Who's the typical renter profile here, and what's been the actual vacancy rate?
- Crime grade is D in this area — have there been break-ins, vandalism, or insurance claims at this property in the last 3 years? What carrier currently insures it and at what premium?
- What's the average days-on-market for RENTAL listings here right now (not sales)? A rising rental-DOM trend means longer vacancies and softer asking-rent achievability than the comps imply.
- What's the recent tenant-quality profile in this submarket — average credit score on applications, eviction rate, late-payment / NSF rate, and stable-employment percentage? A property-management company in the area should have these aggregated.
- How much new for-sale + rental construction is in the pipeline within 1–3 miles? Heavy new supply typically softens prices + rents 12–24 months out; constrained supply supports both.
Investment metrics
- 1% rule
- 1.33% ✓
- Cap rate
- 8.78%
- Cash-on-cash
- 8.90%
- DSCR
- 1.40
- GRM
- 6.3
CMA / ARV
- ARV (median comp)
- $115,000
- List price
- $115,000
- Delta
- —
- Verdict
- FAIR
- Comps
- 19 within 1.0 mi
Show comp detail 10 sales within ~0.75 mi
| Address | Dist | Beds/Ba | Sqft | Sold | Price | $/sf | Match |
|---|---|---|---|---|---|---|---|
| 1295 S Cawston #263 | 0.18mi | 1/1.0 | 600 (+9%) | 2mo | $128,000 | $213 | 75 |
| 1295 S Cawston Ave #340 | 0.16mi | 1/1.0 | 600 (+9%) | 6mo | $120,000 | $200 | 73 |
| 1295 S Cawston #69 | 0.17mi | 1/1.0 | 600 (+9%) | 6mo | $127,000 | $212 | 72 |
| 1295 S Cawston Ave #344 | 0.16mi | 1/1.0 | 480 (-13%) | 5mo | $55,000 | $115 | 67 |
| 1295 S Cawston Ave #480 | 0.16mi | 2/1.0 (+1) | 576 (+5%) | 15mo | $138,000 | $240 | 67 |
| 1295 S Cawston Ave #97 | 0.13mi | 1/1.0 | 600 (+9%) | 19mo | $115,000 | $192 | 63 |
| 1295 S Cawston Ave #488 | 0.16mi | 1/1.0 | 600 (+9%) | 19mo | $146,000 | $243 | 62 |
| 1295 S Cawston Ave #54 | 0.18mi | 1/1.0 | 600 (+9%) | 19mo | $125,000 | $208 | 60 |
| 1295 S Cawston Ave #339 | 0.16mi | 1/1.0 | 600 (+9%) | 24mo | $110,000 | $183 | 58 |
| 1295 S Cawston Ave #41 | 0.25mi | 1/1.0 | 600 (+9%) | 23mo | $120,000 | $200 | 54 |
Match score weights: distance 35% · size 25% · config 20% · recency 20%. Top-matched comps best support the ARV.
Projected returns pro-forma
-3.0% appreciation · 3.74% rent growth · sell at horizon
- IRR
- -1.7%
- Equity multiple
- 0.93×
- Total profit
- $-2,149
- Equity at exit
- $17,147
- IRR
- 8.9%
- Equity multiple
- 1.71×
- Total profit
- $23,023
- Equity at exit
- $9,943
Cash invested: $32,200 (down + closing). Projections, not guarantees.
Landlord ↔ Tenant lean methodology
- Overall (STATE)
- 18 Strongly Tenant-Friendly
- State California
- 18 Strongly Tenant-Friendly · D+13
- County
- — inherits STATE
- City
- — inherits STATE
ZIP-level market 92545
- Home prices YoY
- -24.6%
- Rents YoY
- 3.7%
- Active inventory
- 291
- Price-to-rent
- 6.3×
Monthly cashflow live
- Estimated rent
- $1,530 medium interval (Pro) →
- Mortgage (P&I)
- −$603
- Tax from tax record
- −$27 /mo · $326/yr
- Insurance
- −$48
- HOA
- −$292
- Vacancy / Maint / Mgmt
- −$321
- Net cashflow
- $239
Break-even live
Sensitivity live
| Price | -10% $304 | -5% $271 | +0% $239 | +5% $206 | +10% $174 |
|---|---|---|---|---|---|
| Rent | -10% $118 | -5% $178 | +0% $239 | +5% $299 | +10% $360 |
| Rate | -1.0pp $297 | -0.5pp $268 | base $239 | +0.5pp $209 | +1.0pp $179 |
UW: 25.0% down · 7.5% · 30yr · 1.5% tax · 5.0% vac · 8.0% maint · 8.0% mgmt
Financing live
Cash to close
- Down payment
- $28,750
- Closing costs
- $3,450
- Reserves months
- —
- Total cash needed
- —
Loan-product check · same deal, 3 products live
Conventional
25% down · 7.5% · 30yr
- Down + closing
- —
- Monthly P&I
- —
- Monthly cashflow
- —
- DSCR
- —
- Eligible?
- —
Personal DTI + credit; lowest rate.
DSCR
20% down · 8.5% · 30yr
- Down + closing
- —
- Monthly P&I
- —
- Monthly cashflow
- —
- DSCR
- —
- Eligible?
- —
No personal income docs; deal must DSCR.
Hard money
10% down · 12.0% · 12mo
- Down + closing
- —
- Monthly P&I
- —
- Monthly cashflow
- —
- DSCR
- —
- Eligible?
- —
Short-term bridge; refi at stabilization.
HOA detail
- Monthly dues
- $292 · $3,504/yr
- Likely covers
- gassecurity
Listing history 15 events
-
2026-06-21days on market $115,000 Active 37 DOM
-
2026-06-18days on market $115,000 Active 34 DOM
-
2026-06-17days on market $115,000 Active 33 DOM
-
2026-06-16days on market $115,000 Active 32 DOM
-
2026-06-15days on market $115,000 Active 31 DOM
-
2026-06-13days on market $115,000 Active 29 DOM
-
2026-06-09days on market $115,000 Active 25 DOM
-
2026-06-08days on market $115,000 Active 24 DOM
-
2026-06-07days on market $115,000 Active 23 DOM
-
2026-06-04days on market $115,000 Active 20 DOM
-
2026-06-03days on market $115,000 Active 19 DOM
-
2026-06-02days on market $115,000 Active 18 DOM
-
2026-06-01days on market $115,000 Active 17 DOM
-
2026-05-31days on market $115,000 Active 16 DOM
-
2026-05-15$115,000 Active 1277-char remark
ⓘ Source: listings_history table (triggers on properties + properties_extension) + one-shot
backfill from property_details.listing_events for pre-trigger history.
Tax reassessment forecast CA · Resets to sale price
- Current annual tax
- $326 · $27/mo
- Projected year-2 tax
- $874 · $73/mo
- Expected delta
- +$548/yr (+$46/mo · 168.1%)
ⓘ Screening estimate from a state-policy table — verify with the county assessor before closing.
Climate risk First Street
- Flood 4/10 Moderate FEMA zone X (shaded) · 24% chance over 30 yrs
- Wildfire 7/10 Severe
- Heat 7/10 Severe 6 d/yr ≥104°F today · 18 d/yr by 30 yrs out
- Wind 1/10 Low
- Air quality 6/10 Major 9 unhealthy d/yr today · 11 by 30 yrs out
Nearby sold comps map
Loading sold comps map…
Walkable amenities ~0.75 mi
Loading nearby amenities…
Taxation est. · year 1
- Rental income
- $18,363
- − Mortgage interest
- −$6,442
- − Property taxes
- −$326
- − Insurance
- −$575
- − Repairs & maintenance
- −$1,469
- − Management
- −$1,469
- − HOA
- −$3,504
- − Depreciation
- −$3,345
- Taxable income
- $1,233
- Est. tax owed @ 24.0%
- −$296
- After-tax cash flow
- $2,569/yr
For passive investors: Depreciation is non-cash, so a rental often shows a tax loss while cash-flowing — sheltering income. Rental losses are passive: they offset passive income freely, and up to $25,000/yr can offset ordinary (W-2) income if you actively participate and your MAGI is under $100k (phasing out to $0 by $150k); unused losses carry forward. On sale, claimed depreciation is recaptured at up to 25%, and gains may owe capital-gains tax (a 1031 exchange can defer both). Figures are a year-1 estimate at your 24.0% rate — not tax advice; consult a CPA.
Schools (NCES district)
- District
- Hemet Unified
- NCES district ID
- 0616920
- Math proficiency
- 19% ▼ -3.00%
- Reading proficiency
- 41% ▲ 4.00%
- Median HH income
- $39,962
- Composite
- 25.16/100
- National rank
- #7517
- State rank
- #360 of 517 in CA
Livability — Hemet
- Score
- 51/100
- State rank
- #1056
- US rank
- #25208
Category grades
Schools grade is shown separately in the Schools card above.
Census & demographics
- Census place
- Hemet, CA
- County
- Riverside County · 2,287,001 people
- City population
- 137,670
- Metro
- Riverside-San Bernardino-Ontario, CA
- Population (ZIP)
- 45,982
- Household income
- $63,770
- Rent vs Own
- Severe rent burden
- 1813.0
Population outlook (Riverside County) Hauer SSP2
- Today (2025)
- 2,664,475 people
- By 2030
- 2,802,692 · +5.2%
- By 2040
- 3,050,904 · +14.5%
- By 2050
- 3,256,783 · +22.2%
- By 2075
- 3,655,058 · +37.2%
- By 2100
- 3,766,594 · +41.4%
Race, ethnicity, and origin ACS 2023
- Neighborhood character
- Diverse neighborhood (Simpson 0.65)
- Race & ethnicity
- Hispanic / Latino 46% White 35% Two or more races 17% Black 8% Asian 5% Native American 1%
- Hispanic origin (detail)
- Mexican 40%
- Common ancestry
- Slovak 2% Lithuanian 2% Portuguese 1%
- Foreign-born
- 19% · Canada, Vietnam, Jamaica
- Languages at home
- 69% English-only · Spanish 27% Tagalog/Filipino 1% Other Indo-European 1%
Political lean MEDSL · Riverside
- 2024 margin
- Toss-up / Even · D 48.0% · R 49.3% · Other 2.6%
- 2008→2024 swing
- -3.6pp toward R · 2008: 2.3pp · 2024: -1.3pp
- All cycles
- 2024: R+1.3 2020: D+8.0 2016: D+4.3 2012: R+0.4 2008: D+2.3
Not yet ingested
- Civics
- —
Market trends
- HPI YoY
- ▼ -116.25%
- Current HPI
- 356.9414
- Rent YoY
- ▲ 3.74%
- Metro
- Riverside-San Bernardino-Ontario, CA
- State GDP YoY
- ▲ 3.21%
- F500 in state
- 116
Industry mix (Fortune 500 HQ in CA)
| Industry | F500 HQs | Revenue |
|---|---|---|
| Technology | 27 | $1,492B |
|
||
| Financial Services | 3 | $174B |
|
||
| Retail | 3 | $44B |
|
||
| Insurance | 3 | $26B |
|
||
| Media / Entertainment | 2 | $115B |
|
||
| Pharmaceuticals / Biotech | 2 | $62B |
|
||
Price history
1 event — show timeline
- 2026-05-15 Listed $115,000 CRMLS
Property tax history
+0.6%/yrLatest (2014): $326 · -3.0% YoY. Source: county tax records.
Cash-flow waterfall
monthlySold comps — $/sqft
last 12 mo · ≤1 miLoading sold comps…