3415 Oro Dam Blvd E #124 · Oroville, CA
Flood risk 5/10 · Moderate
- FEMA flood zone
- X (unshaded)
- Chance of flooding over 30 yrs
- 0.66%
- Est. flood insurance / yr
- $507 – $1,088
Fire risk 9/10 · Severe
- Est. fire insurance / yr
- $659 – $1,223
Heat risk 7/10 · Major
- Hot days now (above 105°F)
- 7 days/yr
- Hot days in 30 yrs
- 16 days/yr
Wind risk 1/10 · Minimal
- Chance of severe wind over 30 yrs
- —
Air-quality risk 10/10 · Severe
- Unhealthy air days now
- 29 days/yr
- Unhealthy air days in 30 yrs
- 36 days/yr
Risk factors via First Street. Map © Google.
Why this score? — see what drove the D grade
The composite is a weighted blend of 9 inputs, each scored 0–100. Each bar is that input's sub-score; the figure is the points it added to the 100-point composite (weight × sub-score).
- Cash flow +15.0/30.0
- ARV discount +7.5/15.0
- 1% rule +5.0/10.0
- DSCR +5.0/10.0
- Schools +2.8/10.0
- Rent growth +2.5/5.0
- Livability +2.5/5.0
- Condition / age +2.5/5.0
- Appreciation +0.0/10.0
$29,995
🖨 Deal sheet 📄 Offer letter ✓ Due diligence
Listing remarks
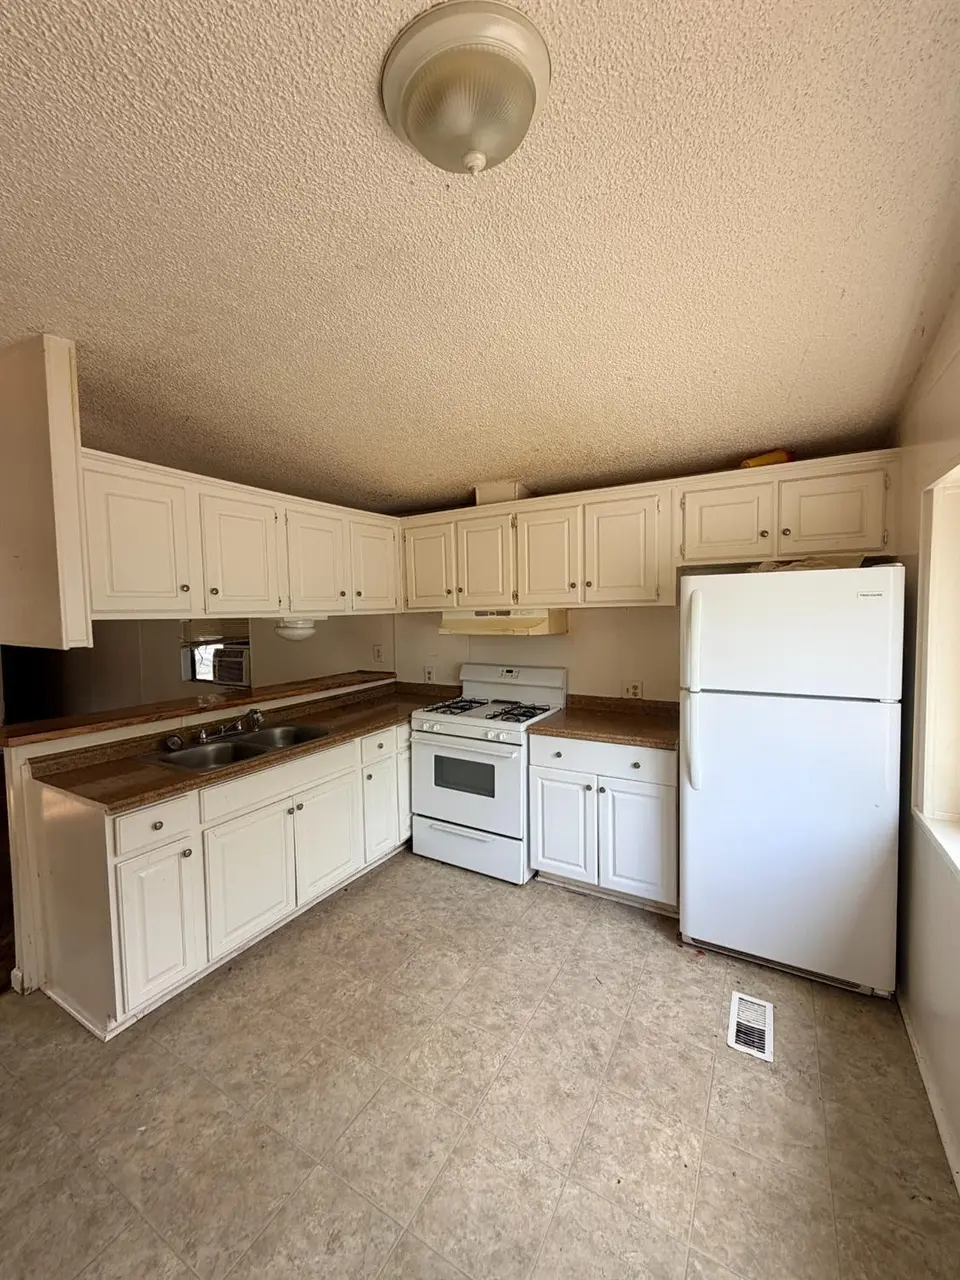
Home Site #124 at Pleasant Valley MHC in Oroville, CA is available for a QUICK Sale! This 2 bedroom, 1 bath home doesn't need much work. With 784 square feet, this home is ready for a new owner! Stop by or give us a call today!
Key facts
- Built 1988
- Listed 15 days
Property features AI
Finance
- Other: Located in Oroville, CA 95966 (3415 Oro Dam Blvd. E #124)
- Financial info: Land lease: No (listed land lease amount present in source but excluded)
- HOA & community: No association; Not a senior community
Exterior
- Parking: No garage
- Utilities: Individual electric meter; Individual gas meter; Water from water district; Sewer: other
- Home design: Manufactured in park (single wide); Built in 1988; Skyline make; Vinyl skirting
- Construction: Composition roof
- Exterior features: Other lot features
Interior
- Kitchen: No specific kitchen features listed
- Bedrooms: 2 bedrooms
- Flooring: Carpet; Laminate
- Bathrooms: 1 full bathroom
- Heating & cooling: Central heating; Other cooling
- Interior features: Skylight(s); Tub with shower over
- Laundry & utility: Laundry room inside; 220V outlet in laundry
Neighborhood map
What this means for you Summary
Snapshot
- This is a 2-bed/1.0-bath manufactured listed at $30k.
Deal economics
- At list price, monthly cash flow is $976 ($12k/yr) — positive.
- The deal already cash-flows at list — no discount required.
- Meets the 1% rule at list price ($1k rent vs $30k).
- Recommended offer: $30k (1.5% below list) — sets the bar for market timing.
- Cap rate 45.3% vs local median 4.6% in Oroville — top-decile yield for the area; either an underpriced asset or a hidden risk that comps aren't pricing in. Stress-test before assuming the spread holds.
Location & tenants
- Location reads 50/100 on livability (#1,136 in CA) — a working-class tenant base; expect higher turnover. Watch: schools D, cost of living D, crime F.
- Oroville Union High (town): math 19% / reading 49% proficiency, ranked #300 of 517 in CA (top 58%) — families likely to look elsewhere, expect single-tenant / working-renter base with shorter leases.
- Market conditions: 372 active listings in the ZIP; 13 comparable units currently listed for rent nearby; rentals leasing fast (median 13d on market — plan ~1-2 weeks tenant-placement turnaround); 946 units permitted in Butte County in 2024 (254 in 5+ unit buildings).
Forward outlook
- Local home prices are declining (-3.0%/yr); year-one equity from $207 of loan paydown is wiped out by about $900 of value loss. Plan a longer hold.
- Butte County population projected at +10% by 2050 — modest demand growth; plan on rents tracking national, not racing it.
- At projected returns (-3.0% appreciation + 3.0% rent growth), your $8k cash investment doubles in ~1 year — after that, you're playing with house money.
Negotiation context
- It's been on market 16 days — a 2% lower offer ($30k) is reasonable based on typical stale-listing flexibility.
Risks & watch-outs
- Climate carrying-cost: moderate flood risk; severe wildfire risk; extreme-heat days projected 7→16/yr by 2055 (HVAC capex compounding) — expect insurance premiums to compound above CPI over the hold.
Questions for the listing agent
- Is there a deadline driving the sale (1031 exchange, divorce, estate, relocation)? That informs how much negotiation room exists.
- Schools are D-rated, which usually means shorter tenancies and higher turnover. Who's the typical renter profile here, and what's been the actual vacancy rate?
- Crime grade is F in this area — have there been break-ins, vandalism, or insurance claims at this property in the last 3 years? What carrier currently insures it and at what premium?
- The area grade is low — what's the realistic commute time and amenity access for the typical tenant pool here? Any planned neighborhood developments (good or bad) we should know about?
- What's the average days-on-market for RENTAL listings here right now (not sales)? A rising rental-DOM trend means longer vacancies and softer asking-rent achievability than the comps imply.
- What's the recent tenant-quality profile in this submarket — average credit score on applications, eviction rate, late-payment / NSF rate, and stable-employment percentage? A property-management company in the area should have these aggregated.
- How much new for-sale + rental construction is in the pipeline within 1–3 miles? Heavy new supply typically softens prices + rents 12–24 months out; constrained supply supports both.
Investment metrics
- 1% rule
- 4.93% ✓
- Cap rate
- 45.32%
- Cash-on-cash
- 139.39%
- DSCR
- 7.20
- GRM
- 1.7
CMA / ARV
- ARV (on-the-fly)
- $85,456
- Comps found
- 4
Show comp detail 4 sales within ~0.75 mi
| Address | Dist | Beds/Ba | Sqft | Sold | Price | $/sf | Match |
|---|---|---|---|---|---|---|---|
| 3415 Oro Dam Blvd E #102 | 0.10mi | 2/1.0 | 784 (0%) | 23mo | $50,000 | $64 | 76 |
| 3415 Oro Dam Blvd E #217 | 0.03mi | 2/2.0 | 728 (-7%) | 9mo | $99,000 | $136 | 75 |
| 3415 Oro Dam Blvd E #149 | 0.06mi | 2/1.0 | 896 (+14%) | 7mo | $23,000 | $26 | 67 |
| 3415 Oro Dam Blvd E #117 | 0.04mi | 3/2.0 (+1) | 900 (+15%) | 16mo | $97,990 | $109 | 51 |
Match score weights: distance 35% · size 25% · config 20% · recency 20%. Top-matched comps best support the ARV.
Projected returns pro-forma
-3.0% appreciation · 3.0% rent growth · sell at horizon
- IRR
- —
- Equity multiple
- 7.82×
- Total profit
- $57,289
- Equity at exit
- $4,472
- IRR
- —
- Equity multiple
- 16.47×
- Total profit
- $129,952
- Equity at exit
- $2,593
Cash invested: $8,399 (down + closing). Projections, not guarantees.
Landlord ↔ Tenant lean methodology
- Overall (STATE)
- 18 Strongly Tenant-Friendly
- State California
- 18 Strongly Tenant-Friendly · D+13
- County
- — inherits STATE
- City
- — inherits STATE
ZIP-level market 95966
- Active inventory
- 372
- Price-to-rent
- 1.7×
Monthly cashflow live
- Estimated rent
- $1,480 high interval (Pro) →
- Mortgage (P&I)
- −$157
- Tax from tax record
- −$24 /mo · $286/yr
- Insurance
- −$12
- HOA
- −$0
- Vacancy / Maint / Mgmt
- −$311
- Net cashflow
- $976
Break-even live
UW: 25.0% down · 7.5% · 30yr · 1.5% tax · 5.0% vac · 8.0% maint · 8.0% mgmt
Financing live
Cash to close
- Down payment
- $7,499
- Closing costs
- $900
- Reserves months
- —
- Total cash needed
- —
Loan-product check · same deal, 3 products live
Conventional
25% down · 7.5% · 30yr
- Down + closing
- —
- Monthly P&I
- —
- Monthly cashflow
- —
- DSCR
- —
- Eligible?
- —
Personal DTI + credit; lowest rate.
DSCR
20% down · 8.5% · 30yr
- Down + closing
- —
- Monthly P&I
- —
- Monthly cashflow
- —
- DSCR
- —
- Eligible?
- —
No personal income docs; deal must DSCR.
Hard money
10% down · 12.0% · 12mo
- Down + closing
- —
- Monthly P&I
- —
- Monthly cashflow
- —
- DSCR
- —
- Eligible?
- —
Short-term bridge; refi at stabilization.
Rent comps 13 comps
| Address | Beds | Baths | Sqft | Rent | $/sqft | DOM | Units | Dist |
|---|---|---|---|---|---|---|---|---|
| 2804 Orange Ave Unit 11 Oroville, CA | 1.0 | 1.0 | 526 | $1,095 | $2.08 | 13d | 1 | 0.57mi |
| 2741 Gilmore Ln Unit 3 Oroville, CA | 2.0 | 1.0 | 689 | $1,595 | $2.31 | 21d | 1 | 0.60mi |
| 1558 Bridge St Oroville, CA | 2.0 | 1.0 | 661 | $1,172 | $1.77 | 13d | 1 | 0.61mi |
| 2739 Gilmore Ln Unit 4 Oroville, CA | 2.0 | 1.0 | 720 | $1,595 | $2.22 | 13d | 1 | 0.61mi |
| 2737 Gilmore Ln Unit 1 Oroville, CA | 2.0 | 1.0 | 720 | $1,595 | $2.22 | 13d | 1 | 0.62mi |
| 331 Bonite St Oroville, CA | 2.0 | 1.0 | 672 | $1,450 | $2.16 | 21d | 1 | 1.10mi |
| 2850 Myers St Oroville, CA | 3.0 | 2.0 | 1095 | $2,200 | $2.01 | 13d | 1 | 1.17mi |
| 85 Tuscan Villa Dr Oroville, CA | 2.0 | 1.0–1.5 | 915 | $1,425 | $1.56 | 13d | 7 | 1.26mi |
| 3250 Spencer Ave Oroville, CA | 3.0 | 1.0 | 900 | $1,400 | $1.56 | 13d | 1 | 1.28mi |
| 2127 B St Oroville, CA | 3.0 | 2.0 | 980 | $1,400 | $1.43 | 13d | 1 | 1.32mi |
| 1150 Pine St Unit 02 Oroville, CA | 2.0 | 1.0 | 800 | $1,095 | $1.37 | 21d | 1 | 1.38mi |
| 1331 Pomona Ave Unit 4 Oroville, CA | 2.0 | 1.0 | 673 | $1,075 | $1.60 | 13d | 1 | 1.43mi |
| 1355 Safford St Oroville, CA | 2.0 | 1.0 | 826 | $1,500 | $1.82 | 13d | 1 | 1.48mi |
Listing history 12 events
-
2026-06-19days on market $29,995 Active 16 DOM
-
2026-06-18days on market $29,995 Active 15 DOM
-
2026-06-17days on market $29,995 Active 14 DOM
-
2026-06-16days on market $29,995 Active 13 DOM
-
2026-06-15days on market $29,995 Active 12 DOM
-
2026-06-14days on market $29,995 Active 10 DOM
-
2026-06-13days on market $29,995 Active 9 DOM
-
2026-06-10days on market $29,995 Active 7 DOM
-
2026-06-09days on market $29,995 Active 6 DOM
-
2026-06-08days on market $29,995 Active 5 DOM
-
2026-06-07remarks 227-char remark
-
2026-06-07$29,995 Active 4 DOM
ⓘ Source: listings_history table (triggers on properties + properties_extension) + one-shot
backfill from property_details.listing_events for pre-trigger history.
Tax reassessment forecast CA · Resets to sale price
- Current annual tax
- $286 · $24/mo
- Projected year-2 tax
- $286 · $24/mo
- Expected delta
- $0/yr ($0/mo · 0.0%)
ⓘ Screening estimate from a state-policy table — verify with the county assessor before closing.
Climate risk First Street
- Flood 5/10 Major FEMA zone X (unshaded) · 66% chance over 30 yrs
- Wildfire 9/10 Extreme
- Heat 7/10 Severe 7 d/yr ≥105°F today · 16 d/yr by 30 yrs out
- Wind 1/10 Low
- Air quality 10/10 Extreme 29 unhealthy d/yr today · 36 by 30 yrs out
Nearby sold comps map
Loading sold comps map…
Walkable amenities ~0.75 mi
Loading nearby amenities…
Taxation est. · year 1
- Rental income
- $17,760
- − Mortgage interest
- −$1,680
- − Property taxes
- −$286
- − Insurance
- −$150
- − Repairs & maintenance
- −$1,421
- − Management
- −$1,421
- − Depreciation
- −$873
- Taxable income
- $11,930
- Est. tax owed @ 24.0%
- −$2,863
- After-tax cash flow
- $8,844/yr
For passive investors: Depreciation is non-cash, so a rental often shows a tax loss while cash-flowing — sheltering income. Rental losses are passive: they offset passive income freely, and up to $25,000/yr can offset ordinary (W-2) income if you actively participate and your MAGI is under $100k (phasing out to $0 by $150k); unused losses carry forward. On sale, claimed depreciation is recaptured at up to 25%, and gains may owe capital-gains tax (a 1031 exchange can defer both). Figures are a year-1 estimate at your 24.0% rate — not tax advice; consult a CPA.
Schools (NCES district)
- District
- Oroville Union High
- NCES district ID
- 0629130
- Math proficiency
- 19% ▼ -2.00%
- Reading proficiency
- 49% ▼ -4.00%
- Median HH income
- $38,085
- Composite
- 28.26/100
- National rank
- #6794
- State rank
- #300 of 517 in CA
Livability — Oroville
- Score
- 50/100
- State rank
- #1136
- US rank
- #25715
Category grades
Schools grade is shown separately in the Schools card above.
Census & demographics
- Census place
- Oroville, CA
- County
- Butte County · 175,030 people
- City population
- 49,684
- Metro
- Chico, CA
- Population (ZIP)
- 28,503
- Household income
- $65,586
- Rent vs Own
- Severe rent burden
- 807.0
Population outlook (Butte County) Hauer SSP2
- Today (2025)
- 237,527 people
- By 2030
- 243,804 · +2.6%
- By 2040
- 253,899 · +6.9%
- By 2050
- 262,561 · +10.5%
- By 2075
- 283,709 · +19.4%
- By 2100
- 282,689 · +19.0%
Race, ethnicity, and origin ACS 2023
- Neighborhood character
- Predominantly White (67%)
- Race & ethnicity
- White 67% Hispanic / Latino 18% Two or more races 14% Asian 6% Native American 2% Black 2%
- Hispanic origin (detail)
- Mexican 16%
- Common ancestry
- Lithuanian 3% Slovak 3% Portuguese 2%
- Foreign-born
- 6% · Canada
- Languages at home
- 88% English-only · Spanish 7% Other Asian/Pacific 3% Russian/Polish/Slavic 1%
Political lean MEDSL · Butte
- 2024 margin
- Toss-up / Even · D 46.8% · R 49.9% · Other 3.3%
- 2008→2024 swing
- -5.5pp toward R · 2008: 2.4pp · 2024: -3.1pp
- All cycles
- 2024: R+3.1 2020: D+1.7 2016: R+4.0 2012: R+3.9 2008: D+2.4
Not yet ingested
- Civics
- —
Market trends
- HPI YoY
- ▼ -284.58%
- Current HPI
- 267.1415
- Rent YoY
- —
- Metro
- Chico, CA
- State GDP YoY
- ▲ 3.21%
- F500 in state
- 116
Industry mix (Fortune 500 HQ in CA)
| Industry | F500 HQs | Revenue |
|---|---|---|
| Technology | 27 | $1,492B |
|
||
| Financial Services | 3 | $174B |
|
||
| Retail | 3 | $44B |
|
||
| Insurance | 3 | $26B |
|
||
| Media / Entertainment | 2 | $115B |
|
||
| Pharmaceuticals / Biotech | 2 | $62B |
|
||
Property tax history
+5.3%/yrLatest (2025): $286 · +1.0% YoY. Source: county tax records.
Cash-flow waterfall
monthlySold comps — $/sqft
last 12 mo · ≤1 miLoading sold comps…