 🔨 Auction
33 Bending Oak Dr · Granville South, OH
Flood risk 1/10 · Minimal
- FEMA flood zone
- X (unshaded)
- Chance of flooding over 30 yrs
- 0.0%
- Est. flood insurance / yr
- $473 – $860
Fire risk 1/10 · Minimal
- Est. fire insurance / yr
- $713 – $1,323
Heat risk 3/10 · Minor
- Hot days now (above 98°F)
- 7 days/yr
- Hot days in 30 yrs
- 18 days/yr
Wind risk 2/10 · Minimal
- Chance of severe wind over 30 yrs
- 1.0%
Air-quality risk 2/10 · Minimal
- Unhealthy air days now
- 1 days/yr
- Unhealthy air days in 30 yrs
- 2 days/yr
Risk factors via First Street. Map © Google.
Why this score? — see what drove the F grade
The composite is a weighted blend of 9 inputs, each scored 0–100. Each bar is that input's sub-score; the figure is the points it added to the 100-point composite (weight × sub-score).
- Schools +7.6/10.0
- ARV discount +7.5/15.0
- Livability +3.5/5.0
- Rent growth +2.5/5.0
- Condition / age +2.5/5.0
- Cash flow +2.2/30.0
- 1% rule +0.0/10.0
- DSCR +0.0/10.0
- Appreciation +0.0/10.0
$1
🖨 Deal sheet 📄 Offer letter ✓ Due diligence
Listing remarks
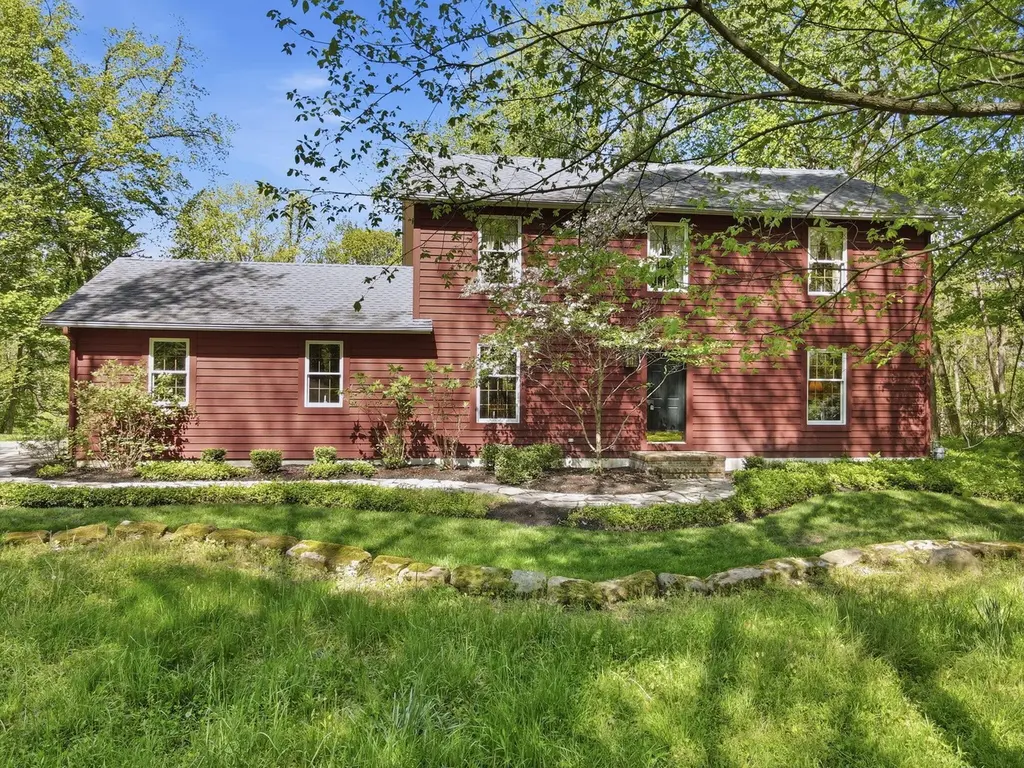
Disregard any price shown. This property is being sold at live public auction with online bidding available. Set on nearly 3 private wooded acres in Granview Woods, this 4BR, 2.5BA two-story home offers 2,256+/- sq. ft. of finished living area per Auditor, built in 1990. Features include a beamed family room with brick fireplace and custom built-ins, updated kitchen with gas cooktop and double wall oven, renovated primary suite with jetted soaking tub and double vanity, 310 sq. ft. screened porch, open deck, covered lower patio, full walk-out basement, main-floor laundry, and 2-car garage. One of the largest lots in the neighborhood. Minutes from Granville Village and Denison University. He
Key facts
- Gas cooktop
- Brick fireplace
- Custom built-ins
Tags
Property features AI
Finance
- Other: Property listed via auction and standard listing
Exterior
- Parking: Attached 2-car garage with side load and garage door opener
- Utilities: Private sewer; Well water
- Home design: Single-family residence; Two stories; Built in 1990; No common walls
- Construction: Poured foundation
- Exterior features: Patio; Deck; Ravine lot; Wooded lot
Interior
- Flooring: Wood floors; Carpet; Ceramic/porcelain tile
- Bathrooms: Two full bathrooms; One half bathroom (2.5 total)
- Heating & cooling: Forced-air heating; Central air conditioning
- Interior features: Central vacuum; Insulated windows; Basement; One gas-log fireplace
Neighborhood map
What this means for you Summary
Snapshot
- This is a 4-bed/2.5-bath single-family listed at $1.
Deal economics
- At list price, monthly cash flow is $-1k ($-15k/yr) — negative.
- The deal already cash-flows at list — no discount required.
- Meets the 1% rule at list price ($1k rent vs $1).
Location & tenants
- Location reads 70/100 on livability (#478 in OH) — a middle-class / working-renter tenant base. Strengths: crime A+, employment A+, housing A+; Watch: amenities F, commute F, health & safety F.
- Granville Exempted Village (suburban): math 85% / reading 85% proficiency, ranked #12 of 656 in OH (top 2%) — strong family-tenant draw, lease renewals of 3-5y typical; only 7% free/reduced lunch — higher-income household profile.
- Market conditions: 59 active listings in the ZIP; high-income renter base; 159 units permitted in Licking County in 2024 (0 in 5+ unit buildings).
- This rent is only 13% of the median local income ($136k/yr) — well below the 30% rent-burden line; pricing power to push rent on renewal without tenant pushback.
Forward outlook
- Local home prices are declining (-3.0%/yr); year-one equity from $2k of loan paydown is wiped out by about $10k of value loss. Plan a longer hold.
Negotiation context
- It's been on market 18 days — a 2% lower offer ($0) is reasonable based on typical stale-listing flexibility.
Risks & watch-outs
- Watch-outs: property tax is 517752.0% of price.
Questions for the listing agent
- What do current leases actually rent for vs. the listed asking? Can we see a recent rent roll and the last 12 months of T-12 income?
- Property tax is high relative to price — has the assessment been appealed recently, and will the sale trigger a re-assessment?
- Is there a deadline driving the sale (1031 exchange, divorce, estate, relocation)? That informs how much negotiation room exists.
- The area grade is low — what's the realistic commute time and amenity access for the typical tenant pool here? Any planned neighborhood developments (good or bad) we should know about?
- What's the average days-on-market for RENTAL listings here right now (not sales)? A rising rental-DOM trend means longer vacancies and softer asking-rent achievability than the comps imply.
- What's the recent tenant-quality profile in this submarket — average credit score on applications, eviction rate, late-payment / NSF rate, and stable-employment percentage? A property-management company in the area should have these aggregated.
- How much new for-sale + rental construction is in the pipeline within 1–3 miles? Heavy new supply typically softens prices + rents 12–24 months out; constrained supply supports both.
Investment metrics
- 1% rule
- 0.42% ✗
- Cap rate
- 1.95%
- Cash-on-cash
- -15.50%
- DSCR
- 0.31
- GRM
- 20.0
CMA / ARV
- ARV (on-the-fly)
- $345,168
- Comps found
- 1
Show comp detail 1 sale within ~0.75 mi
| Address | Dist | Beds/Ba | Sqft | Sold | Price | $/sf | Match |
|---|---|---|---|---|---|---|---|
| 66 Trenton Cir | 0.68mi | 3/2.0 (-1) | 2,120 (-6%) | 21mo | $325,000 | $153 | 34 |
Match score weights: distance 35% · size 25% · config 20% · recency 20%. Top-matched comps best support the ARV.
Projected returns pro-forma
-3.0% appreciation · 3.0% rent growth · sell at horizon
- IRR
- -46.3%
- Equity multiple
- -0.40×
- Total profit
- $-135,422
- Equity at exit
- $51,466
- IRR
- -86.4%
- Equity multiple
- -1.28×
- Total profit
- $-220,219
- Equity at exit
- $29,844
Cash invested: $96,647 (down + closing). Projections, not guarantees.
Landlord ↔ Tenant lean methodology
- Overall (STATE)
- 73 Landlord-Friendly
- State Ohio
- 73 Landlord-Friendly · R+6
- County
- — inherits STATE
- City
- — inherits STATE
ZIP-level market 43023
- Active inventory
- 59
Monthly cashflow live
- Estimated rent
- $1,439 medium interval (Pro) →
- Mortgage (P&I)
- −$1,810
- Tax est. 1.5%
- −$431 /mo · $5,178/yr
- Insurance
- −$144
- HOA
- −$0
- Vacancy / Maint / Mgmt
- −$302
- Net cashflow
- $-1,248
Break-even live
UW: 25.0% down · 7.5% · 30yr · 1.5% tax · 5.0% vac · 8.0% maint · 8.0% mgmt
Financing live
Cash to close
- Down payment
- $86,292
- Closing costs
- $10,355
- Reserves months
- —
- Total cash needed
- —
Loan-product check · same deal, 3 products live
Conventional
25% down · 7.5% · 30yr
- Down + closing
- —
- Monthly P&I
- —
- Monthly cashflow
- —
- DSCR
- —
- Eligible?
- —
Personal DTI + credit; lowest rate.
DSCR
20% down · 8.5% · 30yr
- Down + closing
- —
- Monthly P&I
- —
- Monthly cashflow
- —
- DSCR
- —
- Eligible?
- —
No personal income docs; deal must DSCR.
Hard money
10% down · 12.0% · 12mo
- Down + closing
- —
- Monthly P&I
- —
- Monthly cashflow
- —
- DSCR
- —
- Eligible?
- —
Short-term bridge; refi at stabilization.
Listing history 6 events
-
2026-06-07statusdays on market $1 Pending 18 DOM
-
2026-06-03days on market $1 Active 16 DOM
-
2026-06-02days on market $1 Active 15 DOM
-
2026-06-01days on market $1 Active 14 DOM
-
2026-05-31days on market $1 Active 13 DOM
-
2026-05-18$1 Active
ⓘ Source: listings_history table (triggers on properties + properties_extension) + one-shot
backfill from property_details.listing_events for pre-trigger history.
Climate risk First Street
- Flood 1/10 Low FEMA zone X (unshaded) · 0% chance over 30 yrs
- Wildfire 1/10 Low
- Heat 3/10 Moderate 7 d/yr ≥98°F today · 18 d/yr by 30 yrs out
- Wind 2/10 Low 100% chance of damaging wind over 30 yrs
- Air quality 2/10 Low 1 unhealthy d/yr today · 2 by 30 yrs out
Nearby sold comps map
Loading sold comps map…
Walkable amenities ~0.75 mi
Loading nearby amenities…
Taxation est. · year 1
- Rental income
- $17,270
- − Mortgage interest
- −$19,335
- − Property taxes
- −$5,178
- − Insurance
- −$1,726
- − Repairs & maintenance
- −$1,382
- − Management
- −$1,382
- − Depreciation
- −$10,041
- Taxable loss
- −$21,772
- Est. tax savings @ 24.0%
- +$5,225
- After-tax cash flow
- $-9,756/yr
For passive investors: Depreciation is non-cash, so a rental often shows a tax loss while cash-flowing — sheltering income. Rental losses are passive: they offset passive income freely, and up to $25,000/yr can offset ordinary (W-2) income if you actively participate and your MAGI is under $100k (phasing out to $0 by $150k); unused losses carry forward. On sale, claimed depreciation is recaptured at up to 25%, and gains may owe capital-gains tax (a 1031 exchange can defer both). Figures are a year-1 estimate at your 24.0% rate — not tax advice; consult a CPA.
Schools (NCES district)
- District
- Granville Exempted Village
- NCES district ID
- 3904539
- Math proficiency
- 85% ▼ -6.00%
- Reading proficiency
- 85% ▼ -3.00%
- Median HH income
- $97,827
- Composite
- 76.38/100
- National rank
- #108
- State rank
- #12 of 656 in OH
Livability — Granville South
- Score
- 70/100
- State rank
- #478
- US rank
- #7961
Category grades
Schools grade is shown separately in the Schools card above.
Census & demographics
- County
- Licking · 160,960 people
- Metro
- Columbus, OH
- Population (ZIP)
- 15,772
- Household income
- $136,127
- Rent vs Own
- Severe rent burden
- 10.2
Population outlook (Licking County) Hauer SSP2
- Today (2025)
- 178,210 people
- By 2030
- 180,917 · +1.5%
- By 2040
- 183,885 · +3.2%
- By 2050
- 182,985 · +2.7%
- By 2075
- 178,377 · +0.1%
- By 2100
- 161,075 · -9.6%
Race, ethnicity, and origin ACS 2023
- Neighborhood character
- Predominantly White (90%)
- Race & ethnicity
- White 90% Asian 5% Two or more races 4% Hispanic / Latino 2%
- Common ancestry
- Slovak 4% Italian 4% Romanian 3%
- Foreign-born
- 6% · China, Vietnam, Canada
- Languages at home
- 94% English-only · Chinese 2% Spanish 1% Vietnamese 1%
Political lean MEDSL · Licking
- 2024 margin
- Solid R (+30.0) · D 34.5% · R 64.6%
- 2008→2024 swing
- -14.2pp toward R · 2008: -15.8pp · 2024: -30.0pp
- All cycles
- 2024: R+30.0 2020: R+28.1 2016: R+28.9 2012: R+14.7 2008: R+15.8
Not yet ingested
- Civics
- —
Market trends
- HPI YoY
- ▼ -202.03%
- Current HPI
- 233.5712
- Rent YoY
- —
- Metro
- —
- State GDP YoY
- ▲ 1.98%
- F500 in state
- 48
Industry mix (Fortune 500 HQ in OH)
| Industry | F500 HQs | Revenue |
|---|---|---|
| Insurance | 3 | $145B |
|
||
| Industrial Machinery | 3 | $49B |
|
||
| Financial Services | 3 | $24B |
|
||
| Consumer Goods | 2 | $93B |
|
||
| Aerospace / Defense | 2 | $47B |
|
||
| Utilities | 2 | $33B |
|
||
Property tax history
+1.5%/yrLatest (2025): $6,615 · +2.8% YoY. Source: county tax records.
Cash-flow waterfall
monthlySold comps — $/sqft
last 12 mo · ≤1 miLoading sold comps…