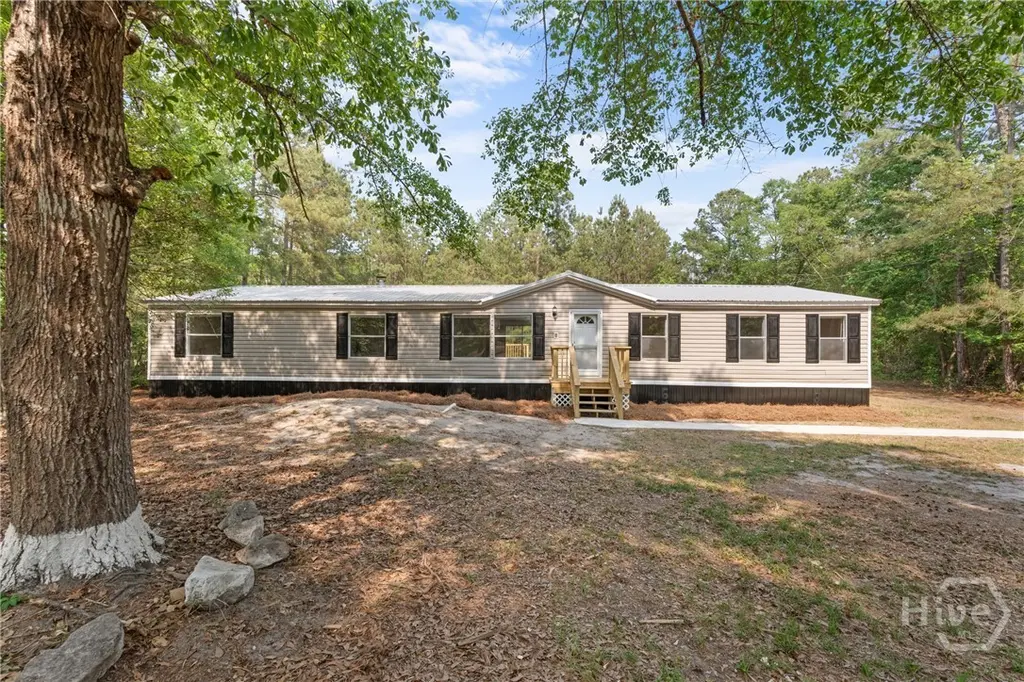
1580 Clyo Kildare Rd · Springfield, GA
Flood risk 1/10 · Minimal
- FEMA flood zone
- X (unshaded)
- Chance of flooding over 30 yrs
- 0.0%
- Est. flood insurance / yr
- $507 – $1,088
Fire risk 4/10 · Minor
- Est. fire insurance / yr
- $963 – $1,789
Heat risk 8/10 · Major
- Hot days now (above 109°F)
- 7 days/yr
- Hot days in 30 yrs
- 18 days/yr
Wind risk 8/10 · Major
- Chance of severe wind over 30 yrs
- 80.0%
Air-quality risk 2/10 · Minimal
- Unhealthy air days now
- 2 days/yr
- Unhealthy air days in 30 yrs
- 2 days/yr
Risk factors via First Street. Map © Google.
Why this score? — see what drove the B- grade
The composite is a weighted blend of 9 inputs, each scored 0–100. Each bar is that input's sub-score; the figure is the points it added to the 100-point composite (weight × sub-score).
- Cash flow +24.0/30.0
- Appreciation +10.0/10.0
- DSCR +7.7/10.0
- ARV discount +7.5/15.0
- 1% rule +5.1/10.0
- Schools +4.3/10.0
- Livability +3.5/5.0
- Rent growth +2.5/5.0
- Condition / age +2.5/5.0
$269,900
🖨 Deal sheet 📄 Offer letter ✓ Due diligence
Listing remarks
BACK ON THE MARKET AT NO FAULT TO THE SELLER. Fully renovated 4-bedroom, 2-bathroom home with 2,240 Square feet on 2 acres in Effingham County! This move-in ready property features a permanent foundation and has been completely updated with a new roof, new HVAC system, updated flooring, fresh paint, and modern finishes throughout. Enjoy the space and privacy of country living with plenty of room for outdoor activities, expansion, or simply relaxing on your own land. Conveniently located with easy access to Rincon, Springfield, and Savannah, this property offers the perfect balance of quiet living and accessibility. FHA and VA eligible with a permanent foundation. Don’t miss your chanc
Key facts
- Fresh paint
- Permanent foundation
- Modern finishes
Tags
Property features AI
Exterior
- Utilities: Private well water; Septic system
- Home design: Manufactured home; Single-story; No shared/common walls
- Construction: Vinyl siding; 2-acre lot
- Exterior features: Metal roof; Property offers a view; Underground utilities
Interior
- Bathrooms: 2 full bathrooms
- Heating & cooling: Central heating (electric); Central air conditioning (electric)
- Interior features: Wood-burning stove fireplace in the living room; Electric water heater
- Laundry & utility: Dedicated laundry room
Neighborhood map
What this means for you Summary
Snapshot
- This is a 4-bed/2.0-bath manufactured listed at $270k.
Deal economics
- At list price, monthly cash flow is $530 ($6k/yr) — positive.
- The deal already cash-flows at list — no discount required.
- Meets the 1% rule at list price ($3k rent vs $270k).
- Recommended offer: $266k (1.5% below list) — sets the bar for market timing.
- Cap rate 8.6% vs local median 4.2% in Springfield — top-decile yield for the area; either an underpriced asset or a hidden risk that comps aren't pricing in. Stress-test before assuming the spread holds.
Location & tenants
- Location reads 69/100 on livability (#116 in GA) — a middle-class / working-renter tenant base. Strengths: cost of living A+, housing A+, crime A; Watch: employment C-, schools D-, amenities F.
- Effingham County (rural): math 49% / reading 48% proficiency, ranked #16 of 174 in GA (top 9%) — families likely to look elsewhere, expect single-tenant / working-renter base with shorter leases.
- Market conditions: 13 active listings in the ZIP; 836 units permitted in Effingham County in 2024 (46 in 5+ unit buildings).
Forward outlook
- In year one you build about $29k of equity ($2k loan paydown + $27k appreciation (10.0% local appreciation)).
- Effingham County population projected at +33% by 2050 — long-run rental-demand tailwind backs the buy-and-hold thesis.
- At projected returns (10.0% appreciation + 3.0% rent growth), your $76k cash investment doubles in ~3 years — after that, you're playing with house money.
- By year 2, paydown + projected appreciation supports a ~$46k cash-out refi (75% LTV) — recoverable capital for the next deal without selling this one.
Negotiation context
- It's been on market 27 days — a 2% lower offer ($266k) is reasonable based on typical stale-listing flexibility.
- 3 sale attempts since 13y ago with the ask held roughly flat each time — persistent listings suggest the price (not the market) is what's stuck; bring a comps-based counter.
- Current owner paid $67k; list at $270k implies a 303% gain — meaningful room to come down on a strong offer.
Risks & watch-outs
- Climate carrying-cost: severe wind risk, 80% chance of damaging wind over 30y; extreme-heat days projected 7→18/yr by 2055 (HVAC capex compounding) — expect insurance premiums to compound above CPI over the hold.
Questions for the listing agent
- Is there a deadline driving the sale (1031 exchange, divorce, estate, relocation)? That informs how much negotiation room exists.
- Schools are D-rated, which usually means shorter tenancies and higher turnover. Who's the typical renter profile here, and what's been the actual vacancy rate?
- What's the average days-on-market for RENTAL listings here right now (not sales)? A rising rental-DOM trend means longer vacancies and softer asking-rent achievability than the comps imply.
- What's the recent tenant-quality profile in this submarket — average credit score on applications, eviction rate, late-payment / NSF rate, and stable-employment percentage? A property-management company in the area should have these aggregated.
- How much new for-sale + rental construction is in the pipeline within 1–3 miles? Heavy new supply typically softens prices + rents 12–24 months out; constrained supply supports both.
Investment metrics
- 1% rule
- 1.01% ✓
- Cap rate
- 8.65%
- Cash-on-cash
- 8.41%
- DSCR
- 1.37
- GRM
- 8.2
CMA / ARV
No comps found within radius.
Projected returns pro-forma
10.0% appreciation · 3.0% rent growth · sell at horizon
- IRR
- 30.4%
- Equity multiple
- 3.39×
- Total profit
- $180,617
- Equity at exit
- $243,147
- IRR
- 26.3%
- Equity multiple
- 7.68×
- Total profit
- $505,155
- Equity at exit
- $524,356
Cash invested: $75,572 (down + closing). Projections, not guarantees.
Landlord ↔ Tenant lean methodology
- Overall (STATE)
- 90 Strongly Landlord-Friendly
- State Georgia
- 90 Strongly Landlord-Friendly · R+3
- County
- — inherits STATE
- City
- — inherits STATE
ZIP-level market 31303
- Home prices YoY
- 10.3%
- Active inventory
- 13
- Price-to-rent
- 8.2×
Monthly cashflow live
- Estimated rent
- $2,730 medium interval (Pro) →
- Mortgage (P&I)
- −$1,415
- Tax from tax record
- −$100 /mo · $1,196/yr
- Insurance
- −$112
- HOA
- −$0
- Vacancy / Maint / Mgmt
- −$573
- Net cashflow
- $530
Break-even live
UW: 25.0% down · 7.5% · 30yr · 1.5% tax · 5.0% vac · 8.0% maint · 8.0% mgmt
Financing live
Cash to close
- Down payment
- $67,475
- Closing costs
- $8,097
- Reserves months
- —
- Total cash needed
- —
Loan-product check · same deal, 3 products live
Conventional
25% down · 7.5% · 30yr
- Down + closing
- —
- Monthly P&I
- —
- Monthly cashflow
- —
- DSCR
- —
- Eligible?
- —
Personal DTI + credit; lowest rate.
DSCR
20% down · 8.5% · 30yr
- Down + closing
- —
- Monthly P&I
- —
- Monthly cashflow
- —
- DSCR
- —
- Eligible?
- —
No personal income docs; deal must DSCR.
Hard money
10% down · 12.0% · 12mo
- Down + closing
- —
- Monthly P&I
- —
- Monthly cashflow
- —
- DSCR
- —
- Eligible?
- —
Short-term bridge; refi at stabilization.
Listing history 20 events
-
2026-06-15status $269,900 Pending 27 DOM
-
2026-06-15days on market $269,900 Active 27 DOM
-
2026-06-14days on market $269,900 Active 25 DOM
-
2026-06-13days on market $269,900 Active 24 DOM
-
2026-06-10days on market $269,900 Active 22 DOM
-
2026-06-09days on market $269,900 Active 21 DOM
-
2026-06-08days on market $269,900 Active 20 DOM
-
2026-06-07days on market $269,900 Active 19 DOM
-
2026-06-05days on market $269,900 Active 16 DOM
-
2026-06-03days on market $269,900 Active 15 DOM
-
2026-06-02days on market $269,900 Active 14 DOM
-
2026-06-01days on market $269,900 Active 13 DOM
-
2026-05-31days on market $269,900 Active 12 DOM
-
2026-05-30days on market $269,900 Active 11 DOM
-
2026-05-23status Active
-
2026-04-28status Pending
-
2026-04-24$269,900 Active
-
2025-05-13soldstatus $67,000
-
2014-01-01historical
-
2013-01-28$45,000
ⓘ Source: listings_history table (triggers on properties + properties_extension) + one-shot
backfill from property_details.listing_events for pre-trigger history.
Tax reassessment forecast GA · Resets to sale price
- Current annual tax
- $1,196 · $100/mo
- Projected year-2 tax
- $2,483 · $207/mo
- Expected delta
- +$1,287/yr (+$107/mo · 107.6%)
ⓘ Screening estimate from a state-policy table — verify with the county assessor before closing.
Climate risk First Street
- Flood 1/10 Low FEMA zone X (unshaded) · 0% chance over 30 yrs
- Wildfire 4/10 Moderate
- Heat 8/10 Severe 7 d/yr ≥109°F today · 18 d/yr by 30 yrs out
- Wind 8/10 Severe 80% chance of damaging wind over 30 yrs
- Air quality 2/10 Low 2 unhealthy d/yr today · 2 by 30 yrs out
Nearby sold comps map
Loading sold comps map…
Walkable amenities ~0.75 mi
Loading nearby amenities…
Taxation est. · year 1
- Rental income
- $32,766
- − Mortgage interest
- −$15,119
- − Property taxes
- −$1,196
- − Insurance
- −$1,350
- − Repairs & maintenance
- −$2,621
- − Management
- −$2,621
- − Depreciation
- −$7,852
- Taxable income
- $2,007
- Est. tax owed @ 24.0%
- −$482
- After-tax cash flow
- $5,873/yr
For passive investors: Depreciation is non-cash, so a rental often shows a tax loss while cash-flowing — sheltering income. Rental losses are passive: they offset passive income freely, and up to $25,000/yr can offset ordinary (W-2) income if you actively participate and your MAGI is under $100k (phasing out to $0 by $150k); unused losses carry forward. On sale, claimed depreciation is recaptured at up to 25%, and gains may owe capital-gains tax (a 1031 exchange can defer both). Figures are a year-1 estimate at your 24.0% rate — not tax advice; consult a CPA.
Schools (NCES district)
- District
- Effingham County
- NCES district ID
- 1301980
- Math proficiency
- 49% ▼ -6.00%
- Reading proficiency
- 48% ▼ -5.00%
- Median HH income
- $60,503
- Composite
- 42.56/100
- National rank
- #3195
- State rank
- #16 of 174 in GA
Livability — Springfield
- Score
- 69/100
- State rank
- #116
- US rank
- #8573
Category grades
Schools grade is shown separately in the Schools card above.
Census & demographics
- Population (ZIP)
- 2,056
Population outlook (Effingham County) Hauer SSP2
- Today (2025)
- 67,399 people
- By 2030
- 72,297 · +7.3%
- By 2040
- 81,602 · +21.1%
- By 2050
- 89,494 · +32.8%
- By 2075
- 105,976 · +57.2%
- By 2100
- 111,943 · +66.1%
Race, ethnicity, and origin ACS 2023
- Neighborhood character
- Predominantly White (79%)
- Race & ethnicity
- White 79% Black 20%
- Common ancestry
- Lithuanian 4% Iranian 2% Danish 1%
Political lean MEDSL · Effingham
- 2024 margin
- Solid R (+49.1) · D 25.2% · R 74.3%
- 2008→2024 swing
- +1.6pp toward D · 2008: -50.7pp · 2024: -49.1pp
- All cycles
- 2024: R+49.1 2020: R+49.5 2016: R+55.6 2012: R+51.2 2008: R+50.7
Not yet ingested
- Civics
- —
Market trends
- HPI YoY
- ▲ 26.48%
- Current HPI
- 284.5809
- Rent YoY
- —
- Metro
- —
- State GDP YoY
- ▲ 2.66%
- F500 in state
- 28
Industry mix (Fortune 500 HQ in GA)
| Industry | F500 HQs | Revenue |
|---|---|---|
| Paper / Packaging | 2 | $29B |
|
||
| Retail | 1 | $160B |
|
||
| Transportation / Logistics | 1 | $91B |
|
||
| Airlines | 1 | $62B |
|
||
| Consumer Goods | 1 | $47B |
|
||
| Utilities | 1 | $25B |
|
||
Price history
+499.8% since first listed6 events — show timeline
- 2026-05-23 Relisted — Hive MLS
- 2026-04-28 Pending — Hive MLS
- 2026-04-24 Listed $269,900 Hive MLS
- 2025-05-13 Sold (Public Records) $67,000 Public Records
- 2014-01-01 Listing Removed — Hive MLS
- 2013-01-28 Listed $45,000 Hive MLS
Property tax history
+0.5%/yrLatest (2025): $1,196 · +56.5% YoY. Source: county tax records.
Cash-flow waterfall
monthlySold comps — $/sqft
last 12 mo · ≤1 miLoading sold comps…