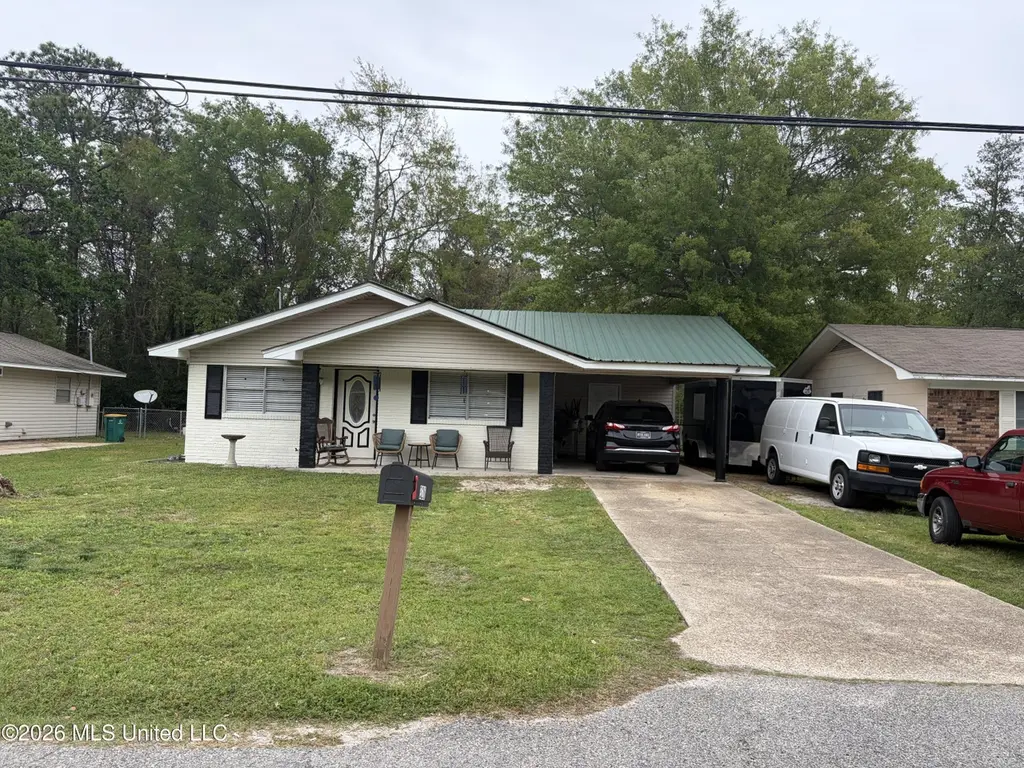
320 Lawler Ave · Long Beach, MS
Flood risk 1/10 · Minimal
- FEMA flood zone
- X (unshaded)
- Chance of flooding over 30 yrs
- 0.0%
- Est. flood insurance / yr
- $507 – $1,088
Fire risk 1/10 · Minimal
- Est. fire insurance / yr
- $1,241 – $2,305
Heat risk 10/10 · Severe
- Hot days now (above 106°F)
- 7 days/yr
- Hot days in 30 yrs
- 23 days/yr
Wind risk 9/10 · Severe
- Chance of severe wind over 30 yrs
- 99.0%
Air-quality risk 1/10 · Minimal
- Unhealthy air days now
- 0 days/yr
- Unhealthy air days in 30 yrs
- 0 days/yr
Risk factors via First Street. Map © Google.
Why this score? — see what drove the C grade
The composite is a weighted blend of 9 inputs, each scored 0–100. Each bar is that input's sub-score; the figure is the points it added to the 100-point composite (weight × sub-score).
- Cash flow +20.8/30.0
- ARV discount +10.9/15.0
- DSCR +6.6/10.0
- 1% rule +4.8/10.0
- Schools +4.4/10.0
- Livability +3.5/5.0
- Rent growth +3.0/5.0
- Condition / age +2.5/5.0
- Appreciation +0.0/10.0
$142,495
🖨 Deal sheet (PDF) 📄 Offer letter ✓ Due diligence
Listing remarks MLS
Recent upgrades include ceramic tile flooring throughout, HVAC system, water heater, and remodeled kitchen and bathrooms. A metal roof and wall unit in the bonus room are currently being installed. The 16' x 12' bonus room offers flexible use and can easily be connected to the primary bedroom with an interior door or kept separate with its existing exterior access. Additional features include a 12' x 16' carport, 12' x 7' utility room, and an 18' x 3.5' front porch, bringing the total space under roof to approximately 1,560 square feet. Tenants are ready to vacate within 30 days--schedule your appointment today!
Key facts
- Metal roof
- Water heater
- Remodeled kitchen
Tags
Neighborhood map
What this means for you Summary
Snapshot
- This is a 3-bed/1.5-bath single-family listed at $142k.
Deal economics
- At list price, monthly cash flow is $195 ($2k/yr) — positive.
- The deal already cash-flows at list — no discount required.
- To meet the 1% rule (rent ≥ 1% of price), the offer needs to be $140k (1.9% below list).
- Recommended offer: $134k (6.0% below list) — sets the bar for market timing.
- Cap rate 7.9% vs local median 4.6% in Long Beach — top-decile yield for the area; either an underpriced asset or a hidden risk that comps aren't pricing in. Stress-test before assuming the spread holds.
Location & tenants
- Location reads 69/100 on livability (#52 in MS) — a middle-class / working-renter tenant base. Strengths: crime A+, cost of living A+, housing A+; Watch: amenities F, commute F, health & safety F.
- Long Beach School District (suburban): math 52% / reading 50% proficiency, ranked #9 of 130 in MS (top 7%) — acceptable for families but not a draw, mixed tenant base, ~2y average lease.
- Market conditions: Rents rising (+1.9%/yr); 311 active listings in the ZIP; 3 comparable units currently listed for rent nearby; rentals at typical pace (median 15d on market — plan ~3-4 weeks tenant-placement turnaround); 2,194 units permitted in Harrison County in 2024 (0 in 5+ unit buildings).
Forward outlook
- Local home prices are declining (-3.0%/yr); year-one equity from $985 of loan paydown is wiped out by about $4k of value loss. Plan a longer hold.
- Harrison County population projected at +27% by 2050 — long-run rental-demand tailwind backs the buy-and-hold thesis.
Negotiation context
- It's been on market 79 days — a 6% lower offer ($134k) is reasonable based on typical stale-listing flexibility.
- 2 sale attempts since 16y ago; this cycle's ask has dropped $8k (5%) from the opening price — seller is motivated, your offer sets the floor, not the list.
Risks & watch-outs
- Climate carrying-cost: severe wind risk, 99% chance of damaging wind over 30y; extreme-heat days projected 7→23/yr by 2055 (HVAC capex compounding) — expect insurance premiums to compound above CPI over the hold.
Questions for the listing agent
- It's been on market 79 days. Have you received any prior offers? Is the seller open to a 6% concession, seller financing, or rate buy-down credit?
- Built in 1970 — when were the roof, HVAC, electrical panel, plumbing, and water heater last replaced?
- Why hasn't it sold? Are there any deal-killer items the seller is aware of (foundation, flood, title, zoning, code violations)?
- Is there a deadline driving the sale (1031 exchange, divorce, estate, relocation)? That informs how much negotiation room exists.
- Schools are B-rated — typically a magnet for longer-tenancy family renters. What's the average tenant stay here, and is there a school-zone premium baked into asking?
- What's the average days-on-market for RENTAL listings here right now (not sales)? A rising rental-DOM trend means longer vacancies and softer asking-rent achievability than the comps imply.
- What's the recent tenant-quality profile in this submarket — average credit score on applications, eviction rate, late-payment / NSF rate, and stable-employment percentage? A property-management company in the area should have these aggregated.
- How much new for-sale + rental construction is in the pipeline within 1–3 miles? Heavy new supply typically softens prices + rents 12–24 months out; constrained supply supports both.
Investment metrics
- 1% rule
- 0.98% ✗
- Cap rate
- 7.94%
- Cash-on-cash
- 5.87%
- DSCR
- 1.26
- GRM
- 8.5
CMA / ARV
- ARV (median comp)
- $154,266
- List price
- $142,495
- Delta
- -7.63%
- Verdict
- FAIR
- Comps
- 20 within 1.0 mi
Show comp detail 12 sales within ~0.75 mi
| Address | Dist | Beds/Ba | Sqft | Sold | Price | $/sf | Match |
|---|---|---|---|---|---|---|---|
| 325 Lawler Ave | 0.04mi | 3/2.0 | 1,026 (0%) | 0mo | $124,900 | $122 | 96 |
| 118 Lassere Cir | 0.34mi | 3/1.5 | 1,050 (+2%) | 0mo | $150,000 | $143 | 80 |
| 105 N Ida Ln | 0.24mi | 3/2.0 | 1,081 (+5%) | 1mo | $139,900 | $129 | 77 |
| 104 Lassere Cir | 0.26mi | 3/1.5 | 1,064 (+4%) | 15mo | $120,000 | $113 | 69 |
| 1608 Lewis Ave | 0.68mi | 3/2.0 | 1,100 (+7%) | 0mo | $115,000 | $105 | 54 |
| 914 Park Row Ave | 0.29mi | 4/2.0 (+1) | 1,137 (+11%) | 10mo | $150,000 | $132 | 53 |
| 319 Meadow Wood Cir | 0.73mi | 3/1.0 | 1,023 (-0%) | 16mo | $179,900 | $176 | 50 |
| 113 8th St | 0.44mi | 2/1.0 (-1) | 936 (-9%) | 16mo | $89,000 | $95 | 45 |
| 229 Harris Avenue Ave | 0.35mi | 2/1.0 (-1) | 914 (-11%) | 18mo | $99,000 | $108 | 43 |
| 124 S Ocean Wave Ave | 0.75mi | 2/1.0 (-1) | 960 (-6%) | 12mo | $205,000 | $214 | 37 |
| 201 S Nicholson Ave | 0.57mi | 2/2.0 (-1) | 1,154 (+12%) | 15mo | $274,000 | $237 | 33 |
| 421 E 4th St | 0.66mi | 2/2.0 (-1) | 1,176 (+15%) | 13mo | $325,000 | $276 | 27 |
Match score weights: distance 35% · size 25% · config 20% · recency 20%. Top-matched comps best support the ARV.
Projected returns pro-forma
-3.0% appreciation · 1.93% rent growth · sell at horizon
- IRR
- -8.4%
- Equity multiple
- 0.69×
- Total profit
- $-12,170
- Equity at exit
- $21,246
- IRR
- -0.3%
- Equity multiple
- 0.98×
- Total profit
- $-667
- Equity at exit
- $12,320
Cash invested: $39,899 (down + closing). Projections, not guarantees.
Landlord ↔ Tenant lean methodology
- Overall (STATE)
- 90 Strongly Landlord-Friendly
- State Mississippi
- 90 Strongly Landlord-Friendly · R+11
- County
- — inherits STATE
- City
- — inherits STATE
ZIP-level market 39560
- Home prices YoY
- -25.7%
- Rents YoY
- 1.9%
- Active inventory
- 311
- Price-to-rent
- 8.5×
Monthly cashflow live
- Estimated rent
- $1,397 medium interval (Pro) →
- Mortgage (P&I)
- −$747
- Tax from tax record
- −$102 /mo · $1,224/yr
- Insurance
- −$59
- HOA
- −$0
- Vacancy / Maint / Mgmt
- −$293
- Net cashflow
- $195
Break-even live
Sensitivity live
| Price | -10% $276 | -5% $236 | +0% $195 | +5% $155 | +10% $115 |
|---|---|---|---|---|---|
| Rent | -10% $85 | -5% $140 | +0% $195 | +5% $250 | +10% $306 |
| Rate | -1.0pp $267 | -0.5pp $231 | base $195 | +0.5pp $158 | +1.0pp $121 |
UW: 25.0% down · 7.5% · 30yr · 1.5% tax · 5.0% vac · 8.0% maint · 8.0% mgmt
Financing live
Cash to close
- Down payment
- $35,624
- Closing costs
- $4,275
- Reserves months
- —
- Total cash needed
- —
Loan-product check · same deal, 3 products live
Conventional
25% down · 7.5% · 30yr
- Down + closing
- —
- Monthly P&I
- —
- Monthly cashflow
- —
- DSCR
- —
- Eligible?
- —
Personal DTI + credit; lowest rate.
DSCR
20% down · 8.5% · 30yr
- Down + closing
- —
- Monthly P&I
- —
- Monthly cashflow
- —
- DSCR
- —
- Eligible?
- —
No personal income docs; deal must DSCR.
Hard money
10% down · 12.0% · 12mo
- Down + closing
- —
- Monthly P&I
- —
- Monthly cashflow
- —
- DSCR
- —
- Eligible?
- —
Short-term bridge; refi at stabilization.
Rent comps 3 comps
| Address | Beds | Baths | Sqft | Rent | $/sqft | DOM | Units | Dist |
|---|---|---|---|---|---|---|---|---|
| 212 Lawler Ave Long Beach, MS | 2.0 | 1.0 | 822 | $1,250 | $1.52 | 14d | 1 | 0.08mi |
| 1206 Beach Ave Gulfport, MS | 3.0 | 2.0 | 1076 | $1,500 | $1.39 | 14d | 1 | 1.02mi |
| 1412 Jo Ellen Cir Gulfport, MS | 3.0 | 1.5 | 1275 | $1,050 | $0.82 | 14d | 1 | 1.07mi |
Listing history 21 events
-
2026-06-18days on market $142,495 Active 79 DOM
-
2026-06-17days on market $142,495 Active 78 DOM
-
2026-06-16days on market $142,495 Active 77 DOM
-
2026-06-15price $142,495 Active 76 DOM
-
2026-06-15days on market $142,500 Active 76 DOM
-
2026-06-14days on market $142,500 Active 74 DOM
-
2026-06-13pricedays on market $142,500 Active 73 DOM
-
2026-06-10days on market $145,000 Active 71 DOM
-
2026-06-09days on market $145,000 Active 70 DOM
-
2026-06-08days on market $145,000 Active 69 DOM
-
2026-06-07days on market $145,000 Active 68 DOM
-
2026-06-05days on market $145,000 Active 65 DOM
-
2026-06-02days on market $145,000 Active 63 DOM
-
2026-06-01days on market $145,000 Active 62 DOM
-
2026-05-31days on market $145,000 Active 61 DOM
-
2026-05-30days on market $145,000 Active 60 DOM
-
2026-05-01price $145,000 628-char remark
Show marketing remark (628 chars)
Recent upgrades include ceramic tile flooring throughout, HVAC system, water heater, and remodeled kitchen and bathrooms. A metal roof and wall unit in the bonus room are currently being installed. The 16' x 12' bonus room offers flexible use and can easily be connected to the primary bedroom with an interior door or kept separate with its existing exterior access. Additional features include a 12' x 16' carport, 12' x 7' utility room, and an 18' x 3.5' front porch, bringing the total space under roof to approximately 1,560 square feet. Tenants are ready to vacate within 30 days--schedule your appointment today!
-
2026-03-30$150,000 Active 628-char remark
Show marketing remark (628 chars)
Recent upgrades include ceramic tile flooring throughout, HVAC system, water heater, and remodeled kitchen and bathrooms. A metal roof and wall unit in the bonus room are currently being installed. The 16' x 12' bonus room offers flexible use and can easily be connected to the primary bedroom with an interior door or kept separate with its existing exterior access. Additional features include a 12' x 16' carport, 12' x 7' utility room, and an 18' x 3.5' front porch, bringing the total space under roof to approximately 1,560 square feet. Tenants are ready to vacate within 30 days--schedule your appointment today!
-
2010-12-28soldstatus
-
2010-11-30soldstatus
-
2010-11-08$36,000
ⓘ Source: listings_history table (triggers on properties + properties_extension) + one-shot
backfill from property_details.listing_events for pre-trigger history.
Tax reassessment forecast MS · Resets to sale price
- Current annual tax
- $1,224 · $102/mo
- Projected year-2 tax
- $1,224 · $102/mo
- Expected delta
- $0/yr ($0/mo · 0.0%)
ⓘ Screening estimate from a state-policy table — verify with the county assessor before closing.
Climate risk First Street
- Flood 1/10 Low FEMA zone X (unshaded) · 0% chance over 30 yrs
- Wildfire 1/10 Low
- Heat 10/10 Extreme 7 d/yr ≥106°F today · 23 d/yr by 30 yrs out
- Wind 9/10 Extreme 99% chance of damaging wind over 30 yrs
- Air quality 1/10 Low 0 unhealthy d/yr today · 0 by 30 yrs out
Nearby sold comps map
Loading sold comps map…
Walkable amenities ~0.75 mi
Loading nearby amenities…
Taxation est. · year 1
- Rental income
- $16,767
- − Mortgage interest
- −$7,982
- − Property taxes
- −$1,224
- − Insurance
- −$712
- − Repairs & maintenance
- −$1,341
- − Management
- −$1,341
- − Depreciation
- −$4,145
- Taxable income
- $21
- Est. tax owed @ 24.0%
- −$5
- After-tax cash flow
- $2,338/yr
For passive investors: Depreciation is non-cash, so a rental often shows a tax loss while cash-flowing — sheltering income. Rental losses are passive: they offset passive income freely, and up to $25,000/yr can offset ordinary (W-2) income if you actively participate and your MAGI is under $100k (phasing out to $0 by $150k); unused losses carry forward. On sale, claimed depreciation is recaptured at up to 25%, and gains may owe capital-gains tax (a 1031 exchange can defer both). Figures are a year-1 estimate at your 24.0% rate — not tax advice; consult a CPA.
Schools (NCES district)
- District
- Long Beach School District
- NCES district ID
- 2802670
- Math proficiency
- 52% ▼ -8.00%
- Reading proficiency
- 50% ▼ -7.00%
- Median HH income
- $50,548
- Composite
- 43.68/100
- National rank
- #2955
- State rank
- #9 of 130 in MS
Livability — Long Beach
- Score
- 69/100
- State rank
- #52
- US rank
- #8554
Category grades
Schools grade is shown separately in the Schools card above.
Census & demographics
- Census place
- Long Beach, MS
- County
- Harrison County · 178,171 people
- City population
- 18,702
- Metro
- Gulfport-Biloxi, MS
- Population (ZIP)
- 18,702
- Household income
- $69,769
- Rent vs Own
- Severe rent burden
- 658.0
Population outlook (Harrison County) Hauer SSP2
- Today (2025)
- 228,444 people
- By 2030
- 241,942 · +5.9%
- By 2040
- 267,531 · +17.1%
- By 2050
- 291,062 · +27.4%
- By 2075
- 346,711 · +51.8%
- By 2100
- 378,165 · +65.5%
Race, ethnicity, and origin ACS 2023
- Neighborhood character
- Predominantly White (80%)
- Race & ethnicity
- White 80% Black 10% Two or more races 7% Hispanic / Latino 3% Asian 2%
- Common ancestry
- Lithuanian 6% Slovak 2% Serbian 1%
- Foreign-born
- 5% · Canada, South Korea
- Languages at home
- 94% English-only · Spanish 2% Other Indo-European 2% Tagalog/Filipino 1%
Political lean MEDSL · Harrison
- 2024 margin
- Strong R (+28.9) · D 35.0% · R 63.9% · Other 1.1%
- 2008→2024 swing
- -2.9pp toward R · 2008: -26.0pp · 2024: -28.9pp
- All cycles
- 2024: R+28.9 2020: R+25.2 2016: R+30.7 2012: R+26.6 2008: R+26.0
Not yet ingested
- Civics
- —
Market trends
- HPI YoY
- ▼ -67.49%
- Current HPI
- 195.0807
- Rent YoY
- ▲ 1.93%
- Metro
- Gulfport-Biloxi, MS
- State GDP YoY
- —
- F500 in state
- 0
Price history
+302.8% since first listed5 events — show timeline
- 2026-05-01 Price Changed $145,000 MLSU
- 2026-03-30 Listed $150,000 MLSU
- 2010-12-28 Sold (Public Records) — Public Records
- 2010-11-30 Sold (MLS) — MLSU
- 2010-11-08 Listed $36,000 MLSU
Property tax history
+1.4%/yrLatest (2025): $1,224 · +5.0% YoY. Source: county tax records.
Cash-flow waterfall
monthlySold comps — $/sqft
last 12 mo · ≤1 miLoading sold comps…