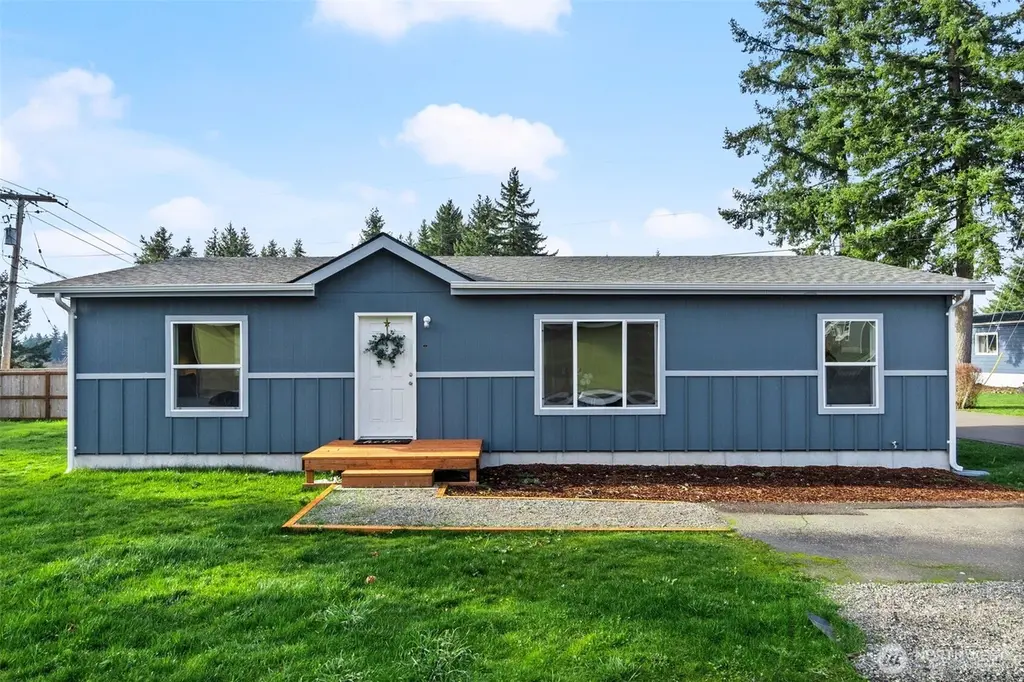
6748 Fir Tree Rd SE #15 · Lacey, WA
Flood risk 1/10 · Minimal
- FEMA flood zone
- X (unshaded)
- Chance of flooding over 30 yrs
- 0.0%
- Est. flood insurance / yr
- $507 – $1,088
Fire risk 3/10 · Minor
- Est. fire insurance / yr
- $604 – $1,122
Heat risk 3/10 · Minor
- Hot days now (above 87°F)
- 7 days/yr
- Hot days in 30 yrs
- 14 days/yr
Wind risk 1/10 · Minimal
- Chance of severe wind over 30 yrs
- —
Air-quality risk 6/10 · Moderate
- Unhealthy air days now
- 7 days/yr
- Unhealthy air days in 30 yrs
- 8 days/yr
Risk factors via First Street. Map © Google.
Why this score? — see what drove the B grade
The composite is a weighted blend of 9 inputs, each scored 0–100. Each bar is that input's sub-score; the figure is the points it added to the 100-point composite (weight × sub-score).
- Cash flow +30.0/30.0
- DSCR +10.0/10.0
- 1% rule +8.9/10.0
- ARV discount +8.0/15.0
- Schools +5.1/10.0
- Livability +4.2/5.0
- Rent growth +3.4/5.0
- Condition / age +2.5/5.0
- Appreciation +0.0/10.0
$175,000
🖨 Deal sheet (PDF) 📄 Offer letter ✓ Due diligence
Listing remarks
Experience the perfect blend of modern style and quiet comfort in this brand-new 3 bed 2 bath manufactured home. The heart of the home features an open eat-in kitchen complete with a functional island and sleek, all-new appliances. Throughout the main living areas, enjoy durable modern laminate flooring, while the living room and bedrooms offer the cozy comfort of brand-new, wall-to-wall carpet. The thoughtful split-bedroom layout ensures maximum privacy; the primary suite features a spacious walk-in closet and a private ensuite bath, while the two additional bedrooms are tucked away at the opposite end of the home. Outside, the large, partially fenced backyard offers a blank canvas with pl
Key facts
- Never-lived-in home
- Modern layout
- 5,500 sq ft lot
Tags
Neighborhood map
What this means for you Summary
Snapshot
- This is a 3-bed/2.0-bath manufactured listed at $175k.
Deal economics
- At list price, monthly cash flow is $719 ($9k/yr) — positive.
- The deal already cash-flows at list — no discount required.
- Meets the 1% rule at list price ($2k rent vs $175k).
- Recommended offer: $154k (12.0% below list) — sets the bar for market timing.
- Cap rate 11.2% vs local median 3.0% in Lacey — top-decile yield for the area; either an underpriced asset or a hidden risk that comps aren't pricing in. Stress-test before assuming the spread holds.
Location & tenants
- Location reads 85/100 on livability (#33 in WA, #581 nationally) — a professional / high-income tenant draw. Strengths: amenities A+, commute A+, housing A+; Watch: cost of living D+.
- North Thurston Public Schools (suburban): math 51% / reading 62% proficiency, ranked #80 of 291 in WA (top 28%) — acceptable for families but not a draw, mixed tenant base, ~2y average lease.
- Zoned schools: Horizons Elementary (468 students, 37% FRL); Komachin Middle School (643 students, 50% FRL); Timberline High School (1,404 students, 36% FRL).
- Market conditions: Rents rising (+3.4%/yr); 317 active listings in the ZIP; high-income renter base; 1,222 units permitted in Thurston County in 2024 (508 in 5+ unit buildings).
Forward outlook
- Local home prices are declining (-3.0%/yr); year-one equity from $1k of loan paydown is wiped out by about $5k of value loss. Plan a longer hold.
- Thurston County population projected at +27% by 2050 — long-run rental-demand tailwind backs the buy-and-hold thesis.
- At projected returns (-3.0% appreciation + 3.4% rent growth), your $49k cash investment doubles in ~7 years — after that, you're playing with house money.
Negotiation context
- It's been on market 157 days — a 12% lower offer ($154k) is reasonable based on typical stale-listing flexibility.
Questions for the listing agent
- It's been on market 157 days. Have you received any prior offers? Is the seller open to a 12% concession, seller financing, or rate buy-down credit?
- Why hasn't it sold? Are there any deal-killer items the seller is aware of (foundation, flood, title, zoning, code violations)?
- Is there a deadline driving the sale (1031 exchange, divorce, estate, relocation)? That informs how much negotiation room exists.
- Schools are B-rated — typically a magnet for longer-tenancy family renters. What's the average tenant stay here, and is there a school-zone premium baked into asking?
- What's the average days-on-market for RENTAL listings here right now (not sales)? A rising rental-DOM trend means longer vacancies and softer asking-rent achievability than the comps imply.
- What's the recent tenant-quality profile in this submarket — average credit score on applications, eviction rate, late-payment / NSF rate, and stable-employment percentage? A property-management company in the area should have these aggregated.
- How much new for-sale + rental construction is in the pipeline within 1–3 miles? Heavy new supply typically softens prices + rents 12–24 months out; constrained supply supports both.
Investment metrics
- 1% rule
- 1.39% ✓
- Cap rate
- 11.22%
- Cash-on-cash
- 17.60%
- DSCR
- 1.78
- GRM
- 6.0
CMA / ARV
- ARV (median comp)
- $176,800
- List price
- $175,000
- Delta
- -1.02%
- Verdict
- FAIR
- Comps
- 1 within 2.0 mi
Show comp detail 1 sale within ~0.75 mi
| Address | Dist | Beds/Ba | Sqft | Sold | Price | $/sf | Match |
|---|---|---|---|---|---|---|---|
| 6748 Fir Tree Rd SE #27 | 0.04mi | 2/1.5 (-1) | 924 (+10%) | 23mo | $20,000 | $22 | 55 |
Match score weights: distance 35% · size 25% · config 20% · recency 20%. Top-matched comps best support the ARV.
Projected returns pro-forma
-3.0% appreciation · 3.43% rent growth · sell at horizon
- IRR
- 9.5%
- Equity multiple
- 1.38×
- Total profit
- $18,508
- Equity at exit
- $26,093
- IRR
- 19.1%
- Equity multiple
- 2.62×
- Total profit
- $79,589
- Equity at exit
- $15,131
Cash invested: $49,000 (down + closing). Projections, not guarantees.
Landlord ↔ Tenant lean methodology
- Overall (STATE)
- 28 Tenant-Leaning
- State Washington
- 28 Tenant-Leaning · D+8
- County
- — inherits STATE
- City
- — inherits STATE
ZIP-level market 98513
- Rents YoY
- 3.4%
- Active inventory
- 317
- Price-to-rent
- 6.0×
Monthly cashflow live
- Estimated rent
- $2,440 medium interval (Pro) →
- Mortgage (P&I)
- −$918
- Tax est. 1.5%
- −$219 /mo · $2,625/yr
- Insurance
- −$73
- HOA
- −$0
- Vacancy / Maint / Mgmt
- −$513
- Net cashflow
- $719
Break-even live
Sensitivity live
| Price | -10% $840 | -5% $779 | +0% $719 | +5% $658 | +10% $598 |
|---|---|---|---|---|---|
| Rent | -10% $526 | -5% $622 | +0% $719 | +5% $815 | +10% $911 |
| Rate | -1.0pp $807 | -0.5pp $763 | base $719 | +0.5pp $673 | +1.0pp $627 |
UW: 25.0% down · 7.5% · 30yr · 1.5% tax · 5.0% vac · 8.0% maint · 8.0% mgmt
Financing live
Cash to close
- Down payment
- $43,750
- Closing costs
- $5,250
- Reserves months
- —
- Total cash needed
- —
Loan-product check · same deal, 3 products live
Conventional
25% down · 7.5% · 30yr
- Down + closing
- —
- Monthly P&I
- —
- Monthly cashflow
- —
- DSCR
- —
- Eligible?
- —
Personal DTI + credit; lowest rate.
DSCR
20% down · 8.5% · 30yr
- Down + closing
- —
- Monthly P&I
- —
- Monthly cashflow
- —
- DSCR
- —
- Eligible?
- —
No personal income docs; deal must DSCR.
Hard money
10% down · 12.0% · 12mo
- Down + closing
- —
- Monthly P&I
- —
- Monthly cashflow
- —
- DSCR
- —
- Eligible?
- —
Short-term bridge; refi at stabilization.
Listing history 20 events
-
2026-06-21days on market $175,000 Active 157 DOM
-
2026-06-18days on market $175,000 Active 154 DOM
-
2026-06-17days on market $175,000 Active 153 DOM
-
2026-06-16days on market $175,000 Active 152 DOM
-
2026-06-15days on market $175,000 Active 151 DOM
-
2026-06-14days on market $175,000 Active 149 DOM
-
2026-06-13days on market $175,000 Active 148 DOM
-
2026-06-10days on market $175,000 Active 146 DOM
-
2026-06-09days on market $175,000 Active 145 DOM
-
2026-06-08days on market $175,000 Active 144 DOM
-
2026-06-07days on market $175,000 Active 143 DOM
-
2026-06-03days on market $175,000 Active 139 DOM
-
2026-06-02days on market $175,000 Active 138 DOM
-
2026-06-01days on market $175,000 Active 137 DOM
-
2026-05-31days on market $175,000 Active 136 DOM
-
2026-05-30days on market $175,000 Active 135 DOM
-
2026-05-19price $175,000
-
2026-04-09price $179,000
-
2026-03-12price $180,000
-
2026-01-15$198,988 Active
ⓘ Source: listings_history table (triggers on properties + properties_extension) + one-shot
backfill from property_details.listing_events for pre-trigger history.
Climate risk First Street
- Flood 1/10 Low FEMA zone X (unshaded) · 0% chance over 30 yrs
- Wildfire 3/10 Moderate
- Heat 3/10 Moderate 7 d/yr ≥87°F today · 14 d/yr by 30 yrs out
- Wind 1/10 Low
- Air quality 6/10 Major 7 unhealthy d/yr today · 8 by 30 yrs out
Nearby sold comps map
Loading sold comps map…
Walkable amenities ~0.75 mi
Loading nearby amenities…
Taxation est. · year 1
- Rental income
- $29,286
- − Mortgage interest
- −$9,803
- − Property taxes
- −$2,625
- − Insurance
- −$875
- − Repairs & maintenance
- −$2,343
- − Management
- −$2,343
- − Depreciation
- −$5,091
- Taxable income
- $6,207
- Est. tax owed @ 24.0%
- −$1,490
- After-tax cash flow
- $7,134/yr
For passive investors: Depreciation is non-cash, so a rental often shows a tax loss while cash-flowing — sheltering income. Rental losses are passive: they offset passive income freely, and up to $25,000/yr can offset ordinary (W-2) income if you actively participate and your MAGI is under $100k (phasing out to $0 by $150k); unused losses carry forward. On sale, claimed depreciation is recaptured at up to 25%, and gains may owe capital-gains tax (a 1031 exchange can defer both). Figures are a year-1 estimate at your 24.0% rate — not tax advice; consult a CPA.
Schools (NCES district)
- District
- North Thurston Public Schools
- NCES district ID
- 5305850
- Math proficiency
- 51% ▬ 0.00%
- Reading proficiency
- 62% ▬ 0.00%
- Median HH income
- $62,338
- Composite
- 51.09/100
- National rank
- #3798
- State rank
- #80 of 291 in WA
Livability — Lacey
- Score
- 85/100
- State rank
- #33
- US rank
- #581
Category grades
Schools grade is shown separately in the Schools card above.
Census & demographics
- County
- Thurston County · 269,345 people
- City population
- 108,850
- Metro
- Olympia-Lacey-Tumwater, WA
- Population (ZIP)
- 38,017
- Household income
- $113,053
- Rent vs Own
- Severe rent burden
- 566.0
Population outlook (Thurston County) Hauer SSP2
- Today (2025)
- 308,239 people
- By 2030
- 326,483 · +5.9%
- By 2040
- 359,890 · +16.8%
- By 2050
- 391,800 · +27.1%
- By 2075
- 468,024 · +51.8%
- By 2100
- 519,890 · +68.7%
Race, ethnicity, and origin ACS 2023
- Neighborhood character
- Diverse neighborhood (Simpson 0.59)
- Race & ethnicity
- White 62% Two or more races 14% Hispanic / Latino 12% Asian 8% Black 5% Native American 2% Pacific Islander 2%
- Hispanic origin (detail)
- Mexican 8% Puerto Rican 2%
- Common ancestry
- Portuguese 4% Lithuanian 3% Italian 3%
- Foreign-born
- 11% · Canada, Vietnam, South Korea
- Languages at home
- 86% English-only · Spanish 5% Other Asian/Pacific 3% Vietnamese 2%
Political lean MEDSL · Thurston
- 2024 margin
- Strong D (+20.4) · D 58.5% · R 38.1% · Other 3.5%
- 2008→2024 swing
- -1.3pp toward R · 2008: 21.7pp · 2024: 20.4pp
- All cycles
- 2024: D+20.4 2020: D+18.6 2016: D+15.4 2012: D+19.0 2008: D+21.7
Not yet ingested
- Civics
- —
Market trends
- HPI YoY
- ▼ -377.44%
- Current HPI
- 337.436
- Rent YoY
- ▲ 3.43%
- Metro
- Olympia-Lacey-Tumwater, WA
- State GDP YoY
- ▲ 4.65%
- F500 in state
- 22
Industry mix (Fortune 500 HQ in WA)
| Industry | F500 HQs | Revenue |
|---|---|---|
| Retail | 2 | $269B |
|
||
| Technology / Retail | 1 | $638B |
|
||
| Technology | 1 | $245B |
|
||
| Telecommunications | 1 | $38B |
|
||
| Food / Beverage | 1 | $36B |
|
||
| Automotive / Trucks | 1 | $34B |
|
||
Price history
-12.1% since first listed4 events — show timeline
- 2026-05-19 Price Changed $175,000 NWMLS as Distributed by MLS Grid
- 2026-04-09 Price Changed $179,000 NWMLS as Distributed by MLS Grid
- 2026-03-12 Price Changed $180,000 NWMLS as Distributed by MLS Grid
- 2026-01-15 Listed $198,988 NWMLS as Distributed by MLS Grid
Property tax history
+4.4%/yrLatest (2025): $317 · +329.2% YoY. Source: county tax records.
Cash-flow waterfall
monthlySold comps — $/sqft
last 12 mo · ≤1 miLoading sold comps…