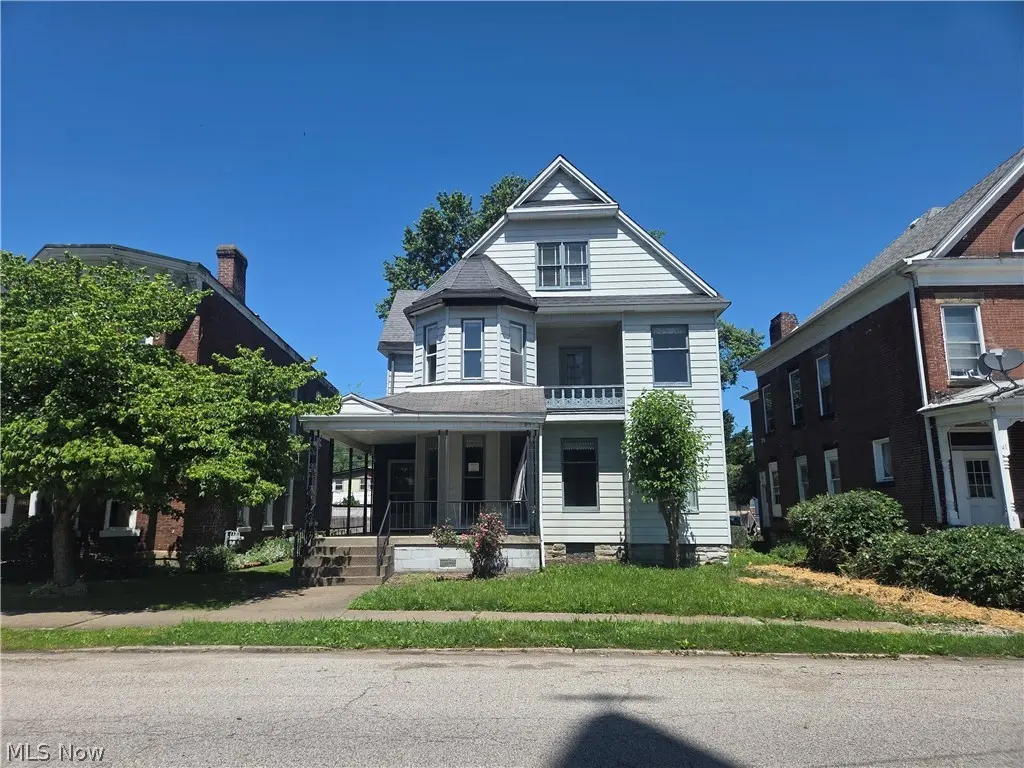
37 N 4th St · Martins Ferry, OH
Flood risk 1/10 · Minimal
- FEMA flood zone
- X (unshaded)
- Chance of flooding over 30 yrs
- 0.0%
- Est. flood insurance / yr
- $473 – $860
Fire risk 1/10 · Minimal
- Est. fire insurance / yr
- $713 – $1,323
Heat risk 4/10 · Minor
- Hot days now (above 97°F)
- 8 days/yr
- Hot days in 30 yrs
- 21 days/yr
Wind risk 1/10 · Minimal
- Chance of severe wind over 30 yrs
- —
Air-quality risk 2/10 · Minimal
- Unhealthy air days now
- 1 days/yr
- Unhealthy air days in 30 yrs
- 2 days/yr
Risk factors via First Street. Map © Google.
Why this score? — see what drove the B grade
The composite is a weighted blend of 9 inputs, each scored 0–100. Each bar is that input's sub-score; the figure is the points it added to the 100-point composite (weight × sub-score).
- Cash flow +27.7/30.0
- ARV discount +12.2/15.0
- DSCR +9.8/10.0
- 1% rule +8.4/10.0
- Schools +4.0/10.0
- Livability +3.6/5.0
- Rent growth +2.5/5.0
- Condition / age +2.5/5.0
- Appreciation +0.0/10.0
$99,900
🖨 Deal sheet 📄 Offer letter ✓ Due diligence
Listing remarks
Victorian Home for Sale in Martins Ferry, OH! 5 Bedrooms, 2 Baths Near Shops & Dining Welcome to this stunning 5 bedroom, 2 bath Victorian style home in the heart of Martins Ferry, Ohio. Full of timeless charm and character, this spacious residence offers the perfect blend of historic detail and everyday convenience. Inside, you’ll find tall ceilings, large windows, and generously sized rooms that create a warm, inviting atmosphere. With five bedrooms, this home provides endless possibilities! whether you need guest rooms, a home office, or a creative space. The two full bathrooms add function for family and guests alike. Located just steps from local shops, restaurants, and ame
Key facts
- Victorian style home
- Convenient location
- Unique details
Tags
Property features AI
Exterior
- Parking: Carport (1 space); On-street parking
- Utilities: Public water; Public sewer
- Home design: Three-story property; Vinyl-sided construction; Asphalt/fiberglass roof
- Construction: Vinyl siding; Asphalt/Fiberglass roof; Built date from public records
- Exterior features: Chain-link backyard fence
Interior
- Bedrooms: One main-level bedroom
- Bathrooms: Two full bathrooms; One main-level bathroom
- Heating & cooling: Central air conditioning; Forced air gas heating
- Interior features: Full basement with concrete construction; Has view; Total of 11 rooms
- Laundry & utility: Laundry in bathroom on main level
Neighborhood map
What this means for you Summary
Snapshot
- This is a 5-bed/2.0-bath single-family listed at $100k.
Deal economics
- At list price, monthly cash flow is $303 ($4k/yr) — positive.
- The deal already cash-flows at list — no discount required.
- Meets the 1% rule at list price ($1k rent vs $100k).
- Recommended offer: $98k (1.5% below list) — sets the bar for market timing.
Location & tenants
- Location reads 71/100 on livability (#423 in OH) — a middle-class / working-renter tenant base. Strengths: cost of living A+, housing A+, health & safety A-; Watch: amenities F, commute F, employment F.
- Martins Ferry City (suburban): math 42% / reading 54% proficiency, ranked #483 of 656 in OH (top 74%) — families likely to look elsewhere, expect single-tenant / working-renter base with shorter leases; 61% free/reduced lunch — lower-income household profile, screen leases tightly.
- Market conditions: 32 active listings in the ZIP; 4 units permitted in Belmont County in 2024 (0 in 5+ unit buildings).
- This rent runs 32% of the median local income ($50k/yr) — at the standard rent-burdened threshold; future hikes will face affordability resistance.
Forward outlook
- Local home prices are declining (-3.0%/yr); year-one equity from $691 of loan paydown is wiped out by about $3k of value loss. Plan a longer hold.
- Belmont County population projected at -15% by 2050 — secular population decline; favor cash flow + early exit over multi-decade hold.
- At projected returns (-3.0% appreciation + 3.0% rent growth), your $28k cash investment doubles in ~9 years — after that, you're playing with house money.
Negotiation context
- It's been on market 22 days — a 2% lower offer ($98k) is reasonable based on typical stale-listing flexibility.
- 2 sale attempts with the ask held roughly flat each time — persistent listings suggest the price (not the market) is what's stuck; bring a comps-based counter.
Risks & watch-outs
- Watch-outs: built in 1900 — expect roof / HVAC / electrical / plumbing capex.
Questions for the listing agent
- Built in 1900 — when were the roof, HVAC, electrical panel, plumbing, and water heater last replaced?
- Is there a deadline driving the sale (1031 exchange, divorce, estate, relocation)? That informs how much negotiation room exists.
- Schools are B-rated — typically a magnet for longer-tenancy family renters. What's the average tenant stay here, and is there a school-zone premium baked into asking?
- What's the average days-on-market for RENTAL listings here right now (not sales)? A rising rental-DOM trend means longer vacancies and softer asking-rent achievability than the comps imply.
- What's the recent tenant-quality profile in this submarket — average credit score on applications, eviction rate, late-payment / NSF rate, and stable-employment percentage? A property-management company in the area should have these aggregated.
- How much new for-sale + rental construction is in the pipeline within 1–3 miles? Heavy new supply typically softens prices + rents 12–24 months out; constrained supply supports both.
Investment metrics
- 1% rule
- 1.34% ✓
- Cap rate
- 9.93%
- Cash-on-cash
- 12.98%
- DSCR
- 1.58
- GRM
- 6.2
CMA / ARV
- ARV (on-the-fly)
- $111,484
- Comps found
- 2
Show comp detail 2 sales within ~0.75 mi
| Address | Dist | Beds/Ba | Sqft | Sold | Price | $/sf | Match |
|---|---|---|---|---|---|---|---|
| 618 Vine St | 0.55mi | 4/2.0 (-1) | 2,326 (-2%) | 19mo | $110,000 | $47 | 51 |
| 809 N 6th St | 0.61mi | 5/1.0 | 2,184 (-8%) | 23mo | $25,000 | $11 | 36 |
Match score weights: distance 35% · size 25% · config 20% · recency 20%. Top-matched comps best support the ARV.
Projected returns pro-forma
-3.0% appreciation · 3.0% rent growth · sell at horizon
- IRR
- 2.9%
- Equity multiple
- 1.11×
- Total profit
- $3,139
- Equity at exit
- $14,895
- IRR
- 12.5%
- Equity multiple
- 1.99×
- Total profit
- $27,787
- Equity at exit
- $8,638
Cash invested: $27,972 (down + closing). Projections, not guarantees.
Landlord ↔ Tenant lean methodology
- Overall (STATE)
- 73 Landlord-Friendly
- State Ohio
- 73 Landlord-Friendly · R+6
- County
- — inherits STATE
- City
- — inherits STATE
ZIP-level market 43935
- Home prices YoY
- -12.7%
- Active inventory
- 32
- Price-to-rent
- 6.2×
Monthly cashflow live
- Estimated rent
- $1,339 medium interval (Pro) →
- Mortgage (P&I)
- −$524
- Tax from tax record
- −$190 /mo · $2,278/yr
- Insurance
- −$42
- HOA
- −$0
- Vacancy / Maint / Mgmt
- −$281
- Net cashflow
- $303
Break-even live
UW: 25.0% down · 7.5% · 30yr · 1.5% tax · 5.0% vac · 8.0% maint · 8.0% mgmt
Financing live
Cash to close
- Down payment
- $24,975
- Closing costs
- $2,997
- Reserves months
- —
- Total cash needed
- —
Loan-product check · same deal, 3 products live
Conventional
25% down · 7.5% · 30yr
- Down + closing
- —
- Monthly P&I
- —
- Monthly cashflow
- —
- DSCR
- —
- Eligible?
- —
Personal DTI + credit; lowest rate.
DSCR
20% down · 8.5% · 30yr
- Down + closing
- —
- Monthly P&I
- —
- Monthly cashflow
- —
- DSCR
- —
- Eligible?
- —
No personal income docs; deal must DSCR.
Hard money
10% down · 12.0% · 12mo
- Down + closing
- —
- Monthly P&I
- —
- Monthly cashflow
- —
- DSCR
- —
- Eligible?
- —
Short-term bridge; refi at stabilization.
Listing history 21 events
-
2026-06-19days on market $99,900 Active 22 DOM
-
2026-06-18days on market $99,900 Active 21 DOM
-
2026-06-17days on market $99,900 Active 20 DOM
-
2026-06-16days on market $99,900 Active 19 DOM
-
2026-06-15days on market $99,900 Active 18 DOM
-
2026-06-14days on market $99,900 Active 16 DOM
-
2026-06-12days on market $99,900 Active 15 DOM
-
2026-06-09days on market $99,900 Active 12 DOM
-
2026-06-08days on market $99,900 Active 11 DOM
-
2026-06-07days on market $99,900 Active 10 DOM
-
2026-06-05days on market $99,900 Active 7 DOM
-
2026-06-03days on market $99,900 Active 6 DOM
-
2026-06-02days on market $99,900 Active 5 DOM
-
2026-06-01days on market $99,900 Active 4 DOM
-
2026-05-31days on market $99,900 Active 3 DOM
-
2026-05-30days on market $99,900 Active 2 DOM
-
2026-05-28$99,900 Active
-
2026-03-11historical
-
2025-12-09price $104,900
-
2025-10-31price $109,900
-
2025-09-11$129,900 Active
ⓘ Source: listings_history table (triggers on properties + properties_extension) + one-shot
backfill from property_details.listing_events for pre-trigger history.
Tax reassessment forecast OH · Partial reset (capped growth)
- Current annual tax
- $2,278 · $190/mo
- Projected year-2 tax
- $2,278 · $190/mo
- Expected delta
- $0/yr ($0/mo · 0.0%)
ⓘ Screening estimate from a state-policy table — verify with the county assessor before closing.
Climate risk First Street
- Flood 1/10 Low FEMA zone X (unshaded) · 0% chance over 30 yrs
- Wildfire 1/10 Low
- Heat 4/10 Moderate 8 d/yr ≥97°F today · 21 d/yr by 30 yrs out
- Wind 1/10 Low
- Air quality 2/10 Low 1 unhealthy d/yr today · 2 by 30 yrs out
Nearby sold comps map
Loading sold comps map…
Walkable amenities ~0.75 mi
Loading nearby amenities…
Taxation est. · year 1
- Rental income
- $16,069
- − Mortgage interest
- −$5,596
- − Property taxes
- −$2,278
- − Insurance
- −$500
- − Repairs & maintenance
- −$1,286
- − Management
- −$1,286
- − Depreciation
- −$2,906
- Taxable income
- $2,218
- Est. tax owed @ 24.0%
- −$532
- After-tax cash flow
- $3,098/yr
For passive investors: Depreciation is non-cash, so a rental often shows a tax loss while cash-flowing — sheltering income. Rental losses are passive: they offset passive income freely, and up to $25,000/yr can offset ordinary (W-2) income if you actively participate and your MAGI is under $100k (phasing out to $0 by $150k); unused losses carry forward. On sale, claimed depreciation is recaptured at up to 25%, and gains may owe capital-gains tax (a 1031 exchange can defer both). Figures are a year-1 estimate at your 24.0% rate — not tax advice; consult a CPA.
Schools (NCES district)
- District
- Martins Ferry City
- NCES district ID
- 3904434
- Math proficiency
- 42% ▼ -23.00%
- Reading proficiency
- 54% ▼ -9.00%
- Median HH income
- $37,566
- Composite
- 39.89/100
- National rank
- #3859
- State rank
- #483 of 656 in OH
Livability — Martins Ferry
- Score
- 71/100
- State rank
- #423
- US rank
- #6917
Category grades
Schools grade is shown separately in the Schools card above.
Census & demographics
- Census place
- Martins Ferry, OH
- County
- Belmont · 63,139 people
- Metro
- Wheeling, WV-OH
- Population (ZIP)
- 7,918
- Household income
- $50,109
- Rent vs Own
- Severe rent burden
- 2.2
Population outlook (Belmont County) Hauer SSP2
- Today (2025)
- 66,568 people
- By 2030
- 64,818 · -2.6%
- By 2040
- 60,702 · -8.8%
- By 2050
- 56,427 · -15.2%
- By 2075
- 46,222 · -30.6%
- By 2100
- 34,611 · -48.0%
Race, ethnicity, and origin ACS 2023
- Neighborhood character
- Predominantly White (84%)
- Race & ethnicity
- White 84% Two or more races 8% Black 5% Asian 3%
- Common ancestry
- Romanian 4% Serbian 1% Lithuanian 1%
- Foreign-born
- 2% · China
- Languages at home
- 98% English-only · Spanish 1% Chinese 1% German/W. Germanic 1%
Political lean MEDSL · Belmont
- 2024 margin
- Solid R (+47.3) · D 26.0% · R 73.3%
- 2008→2024 swing
- -50.0pp toward R · 2008: 2.7pp · 2024: -47.3pp
- All cycles
- 2024: R+47.3 2020: R+43.6 2016: R+39.5 2012: R+8.4 2008: D+2.7
Not yet ingested
- Civics
- —
Market trends
- HPI YoY
- ▼ -25.06%
- Current HPI
- 172.1787
- Rent YoY
- —
- Metro
- —
- State GDP YoY
- ▲ 1.98%
- F500 in state
- 48
Industry mix (Fortune 500 HQ in OH)
| Industry | F500 HQs | Revenue |
|---|---|---|
| Insurance | 3 | $145B |
|
||
| Industrial Machinery | 3 | $49B |
|
||
| Financial Services | 3 | $24B |
|
||
| Consumer Goods | 2 | $93B |
|
||
| Aerospace / Defense | 2 | $47B |
|
||
| Utilities | 2 | $33B |
|
||
Price history
-23.1% since first listed5 events — show timeline
- 2026-05-28 Listed $99,900 MLSNOW
- 2026-03-11 Listing Removed — MLSNOW
- 2025-12-09 Price Changed $104,900 MLSNOW
- 2025-10-31 Price Changed $109,900 MLSNOW
- 2025-09-11 Listed $129,900 MLSNOW
Property tax history
+12.2%/yrLatest (2025): $2,278 · +18.7% YoY. Source: county tax records.
Cash-flow waterfall
monthlySold comps — $/sqft
last 12 mo · ≤1 miLoading sold comps…