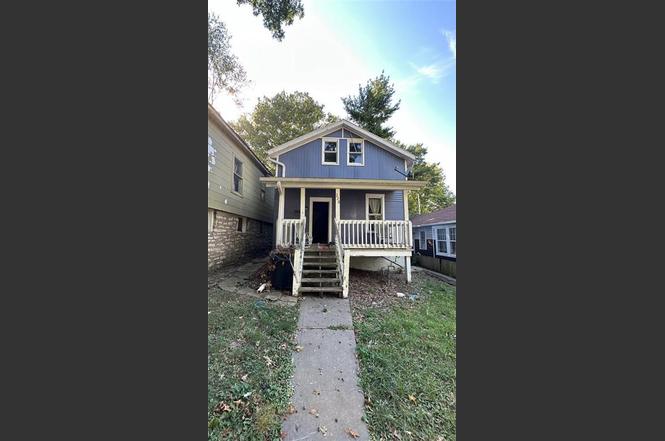
326 N Thorpe St · Kansas City, KS
Flood risk 1/10 · Minimal
- FEMA flood zone
- X (unshaded)
- Chance of flooding over 30 yrs
- 0.0%
- Est. flood insurance / yr
- $473 – $860
Fire risk 1/10 · Minimal
- Est. fire insurance / yr
- $1,154 – $2,142
Heat risk 4/10 · Minor
- Hot days now (above 106°F)
- 7 days/yr
- Hot days in 30 yrs
- 17 days/yr
Wind risk 2/10 · Minimal
- Chance of severe wind over 30 yrs
- —
Air-quality risk 3/10 · Minor
- Unhealthy air days now
- 2 days/yr
- Unhealthy air days in 30 yrs
- 3 days/yr
Risk factors via First Street. Map © Google.
Why this score? — see what drove the B- grade
The composite is a weighted blend of 9 inputs, each scored 0–100. Each bar is that input's sub-score; the figure is the points it added to the 100-point composite (weight × sub-score).
- Cash flow +30.0/30.0
- 1% rule +10.0/10.0
- DSCR +10.0/10.0
- ARV discount +7.5/15.0
- Rent growth +4.6/5.0
- Livability +3.6/5.0
- Condition / age +2.5/5.0
- Schools +0.9/10.0
- Appreciation +0.0/10.0
$79,900
🖨 Deal sheet (PDF) 📄 Offer letter ✓ Due diligence
Listing remarks MLS
This attractive 3 bedroom property would be a great rental. It is in a located near the Central Avenue corridor in Kansas City, Kansas. It has a new roof and gutters, new HVAC, new hot water tank, with updated electrical and plumbing. The bathroom needs to be rehabbed and closet space added to the first floor bedroom. Splitting the upstairs room would add a third bedroom. As a three bedroom this property should rent for $800-$850/month.
Key facts
- Build equity
- Rental portfolio
- 3,485 sq ft lot
Tags
Property features AI
Finance
- HOA & community: No association fees
Exterior
- Parking: Other parking
- Utilities: Public water; Public sewer
- Home design: Single-family residential; Bungalow floor plan; Fixer condition; Approximately 76–100 years old
- Construction: Board & batten siding; Composition roof
- Exterior features: Wood fencing; Not in a flood plain
Interior
- Kitchen: Refrigerator; Built-in electric oven
- Bedrooms: 3 bedrooms — two on the first floor, one on the second floor
- Flooring: Carpet; Laminate; Tile
- Bathrooms: 1 full bathroom
- Heating & cooling: Natural gas heating; Electric cooling
- Interior features: Concrete basement; Eat-in kitchen and open dining/ living/ family combos
Neighborhood map
What this means for you Summary
Snapshot
- This is a 3-bed/1.0-bath single-family listed at $80k.
Deal economics
- At list price, monthly cash flow is $617 ($7k/yr) — positive.
- The deal already cash-flows at list — no discount required.
- Meets the 1% rule at list price ($1k rent vs $80k).
- Recommended offer: $70k (12.0% below list) — sets the bar for market timing.
- Cap rate 15.6% vs local median 4.8% in Kansas City — top-decile yield for the area; either an underpriced asset or a hidden risk that comps aren't pricing in. Stress-test before assuming the spread holds.
Location & tenants
- Location reads 72/100 on livability (#103 in KS) — a middle-class / working-renter tenant base. Strengths: commute A+, cost of living A+, housing A+; Watch: crime F, employment D-.
- Kansas City (urban): math 8% / reading 15% proficiency, ranked #169 of 169 in KS (top 100%) — low school quality limits family demand, transient renter base, plan for 1-2y turnover; 81% free/reduced lunch — lower-income household profile, screen leases tightly.
- Zoned schools: M E Pearson Elem (math 9% / reading 16%, grade F, #642 of 684 statewide, top 94%, 582 students, 93% FRL); Central Middle (math 3% / reading 12%, grade F, #207 of 219 statewide, top 95%, 686 students, 90% FRL); Wyandotte High (math 2% / reading 3%, grade F, #325 of 327 statewide, top 99%, 1,832 students, 83% FRL).
- Market conditions: Rents rising fast (+8.4%/yr); 113 active listings in the ZIP; 369 units permitted in Wyandotte County in 2024 (236 in 5+ unit buildings).
- This rent runs 34% of the median local income ($53k/yr) — at the standard rent-burdened threshold; future hikes will face affordability resistance.
Forward outlook
- Local home prices are declining (-3.0%/yr); year-one equity from $552 of loan paydown is wiped out by about $2k of value loss. Plan a longer hold.
- Wyandotte County population projected at +17% by 2050 — long-run rental-demand tailwind backs the buy-and-hold thesis.
- At projected returns (-3.0% appreciation + 8.0% rent growth), your $22k cash investment doubles in ~4 years — after that, you're playing with house money.
Negotiation context
- It's been on market 622 days — a 12% lower offer ($70k) is reasonable based on typical stale-listing flexibility.
- 7 sale attempts since 27y ago; this cycle's ask has dropped $16k (17%) from the opening price — seller is motivated, your offer sets the floor, not the list.
- Current owner paid $28k; list at $80k implies a 191% gain — meaningful room to come down on a strong offer.
Risks & watch-outs
- Watch-outs: built in 1925 — expect roof / HVAC / electrical / plumbing capex.
Questions for the listing agent
- It's been on market 622 days. Have you received any prior offers? Is the seller open to a 12% concession, seller financing, or rate buy-down credit?
- Built in 1925 — when were the roof, HVAC, electrical panel, plumbing, and water heater last replaced?
- Why hasn't it sold? Are there any deal-killer items the seller is aware of (foundation, flood, title, zoning, code violations)?
- Is there a deadline driving the sale (1031 exchange, divorce, estate, relocation)? That informs how much negotiation room exists.
- Schools are F-rated, which usually means shorter tenancies and higher turnover. Who's the typical renter profile here, and what's been the actual vacancy rate?
- Crime grade is F in this area — have there been break-ins, vandalism, or insurance claims at this property in the last 3 years? What carrier currently insures it and at what premium?
- What's the average days-on-market for RENTAL listings here right now (not sales)? A rising rental-DOM trend means longer vacancies and softer asking-rent achievability than the comps imply.
- What's the recent tenant-quality profile in this submarket — average credit score on applications, eviction rate, late-payment / NSF rate, and stable-employment percentage? A property-management company in the area should have these aggregated.
- How much new for-sale + rental construction is in the pipeline within 1–3 miles? Heavy new supply typically softens prices + rents 12–24 months out; constrained supply supports both.
Investment metrics
- 1% rule
- 1.87% ✓
- Cap rate
- 15.56%
- Cash-on-cash
- 33.11%
- DSCR
- 2.47
- GRM
- 4.4
CMA / ARV
No comps found within radius.
Projected returns pro-forma
-3.0% appreciation · 8.0% rent growth · sell at horizon
- IRR
- 33.9%
- Equity multiple
- 2.53×
- Total profit
- $34,318
- Equity at exit
- $11,913
- IRR
- 43.5%
- Equity multiple
- 6.21×
- Total profit
- $116,670
- Equity at exit
- $6,908
Cash invested: $22,372 (down + closing). Projections, not guarantees.
Landlord ↔ Tenant lean methodology
- Overall (STATE)
- 83 Strongly Landlord-Friendly
- State Kansas
- 83 Strongly Landlord-Friendly · R+10
- County
- — inherits STATE
- City
- — inherits STATE
ZIP-level market 66102
- Home prices YoY
- -8.7%
- Rents YoY
- 8.4%
- Active inventory
- 113
- Price-to-rent
- 4.4×
Monthly cashflow live
- Estimated rent
- $1,498 medium interval (Pro) →
- Mortgage (P&I)
- −$419
- Tax from tax record
- −$114 /mo · $1,366/yr
- Insurance
- −$33
- HOA
- −$0
- Vacancy / Maint / Mgmt
- −$315
- Net cashflow
- $617
Break-even live
Sensitivity live
| Price | -10% $663 | -5% $640 | +0% $617 | +5% $595 | +10% $572 |
|---|---|---|---|---|---|
| Rent | -10% $499 | -5% $558 | +0% $617 | +5% $676 | +10% $736 |
| Rate | -1.0pp $658 | -0.5pp $638 | base $617 | +0.5pp $597 | +1.0pp $576 |
UW: 25.0% down · 7.5% · 30yr · 1.5% tax · 5.0% vac · 8.0% maint · 8.0% mgmt
Financing live
Cash to close
- Down payment
- $19,975
- Closing costs
- $2,397
- Reserves months
- —
- Total cash needed
- —
Loan-product check · same deal, 3 products live
Conventional
25% down · 7.5% · 30yr
- Down + closing
- —
- Monthly P&I
- —
- Monthly cashflow
- —
- DSCR
- —
- Eligible?
- —
Personal DTI + credit; lowest rate.
DSCR
20% down · 8.5% · 30yr
- Down + closing
- —
- Monthly P&I
- —
- Monthly cashflow
- —
- DSCR
- —
- Eligible?
- —
No personal income docs; deal must DSCR.
Hard money
10% down · 12.0% · 12mo
- Down + closing
- —
- Monthly P&I
- —
- Monthly cashflow
- —
- DSCR
- —
- Eligible?
- —
Short-term bridge; refi at stabilization.
Listing history 36 events
-
2026-06-21days on market $79,900 Active 622 DOM
-
2026-06-18days on market $79,900 Active 619 DOM
-
2026-06-17days on market $79,900 Active 618 DOM
-
2026-06-16days on market $79,900 Active 617 DOM
-
2026-06-15days on market $79,900 Active 616 DOM
-
2026-06-13days on market $79,900 Active 614 DOM
-
2026-06-13days on market $79,900 Active 613 DOM
-
2026-06-09days on market $79,900 Active 610 DOM
-
2026-06-08days on market $79,900 Active 609 DOM
-
2026-06-07days on market $79,900 Active 608 DOM
-
2026-06-05days on market $79,900 Active 605 DOM
-
2026-06-03days on market $79,900 Active 604 DOM
-
2026-06-02days on market $79,900 Active 603 DOM
-
2026-06-01days on market $79,900 Active 602 DOM
-
2026-05-31days on market $79,900 Active 601 DOM
-
2025-10-07status Active
-
2025-10-06status Active
-
2025-09-23historical
-
2025-09-23historical
-
2025-03-06price $79,900
-
2024-11-11price $89,900
-
2024-09-23$96,200 Active
-
2023-03-10soldstatus
-
2021-08-23status Pending
-
2021-08-22historical
-
2021-07-08price $85,000
-
2021-06-05$95,000 Active
-
2020-04-24soldstatus
-
2020-04-22soldstatus Sold 440-char remark
Show marketing remark (440 chars)
This attractive 3 bedroom property would be a great rental. It is in a located near the Central Avenue corridor in Kansas City, Kansas. It has a new roof and gutters, new HVAC, new hot water tank, with updated electrical and plumbing. The bathroom needs to be rehabbed and closet space added to the first floor bedroom. Splitting the upstairs room would add a third bedroom. As a three bedroom this property should rent for $800-$850/month.
-
2020-03-08historical Contingent - Accepting Backup Offers 440-char remark
Show marketing remark (440 chars)
This attractive 3 bedroom property would be a great rental. It is in a located near the Central Avenue corridor in Kansas City, Kansas. It has a new roof and gutters, new HVAC, new hot water tank, with updated electrical and plumbing. The bathroom needs to be rehabbed and closet space added to the first floor bedroom. Splitting the upstairs room would add a third bedroom. As a three bedroom this property should rent for $800-$850/month.
-
2020-02-29$45,000 Active 440-char remark
Show marketing remark (440 chars)
This attractive 3 bedroom property would be a great rental. It is in a located near the Central Avenue corridor in Kansas City, Kansas. It has a new roof and gutters, new HVAC, new hot water tank, with updated electrical and plumbing. The bathroom needs to be rehabbed and closet space added to the first floor bedroom. Splitting the upstairs room would add a third bedroom. As a three bedroom this property should rent for $800-$850/month.
-
2004-01-29soldstatus
-
2003-12-19$19,900
-
2000-08-01soldstatus $27,500
-
2000-06-27soldstatus
-
1999-12-08$19,950
ⓘ Source: listings_history table (triggers on properties + properties_extension) + one-shot
backfill from property_details.listing_events for pre-trigger history.
Tax reassessment forecast KS · Resets to sale price
- Current annual tax
- $1,366 · $114/mo
- Projected year-2 tax
- $1,366 · $114/mo
- Expected delta
- $0/yr ($0/mo · 0.0%)
ⓘ Screening estimate from a state-policy table — verify with the county assessor before closing.
Climate risk First Street
- Flood 1/10 Low FEMA zone X (unshaded) · 0% chance over 30 yrs
- Wildfire 1/10 Low
- Heat 4/10 Moderate 7 d/yr ≥106°F today · 17 d/yr by 30 yrs out
- Wind 2/10 Low
- Air quality 3/10 Moderate 2 unhealthy d/yr today · 3 by 30 yrs out
Nearby sold comps map
Loading sold comps map…
Walkable amenities ~0.75 mi
Loading nearby amenities…
Taxation est. · year 1
- Rental income
- $17,976
- − Mortgage interest
- −$4,476
- − Property taxes
- −$1,366
- − Insurance
- −$400
- − Repairs & maintenance
- −$1,438
- − Management
- −$1,438
- − Depreciation
- −$2,324
- Taxable income
- $6,535
- Est. tax owed @ 24.0%
- −$1,568
- After-tax cash flow
- $5,840/yr
For passive investors: Depreciation is non-cash, so a rental often shows a tax loss while cash-flowing — sheltering income. Rental losses are passive: they offset passive income freely, and up to $25,000/yr can offset ordinary (W-2) income if you actively participate and your MAGI is under $100k (phasing out to $0 by $150k); unused losses carry forward. On sale, claimed depreciation is recaptured at up to 25%, and gains may owe capital-gains tax (a 1031 exchange can defer both). Figures are a year-1 estimate at your 24.0% rate — not tax advice; consult a CPA.
Schools (NCES district)
- District
- Kansas City
- NCES district ID
- 2007950
- Math proficiency
- 8% ▼ -10.00%
- Reading proficiency
- 15% ▼ -4.00%
- Median HH income
- $34,774
- Composite
- 9.38/100
- National rank
- #9856
- State rank
- #169 of 169 in KS
Livability — Kansas City
- Score
- 72/100
- State rank
- #103
- US rank
- #6054
Category grades
Schools grade is shown separately in the Schools card above.
Census & demographics
- Census place
- Kansas City, KS
- County
- Wyandotte County · 130,206 people
- City population
- 130,206
- Metro
- Kansas City, MO-KS
- Population (ZIP)
- 29,443
- Household income
- $52,861
- Rent vs Own
- Severe rent burden
- 1253.0
Population outlook (Wyandotte County) Hauer SSP2
- Today (2025)
- 177,063 people
- By 2030
- 183,212 · +3.5%
- By 2040
- 195,697 · +10.5%
- By 2050
- 207,897 · +17.4%
- By 2075
- 236,169 · +33.4%
- By 2100
- 255,790 · +44.5%
Race, ethnicity, and origin ACS 2023
- Neighborhood character
- Diverse neighborhood (Simpson 0.65)
- Race & ethnicity
- Hispanic / Latino 53% White 19% Black 17% Two or more races 15% Asian 6% Native American 1%
- Hispanic origin (detail)
- Mexican 43%
- Common ancestry
- Italian 1% Romanian 0%
- Foreign-born
- 28% · Canada, Philippines
- Languages at home
- 52% English-only · Spanish 42% Other Asian/Pacific 5% Other Indo-European 1%
Political lean MEDSL · Wyandotte
- 2024 margin
- Strong D (+23.9) · D 61.1% · R 37.3% · Other 1.6%
- 2008→2024 swing
- -17.0pp toward R · 2008: 40.9pp · 2024: 23.9pp
- All cycles
- 2024: D+23.9 2020: D+30.9 2016: D+29.1 2012: D+36.4 2008: D+40.9
Not yet ingested
- Civics
- —
Market trends
- HPI YoY
- ▼ -36.64%
- Current HPI
- 383.6185
- Rent YoY
- ▲ 8.36%
- Metro
- Kansas City, MO-KS
- State GDP YoY
- —
- F500 in state
- 0
Price history
+300.5% since first listed21 events — show timeline
- 2025-10-07 Relisted — Heartland MLS as Distributed by MLS Grid
- 2025-10-06 Relisted — Heartland MLS as Distributed by MLS Grid
- 2025-09-23 Listing Removed — Heartland MLS as Distributed by MLS Grid
- 2025-09-23 Listing Removed — Heartland MLS as Distributed by MLS Grid
- 2025-03-06 Price Changed $79,900 Heartland MLS as Distributed by MLS Grid
- 2024-11-11 Price Changed $89,900 Heartland MLS as Distributed by MLS Grid
- 2024-09-23 Listed $96,200 Heartland MLS as Distributed by MLS Grid
- 2023-03-10 Sold (Public Records) — Public Records
- 2021-08-23 Pending — Heartland MLS as Distributed by MLS Grid
- 2021-08-22 Listing Removed — Heartland MLS as Distributed by MLS Grid
- 2021-07-08 Price Changed $85,000 Heartland MLS as Distributed by MLS Grid
- 2021-06-05 Listed $95,000 Heartland MLS as Distributed by MLS Grid
- 2020-04-24 Sold (Public Records) — Public Records
- 2020-04-22 Sold (MLS) — Heartland MLS as Distributed by MLS Grid
- 2020-03-08 Contingent — Heartland MLS as Distributed by MLS Grid
- 2020-02-29 Listed $45,000 Heartland MLS as Distributed by MLS Grid
- 2004-01-29 Sold (MLS) — Heartland MLS as Distributed by MLS Grid
- 2003-12-19 Listed $19,900 Heartland MLS as Distributed by MLS Grid
- 2000-08-01 Sold (Public Records) $27,500 Public Records
- 2000-06-27 Sold (MLS) — Heartland MLS as Distributed by MLS Grid
- 1999-12-08 Listed $19,950 Heartland MLS as Distributed by MLS Grid
Property tax history
+6.9%/yrLatest (2025): $1,366 · -1.4% YoY. Source: county tax records.
Cash-flow waterfall
monthlySold comps — $/sqft
last 12 mo · ≤1 miLoading sold comps…