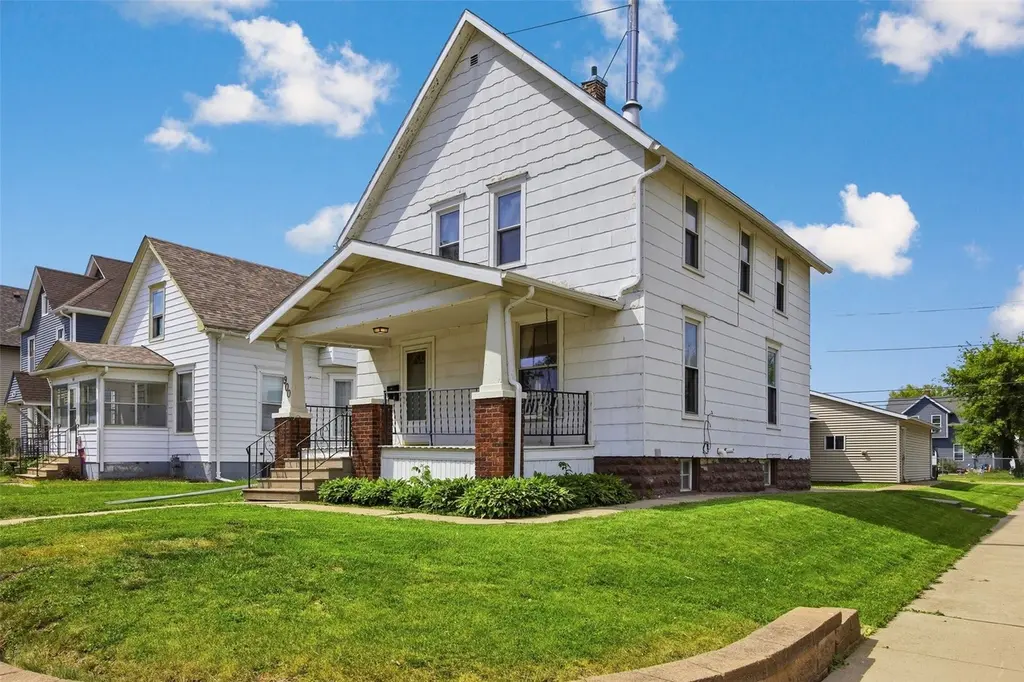
900 E Ave NW · Cedar Rapids, IA
Flood risk 1/10 · Minimal
- FEMA flood zone
- X (shaded)
- Chance of flooding over 30 yrs
- 0.0%
- Est. flood insurance / yr
- $473 – $860
Fire risk 1/10 · Minimal
- Est. fire insurance / yr
- $902 – $1,676
Heat risk 3/10 · Minor
- Hot days now (above 103°F)
- 7 days/yr
- Hot days in 30 yrs
- 15 days/yr
Wind risk 2/10 · Minimal
- Chance of severe wind over 30 yrs
- —
Air-quality risk 2/10 · Minimal
- Unhealthy air days now
- 0 days/yr
- Unhealthy air days in 30 yrs
- 1 days/yr
Risk factors via First Street. Map © Google.
Why this score? — see what drove the C- grade
The composite is a weighted blend of 9 inputs, each scored 0–100. Each bar is that input's sub-score; the figure is the points it added to the 100-point composite (weight × sub-score).
- Cash flow +17.2/30.0
- ARV discount +10.2/15.0
- DSCR +5.4/10.0
- Rent growth +5.0/5.0
- Schools +4.7/10.0
- 1% rule +4.3/10.0
- Livability +3.9/5.0
- Condition / age +2.5/5.0
- Appreciation +0.0/10.0
$155,000
🖨 Deal sheet 📄 Offer letter ✓ Due diligence
Listing remarks
This charming 1905 two-story home blends character with a thoughtful layout. Rich woodwork, tall ceilings, and a handsome wooden staircase showcase the era's architecture. The living room features a cozy wood-burning fireplace, and the updated kitchen includes stainless steel appliances and access to the back deck. 3 bedrooms upstairs (two include walk-in closets), and a full bath. Enjoy mornings on the porch swing or productive times in the large, two-stall garage complete with furnace and air conditioning. Natural light illuminates every room through newer windows. Major updates include newer windows, new shingles in 2020, and newer central air. The well-maintained basement includes a was
Key facts
- Newer windows
- Back deck
- Porch swing
Tags
Property features AI
Exterior
- Parking: Detached heated garage with garage door opener (2 garage spaces); Off-street and on-street parking
- Utilities: Public water; Public sewer
- Home design: Single family residence; Two levels / 2 stories
- Construction: Frame construction
- Exterior features: Deck; Patio; Fenced yard; Pets allowed
Interior
- Kitchen: Range; Microwave; Dishwasher; Refrigerator; Disposal
- Bedrooms: Total of 6 rooms (includes bedrooms and living spaces)
- Bathrooms: 1 full bathroom
- Heating & cooling: Forced air heating (natural gas); Central air conditioning
- Interior features: Fireplace in the living room with a wood-burning stove; Full basement
- Laundry & utility: Washer; Dryer; Gas water heater
Neighborhood map
What this means for you Summary
Snapshot
- This is a 3-bed/1.0-bath single-family listed at $155k.
Deal economics
- At list price, monthly cash flow is $110 ($1k/yr) — positive.
- The deal already cash-flows at list — no discount required.
- To meet the 1% rule (rent ≥ 1% of price), the offer needs to be $144k (7.1% below list).
- Recommended offer: $144k (7.1% below list) — sets the bar for 1% rule.
- Cap rate 7.1% vs local median 3.5% in Cedar Rapids — top-decile yield for the area; either an underpriced asset or a hidden risk that comps aren't pricing in. Stress-test before assuming the spread holds.
Location & tenants
- Location reads 78/100 on livability (#134 in IA, #2,474 nationally) — a middle-class / working-renter tenant base. Strengths: cost of living A+, housing A+, health & safety A+; Watch: crime C-, commute F.
- Cedar Rapids Community School District (urban): math 50% / reading 59% proficiency, ranked #265 of 289 in IA (top 92%) — acceptable for families but not a draw, mixed tenant base, ~2y average lease.
- Zoned schools: Harrison Elementary School (math 37% / reading 42%, grade F, #579 of 616 statewide, top 95%, 285 students, 78% FRL); Roosevelt Creative Corridor Business Academy (math 36% / reading 47%, grade F, #235 of 246 statewide, top 96%, 510 students, 69% FRL); Thomas Jefferson High School (math 41% / reading 62%, grade D+, #307 of 336 statewide, top 91%, 1,543 students, 56% FRL) — zoned schools average 68% FRL vs 43% district-wide (24 pts higher); higher-poverty schools than district average — tighter screening recommended.
- Market conditions: Rents rising fast (+12.4%/yr); 145 active listings in the ZIP; 2 comparable units currently listed for rent nearby; 1,023 units permitted in Linn County in 2024 (456 in 5+ unit buildings).
Forward outlook
- Local home prices are declining (-3.0%/yr); year-one equity from $1k of loan paydown is wiped out by about $5k of value loss. Plan a longer hold.
- Linn County population projected at +16% by 2050 — long-run rental-demand tailwind backs the buy-and-hold thesis.
- At projected returns (-3.0% appreciation + 8.0% rent growth), your $43k cash investment doubles in ~10 years — after that, you're playing with house money.
Negotiation context
- It's been on market 19 days — a 2% lower offer ($153k) is reasonable based on typical stale-listing flexibility.
- Current owner paid $95k; list at $155k implies a 63% gain — meaningful room to come down on a strong offer.
Risks & watch-outs
- Watch-outs: built in 1905 — expect roof / HVAC / electrical / plumbing capex.
Questions for the listing agent
- Built in 1905 — when were the roof, HVAC, electrical panel, plumbing, and water heater last replaced?
- Is there a deadline driving the sale (1031 exchange, divorce, estate, relocation)? That informs how much negotiation room exists.
- Schools are B-rated — typically a magnet for longer-tenancy family renters. What's the average tenant stay here, and is there a school-zone premium baked into asking?
- What's the average days-on-market for RENTAL listings here right now (not sales)? A rising rental-DOM trend means longer vacancies and softer asking-rent achievability than the comps imply.
- What's the recent tenant-quality profile in this submarket — average credit score on applications, eviction rate, late-payment / NSF rate, and stable-employment percentage? A property-management company in the area should have these aggregated.
- How much new for-sale + rental construction is in the pipeline within 1–3 miles? Heavy new supply typically softens prices + rents 12–24 months out; constrained supply supports both.
Investment metrics
- 1% rule
- 0.93% ✗
- Cap rate
- 7.15%
- Cash-on-cash
- 3.05%
- DSCR
- 1.14
- GRM
- 9.0
CMA / ARV
- ARV (median comp)
- $164,742
- List price
- $155,000
- Delta
- -5.91%
- Verdict
- FAIR
- Comps
- 20 within 1.0 mi
Show comp detail 12 sales within ~0.75 mi
| Address | Dist | Beds/Ba | Sqft | Sold | Price | $/sf | Match |
|---|---|---|---|---|---|---|---|
| 1020 A Ave NW | 0.34mi | 2/1.0 (-1) | 1,344 (0%) | 1mo | $125,000 | $93 | 78 |
| 409 A Ave NW | 0.40mi | 3/1.5 | 1,350 (+0%) | 2mo | $180,000 | $133 | 77 |
| 911 A Ave NW | 0.32mi | 3/1.0 | 1,284 (-4%) | 2mo | $75,000 | $58 | 76 |
| 1013 D Ave NW | 0.12mi | 4/2.0 (+1) | 1,233 (-8%) | 2mo | $130,000 | $105 | 70 |
| 514 9th St St NW | 0.06mi | 2/2.0 (-1) | 1,176 (-12%) | 1mo | $185,000 | $157 | 67 |
| 1114 11th St St NW | 0.36mi | 4/2.0 (+1) | 1,404 (+4%) | 2mo | $181,000 | $129 | 65 |
| 1121 11th St NW | 0.37mi | 3/1.0 | 1,164 (-13%) | 1mo | $135,000 | $116 | 59 |
| 231 Highland Dr Dr NW | 0.55mi | 3/1.0 | 1,480 (+10%) | 0mo | $159,900 | $108 | 58 |
| 1218 B Ave NW | 0.30mi | 4/1.0 (+1) | 1,150 (-14%) | 1mo | $80,000 | $70 | 56 |
| 523 SW 6th Ave | 0.71mi | 3/1.0 | 1,248 (-7%) | 0mo | $168,000 | $135 | 54 |
| 1024 Cheyenne Rd Rd NW | 0.62mi | 3/2.0 | 1,246 (-7%) | 2mo | $190,000 | $152 | 54 |
| 1629 C Ave Ave NW | 0.51mi | 2/2.0 (-1) | 1,476 (+10%) | 3mo | $245,000 | $166 | 48 |
Match score weights: distance 35% · size 25% · config 20% · recency 20%. Top-matched comps best support the ARV.
Projected returns pro-forma
-3.0% appreciation · 8.0% rent growth · sell at horizon
- IRR
- -6.2%
- Equity multiple
- 0.76×
- Total profit
- $-10,488
- Equity at exit
- $23,111
- IRR
- 8.5%
- Equity multiple
- 1.80×
- Total profit
- $34,517
- Equity at exit
- $13,402
Cash invested: $43,400 (down + closing). Projections, not guarantees.
Landlord ↔ Tenant lean methodology
- Overall (STATE)
- 83 Strongly Landlord-Friendly
- State Iowa
- 83 Strongly Landlord-Friendly · R+6
- County
- — inherits STATE
- City
- — inherits STATE
ZIP-level market 52405
- Rents YoY
- 12.4%
- Active inventory
- 145
- Price-to-rent
- 9.0×
Monthly cashflow live
- Estimated rent
- $1,440 medium interval (Pro) →
- Mortgage (P&I)
- −$813
- Tax from tax record
- −$150 /mo · $1,794/yr
- Insurance
- −$65
- HOA
- −$0
- Vacancy / Maint / Mgmt
- −$302
- Net cashflow
- $110
Break-even live
UW: 25.0% down · 7.5% · 30yr · 1.5% tax · 5.0% vac · 8.0% maint · 8.0% mgmt
Financing live
Cash to close
- Down payment
- $38,750
- Closing costs
- $4,650
- Reserves months
- —
- Total cash needed
- —
Loan-product check · same deal, 3 products live
Conventional
25% down · 7.5% · 30yr
- Down + closing
- —
- Monthly P&I
- —
- Monthly cashflow
- —
- DSCR
- —
- Eligible?
- —
Personal DTI + credit; lowest rate.
DSCR
20% down · 8.5% · 30yr
- Down + closing
- —
- Monthly P&I
- —
- Monthly cashflow
- —
- DSCR
- —
- Eligible?
- —
No personal income docs; deal must DSCR.
Hard money
10% down · 12.0% · 12mo
- Down + closing
- —
- Monthly P&I
- —
- Monthly cashflow
- —
- DSCR
- —
- Eligible?
- —
Short-term bridge; refi at stabilization.
Rent comps 2 comps
| Address | Beds | Baths | Sqft | Rent | $/sqft | DOM | Units | Dist |
|---|---|---|---|---|---|---|---|---|
| 417 9th St NW Cedar Rapids, IA | 3.0 | 1.0 | 1061 | $1,300 | $1.23 | 43d | 1 | 0.11mi |
| 1001 C Ave NW Cedar Rapids, IA | 3.0 | 1.5 | 1446 | $1,500 | $1.04 | 13d | 1 | 0.16mi |
Listing history 8 events
-
2026-06-03statusdays on market $155,000 Pending 19 DOM
-
2026-06-02days on market $155,000 Active 18 DOM
-
2026-06-01days on market $155,000 Active 17 DOM
-
2026-05-31pricedays on market $155,000 Active 16 DOM
-
2026-05-30days on market $165,000 Active 15 DOM
-
2026-05-15$165,000 Active 790-char remark
-
2019-08-16soldstatus $95,000
-
2008-09-22soldstatus $81,000
ⓘ Source: listings_history table (triggers on properties + properties_extension) + one-shot
backfill from property_details.listing_events for pre-trigger history.
Tax reassessment forecast IA · Partial reset (capped growth)
- Current annual tax
- $1,794 · $150/mo
- Projected year-2 tax
- $2,114 · $176/mo
- Expected delta
- +$320/yr (+$27/mo · 17.8%)
ⓘ Screening estimate from a state-policy table — verify with the county assessor before closing.
Climate risk First Street
- Flood 1/10 Low FEMA zone X (shaded) · 0% chance over 30 yrs
- Wildfire 1/10 Low
- Heat 3/10 Moderate 7 d/yr ≥103°F today · 15 d/yr by 30 yrs out
- Wind 2/10 Low
- Air quality 2/10 Low 0 unhealthy d/yr today · 1 by 30 yrs out
Nearby sold comps map
Loading sold comps map…
Walkable amenities ~0.75 mi
Loading nearby amenities…
Taxation est. · year 1
- Rental income
- $17,274
- − Mortgage interest
- −$8,682
- − Property taxes
- −$1,794
- − Insurance
- −$775
- − Repairs & maintenance
- −$1,382
- − Management
- −$1,382
- − Depreciation
- −$4,509
- Taxable loss
- −$1,250
- Est. tax savings @ 24.0%
- +$300
- After-tax cash flow
- $1,624/yr
For passive investors: Depreciation is non-cash, so a rental often shows a tax loss while cash-flowing — sheltering income. Rental losses are passive: they offset passive income freely, and up to $25,000/yr can offset ordinary (W-2) income if you actively participate and your MAGI is under $100k (phasing out to $0 by $150k); unused losses carry forward. On sale, claimed depreciation is recaptured at up to 25%, and gains may owe capital-gains tax (a 1031 exchange can defer both). Figures are a year-1 estimate at your 24.0% rate — not tax advice; consult a CPA.
Schools (NCES district)
- District
- Cedar Rapids Community School District
- NCES district ID
- 1906540
- Math proficiency
- 50% ▼ -12.00%
- Reading proficiency
- 59% ▼ -6.00%
- Median HH income
- $53,568
- Composite
- 46.82/100
- National rank
- #2378
- State rank
- #265 of 289 in IA
Livability — Cedar Rapids
- Score
- 78/100
- State rank
- #134
- US rank
- #2474
Category grades
Schools grade is shown separately in the Schools card above.
Census & demographics
- Census place
- Cedar Rapids, IA
- County
- Linn County · 179,860 people
- City population
- 137,154
- Metro
- Cedar Rapids, IA
- Population (ZIP)
- 26,526
- Household income
- $70,123
- Rent vs Own
- Severe rent burden
- 715.0
Population outlook (Linn County) Hauer SSP2
- Today (2025)
- 239,589 people
- By 2030
- 248,587 · +3.8%
- By 2040
- 264,817 · +10.5%
- By 2050
- 278,685 · +16.3%
- By 2075
- 311,754 · +30.1%
- By 2100
- 336,773 · +40.6%
Race, ethnicity, and origin ACS 2023
- Neighborhood character
- Predominantly White (79%)
- Race & ethnicity
- White 79% Black 9% Two or more races 7% Hispanic / Latino 5% Asian 2%
- Common ancestry
- Portuguese 4% Lithuanian 2% Iranian 1%
- Foreign-born
- 6% · Canada, China
- Languages at home
- 92% English-only · Spanish 3% French/Haitian/Cajun 1% Other Asian/Pacific 1%
Political lean MEDSL · Linn
- 2024 margin
- Lean D (+9.9) · D 54.2% · R 44.3% · Other 1.4%
- 2008→2024 swing
- -11.6pp toward R · 2008: 21.5pp · 2024: 9.9pp
- All cycles
- 2024: D+9.9 2020: D+13.7 2016: D+9.0 2012: D+17.6 2008: D+21.5
Not yet ingested
- Civics
- —
Market trends
- HPI YoY
- ▼ -137.56%
- Current HPI
- 201.6053
- Rent YoY
- ▲ 12.37%
- Metro
- Cedar Rapids, IA
- State GDP YoY
- ▲ 2.48%
- F500 in state
- 4
Industry mix (Fortune 500 HQ in IA)
| Industry | F500 HQs | Revenue |
|---|---|---|
| Financial Services | 1 | $16B |
|
||
| Retail / Convenience | 1 | $15B |
|
||
Price history
+91.4% since first listed5 events — show timeline
- 2026-06-03 Pending — CRAAR, CDRMLS
- 2026-05-30 Price Changed $155,000 CRAAR, CDRMLS
- 2026-05-15 Listed $165,000 CRAAR, CDRMLS
- 2019-08-16 Sold (Public Records) $95,000 Public Records
- 2008-09-22 Sold (Public Records) $81,000 Public Records
Property tax history
+0.8%/yrLatest (2025): $1,794 · +7.9% YoY. Source: county tax records.
Cash-flow waterfall
monthlySold comps — $/sqft
last 12 mo · ≤1 miLoading sold comps…