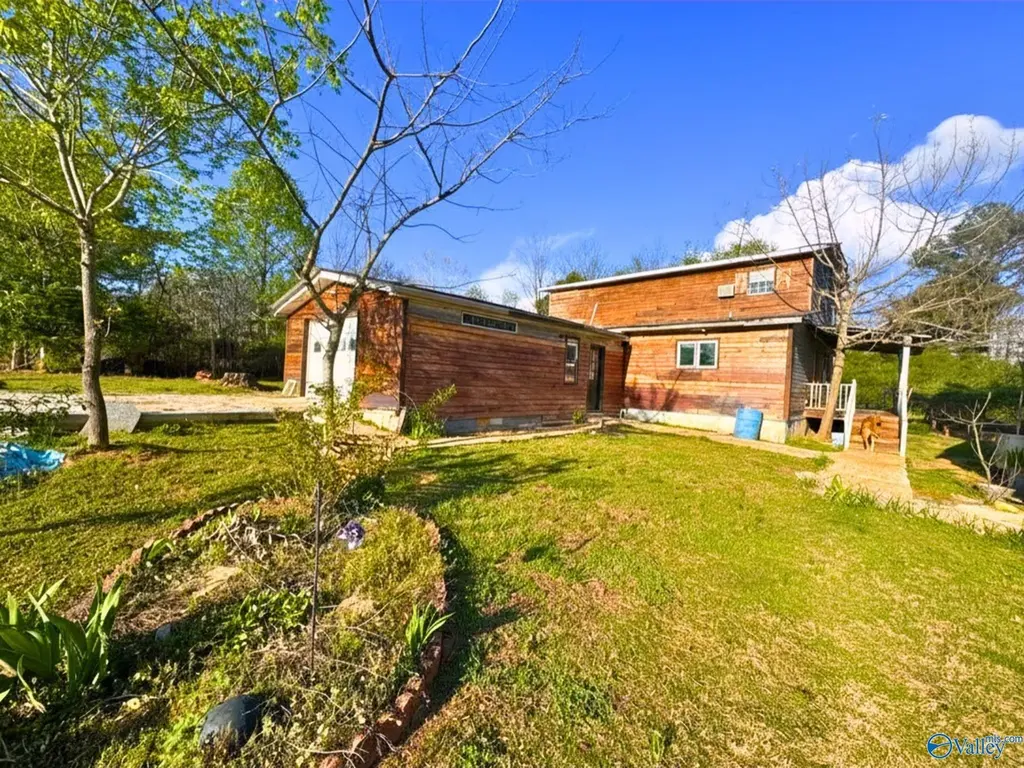
3474 Merrill Mountain Rd · New Hope, AL
Flood risk No data
- FEMA flood zone
- —
- Chance of flooding over 30 yrs
- —
- Est. flood insurance / yr
- —
Fire risk No data
- Est. fire insurance / yr
- —
Heat risk No data
- Hot days now (above threshold)
- —
- Hot days in 30 yrs
- —
Wind risk No data
- Chance of severe wind over 30 yrs
- —
Air-quality risk No data
- Unhealthy air days now
- —
- Unhealthy air days in 30 yrs
- —
Risk factors via First Street. Map © Google.
Why this score? — see what drove the B- grade
The composite is a weighted blend of 9 inputs, each scored 0–100. Each bar is that input's sub-score; the figure is the points it added to the 100-point composite (weight × sub-score).
- Cash flow +30.0/30.0
- DSCR +10.0/10.0
- 1% rule +8.6/10.0
- ARV discount +5.9/15.0
- Livability +3.4/5.0
- Rent growth +2.5/5.0
- Condition / age +2.5/5.0
- Schools +2.2/10.0
- Appreciation +0.0/10.0
$122,000
🖨 Deal sheet (PDF) 📄 Offer letter ✓ Due diligence
Listing remarks MLS
1.27+/- ON MERRILL MOUNTAIN
Key facts
- Abundant fruit trees
- Custom wood details
- Oak covered porch
Tags
Neighborhood map
What this means for you Summary
Snapshot
- This is a 4-bed/1.5-bath single-family listed at $122k.
Deal economics
- At list price, monthly cash flow is $597 ($7k/yr) — positive.
- The deal already cash-flows at list — no discount required.
- Meets the 1% rule at list price ($2k rent vs $122k).
- Cap rate 12.2% vs local median 3.4% in New Hope — top-decile yield for the area; either an underpriced asset or a hidden risk that comps aren't pricing in. Stress-test before assuming the spread holds.
Location & tenants
- Location reads 67/100 on livability (#91 in AL) — a middle-class / working-renter tenant base. Strengths: crime A+, cost of living A+, housing A+; Watch: amenities F, commute F, health & safety F.
- Marshall County (rural): math 14% / reading 38% proficiency, ranked #86 of 129 in AL (top 67%) — low school quality limits family demand, transient renter base, plan for 1-2y turnover; 63% free/reduced lunch — lower-income household profile, screen leases tightly.
- Zoned schools: Kate D Smith Dar Elementary School (math 27% / reading 52%, grade F, #243 of 627 statewide, top 41%, 585 students, 43% FRL); Kate Duncan Smith Dar Middle (math 13% / reading 54%, grade F, #99 of 257 statewide, top 39%, 364 students, 42% FRL); Kate D Smith Dar High School (math 32% / reading 52%, grade F, #28 of 305 statewide, top 10%, 394 students, 34% FRL) — zoned schools average 39% FRL vs 63% district-wide (24 pts lower); this property's tenant base skews higher-income than the district average.
- Zoned-school proficiency averages 38% at this address vs 26% district-wide (+12 pts) — the actual schools serving this property are materially stronger than the Marshall County average implies; a family-tenant draw the district grade alone would hide.
- Market conditions: 95 active listings in the ZIP; 163 units permitted in Marshall County in 2024 (0 in 5+ unit buildings).
Forward outlook
- Local home prices are declining (-3.0%/yr); year-one equity from $843 of loan paydown is wiped out by about $4k of value loss. Plan a longer hold.
- At projected returns (-3.0% appreciation + 3.0% rent growth), your $34k cash investment doubles in ~6 years — after that, you're playing with house money.
Negotiation context
- Only 3 days on market — expect competitive offers; lowballing is unlikely to land.
- 3 sale attempts since 6y ago with the ask held roughly flat each time — persistent listings suggest the price (not the market) is what's stuck; bring a comps-based counter.
- Current owner paid $80k; list at $122k implies a 53% gain — meaningful room to come down on a strong offer.
Questions for the listing agent
- Is there a deadline driving the sale (1031 exchange, divorce, estate, relocation)? That informs how much negotiation room exists.
- Schools are D-rated, which usually means shorter tenancies and higher turnover. Who's the typical renter profile here, and what's been the actual vacancy rate?
- What's the average days-on-market for RENTAL listings here right now (not sales)? A rising rental-DOM trend means longer vacancies and softer asking-rent achievability than the comps imply.
- What's the recent tenant-quality profile in this submarket — average credit score on applications, eviction rate, late-payment / NSF rate, and stable-employment percentage? A property-management company in the area should have these aggregated.
- How much new for-sale + rental construction is in the pipeline within 1–3 miles? Heavy new supply typically softens prices + rents 12–24 months out; constrained supply supports both.
Investment metrics
- 1% rule
- 1.36% ✓
- Cap rate
- 12.17%
- Cash-on-cash
- 20.99%
- DSCR
- 1.93
- GRM
- 6.1
CMA / ARV
- ARV (on-the-fly)
- $117,810
- Comps found
- 1
Show comp detail 1 sale within ~0.75 mi
| Address | Dist | Beds/Ba | Sqft | Sold | Price | $/sf | Match |
|---|---|---|---|---|---|---|---|
| 3474 Merrill Mountain Rd | 0.00mi | 4/1.5 | 1,800 (+7%) | 1mo | $126,200 | $70 | 88 |
Match score weights: distance 35% · size 25% · config 20% · recency 20%. Top-matched comps best support the ARV.
Projected returns pro-forma
-3.0% appreciation · 3.0% rent growth · sell at horizon
- IRR
- 13.4%
- Equity multiple
- 1.53×
- Total profit
- $18,228
- Equity at exit
- $18,191
- IRR
- 22.2%
- Equity multiple
- 2.89×
- Total profit
- $64,657
- Equity at exit
- $10,548
Cash invested: $34,160 (down + closing). Projections, not guarantees.
Landlord ↔ Tenant lean methodology
- Overall (STATE)
- 90 Strongly Landlord-Friendly
- State Alabama
- 90 Strongly Landlord-Friendly · R+15
- County
- — inherits STATE
- City
- — inherits STATE
ZIP-level market 35747
- Home prices YoY
- -28.9%
- Active inventory
- 95
- Price-to-rent
- 6.1×
Monthly cashflow live
- Estimated rent
- $1,665 medium interval (Pro) →
- Mortgage (P&I)
- −$640
- Tax from tax record
- −$27 /mo · $327/yr
- Insurance
- −$51
- HOA
- −$0
- Vacancy / Maint / Mgmt
- −$350
- Net cashflow
- $597
Break-even live
Sensitivity live
| Price | -10% $666 | -5% $632 | +0% $597 | +5% $563 | +10% $528 |
|---|---|---|---|---|---|
| Rent | -10% $466 | -5% $532 | +0% $597 | +5% $663 | +10% $729 |
| Rate | -1.0pp $659 | -0.5pp $628 | base $597 | +0.5pp $566 | +1.0pp $534 |
UW: 25.0% down · 7.5% · 30yr · 1.5% tax · 5.0% vac · 8.0% maint · 8.0% mgmt
Financing live
Cash to close
- Down payment
- $30,500
- Closing costs
- $3,660
- Reserves months
- —
- Total cash needed
- —
Loan-product check · same deal, 3 products live
Conventional
25% down · 7.5% · 30yr
- Down + closing
- —
- Monthly P&I
- —
- Monthly cashflow
- —
- DSCR
- —
- Eligible?
- —
Personal DTI + credit; lowest rate.
DSCR
20% down · 8.5% · 30yr
- Down + closing
- —
- Monthly P&I
- —
- Monthly cashflow
- —
- DSCR
- —
- Eligible?
- —
No personal income docs; deal must DSCR.
Hard money
10% down · 12.0% · 12mo
- Down + closing
- —
- Monthly P&I
- —
- Monthly cashflow
- —
- DSCR
- —
- Eligible?
- —
Short-term bridge; refi at stabilization.
Listing history 8 events
-
2026-04-13status Pending
-
2026-04-11status Active
-
2026-04-04status Pending
-
2026-04-03$122,000 Active
-
2023-06-30soldstatus $79,900
-
2020-05-15soldstatus $2,000 Sold 27-char remark
Show marketing remark (27 chars)
1.27+/- ON MERRILL MOUNTAIN
-
2020-04-10status Pending 27-char remark
Show marketing remark (27 chars)
1.27+/- ON MERRILL MOUNTAIN
-
2020-04-08$2,000 Active 27-char remark
Show marketing remark (27 chars)
1.27+/- ON MERRILL MOUNTAIN
ⓘ Source: listings_history table (triggers on properties + properties_extension) + one-shot
backfill from property_details.listing_events for pre-trigger history.
Tax reassessment forecast AL · Resets to sale price
- Current annual tax
- $327 · $27/mo
- Projected year-2 tax
- $500 · $42/mo
- Expected delta
- +$173/yr (+$14/mo · 52.8%)
ⓘ Screening estimate from a state-policy table — verify with the county assessor before closing.
Nearby sold comps map
Loading sold comps map…
Walkable amenities ~0.75 mi
Loading nearby amenities…
Taxation est. · year 1
- Rental income
- $19,979
- − Mortgage interest
- −$6,834
- − Property taxes
- −$327
- − Insurance
- −$610
- − Repairs & maintenance
- −$1,598
- − Management
- −$1,598
- − Depreciation
- −$3,549
- Taxable income
- $5,462
- Est. tax owed @ 24.0%
- −$1,311
- After-tax cash flow
- $5,858/yr
For passive investors: Depreciation is non-cash, so a rental often shows a tax loss while cash-flowing — sheltering income. Rental losses are passive: they offset passive income freely, and up to $25,000/yr can offset ordinary (W-2) income if you actively participate and your MAGI is under $100k (phasing out to $0 by $150k); unused losses carry forward. On sale, claimed depreciation is recaptured at up to 25%, and gains may owe capital-gains tax (a 1031 exchange can defer both). Figures are a year-1 estimate at your 24.0% rate — not tax advice; consult a CPA.
Schools (NCES district)
- District
- Marshall County
- NCES district ID
- 0100006
- Math proficiency
- 14% ▼ -26.00%
- Reading proficiency
- 38% ▲ 2.00%
- Median HH income
- $40,439
- Composite
- 21.88/100
- National rank
- #8234
- State rank
- #86 of 129 in AL
Livability — New Hope
- Score
- 67/100
- State rank
- #91
- US rank
- #11179
Category grades
Schools grade is shown separately in the Schools card above.
Census & demographics
- City population
- 4,908
- Population (ZIP)
- 6,546
Population outlook (Marshall County) Hauer SSP2
- Today (2025)
- 97,402 people
- By 2030
- 98,138 · +0.8%
- By 2040
- 98,502 · +1.1%
- By 2050
- 97,024 · -0.4%
- By 2075
- 89,334 · -8.3%
- By 2100
- 74,749 · -23.3%
Race, ethnicity, and origin ACS 2023
- Neighborhood character
- Predominantly White (89%)
- Race & ethnicity
- White 89% Two or more races 8% Hispanic / Latino 7% Asian 2%
- Hispanic origin (detail)
- Puerto Rican 2%
- Common ancestry
- Slovak 4% Italian 1% Romanian 1%
- Foreign-born
- 2% · South Korea, Canada
- Languages at home
- 97% English-only · Spanish 2% Korean 1%
Political lean MEDSL · Marshall
- 2024 margin
- Solid R (+71.7) · D 13.8% · R 85.5%
- 2008→2024 swing
- -15.4pp toward R · 2008: -56.4pp · 2024: -71.7pp
- All cycles
- 2024: R+71.7 2020: R+68.7 2016: R+69.5 2012: R+60.1 2008: R+56.4
Not yet ingested
- Civics
- —
Market trends
- HPI YoY
- ▼ -91.60%
- Current HPI
- 225.7152
- Rent YoY
- —
- Metro
- —
- State GDP YoY
- ▲ 2.94%
- F500 in state
- 4
Industry mix (Fortune 500 HQ in AL)
| Industry | F500 HQs | Revenue |
|---|---|---|
| Financial Services | 1 | $8B |
|
||
| Healthcare | 1 | $5B |
|
||
Price history
+6000.0% since first listed8 events — show timeline
- 2026-04-13 Pending — VMLS
- 2026-04-11 Relisted — VMLS
- 2026-04-04 Pending — VMLS
- 2026-04-03 Listed $122,000 VMLS
- 2023-06-30 Sold (Public Records) $79,900 Public Records
- 2020-05-15 Sold (MLS) $2,000 VMLS
- 2020-04-10 Pending — VMLS
- 2020-04-08 Listed $2,000 VMLS
Property tax history
-8.4%/yrLatest (2025): $327 · -33.4% YoY. Source: county tax records.
Cash-flow waterfall
monthlySold comps — $/sqft
last 12 mo · ≤1 miLoading sold comps…