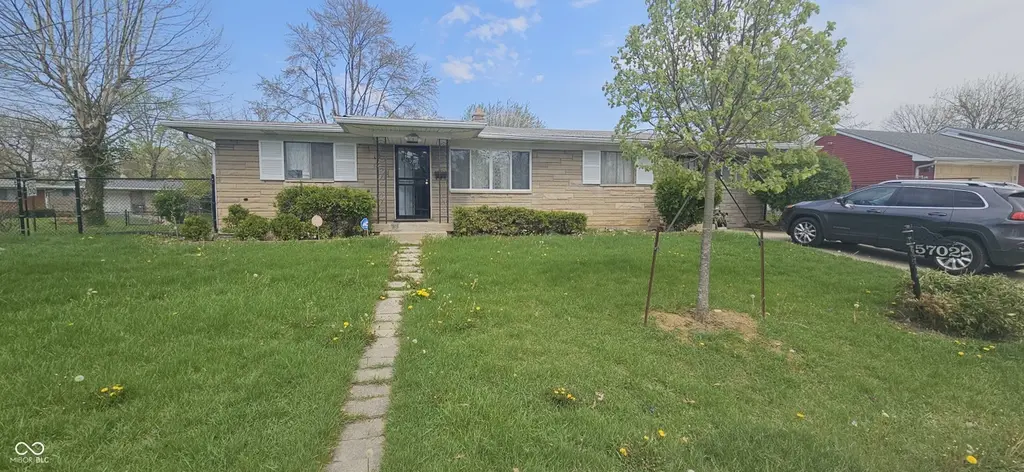
5702 E 40th St · Indianapolis city (balance), IN
Flood risk 1/10 · Minimal
- FEMA flood zone
- X (unshaded)
- Chance of flooding over 30 yrs
- 0.0%
- Est. flood insurance / yr
- $473 – $860
Fire risk 1/10 · Minimal
- Est. fire insurance / yr
- $717 – $1,331
Heat risk 3/10 · Minor
- Hot days now (above 101°F)
- 7 days/yr
- Hot days in 30 yrs
- 18 days/yr
Wind risk 2/10 · Minimal
- Chance of severe wind over 30 yrs
- 0.0%
Air-quality risk 4/10 · Minor
- Unhealthy air days now
- 5 days/yr
- Unhealthy air days in 30 yrs
- 7 days/yr
Risk factors via First Street. Map © Google.
Why this score? — see what drove the D grade
The composite is a weighted blend of 9 inputs, each scored 0–100. Each bar is that input's sub-score; the figure is the points it added to the 100-point composite (weight × sub-score).
- Cash flow +16.8/30.0
- ARV discount +7.1/15.0
- DSCR +5.2/10.0
- Rent growth +4.2/5.0
- 1% rule +3.9/10.0
- Livability +2.5/5.0
- Condition / age +2.5/5.0
- Schools +1.4/10.0
- Appreciation +0.0/10.0
$184,900
🖨 Deal sheet (PDF) 📄 Offer letter ✓ Due diligence
Listing remarks
Great investment opportunity on Indy's Eastside. This 4-bedroom, 1.5 bath stone ranch offers over 2,000 sq ft of livable space, including a partially finished basement. The home features solid bones, working mechanicals, and plenty of upside for anyone looking to add value. With some cosmetic updates and minor improvements, buyers can unlock instant equity. Sitting on a nice corner lot with a fully fenced backyard, this property is ideal for investors, flippers, or buyers seeking a value-add project.
Key facts
- Corner lot
- 0.24 acre lot
- Built 1951
Tags
Property features AI
Finance
- Other: Approximately 60% of optional level finished
Exterior
- Utilities: Public water; Municipal sewer connected; Solid waste service available
- Home design: Single-family residence; One story
- Construction: Stone construction; Block foundation
- Exterior features: Approximately 0.25 acre lot
Interior
- Kitchen: Refrigerator
- Bedrooms: 4 bedrooms (all on the main level)
- Bathrooms: 1 full bath; 1 half bath
- Heating & cooling: Natural gas heating; Central air conditioning
- Interior features: Eat-in kitchen; Partially finished basement
- Laundry & utility: No specific laundry appliances listed
Neighborhood map
What this means for you Summary
Snapshot
- This is a 4-bed/1.5-bath single-family listed at $185k.
Deal economics
- At list price, monthly cash flow is $118 ($1k/yr) — positive.
- The deal already cash-flows at list — no discount required.
- To meet the 1% rule (rent ≥ 1% of price), the offer needs to be $164k (11.2% below list).
- Recommended offer: $164k (11.2% below list) — sets the bar for 1% rule.
- Cap rate 7.1% vs local median 4.4% in Indianapolis city (balance) — top-decile yield for the area; either an underpriced asset or a hidden risk that comps aren't pricing in. Stress-test before assuming the spread holds.
Location & tenants
- Location reads: area grade D — affects rentability + tenant quality, not the cash-flow math above.
- Indianapolis Public Schools (urban): math 14% / reading 20% proficiency, ranked #286 of 301 in IN (top 95%) — low school quality limits family demand, transient renter base, plan for 1-2y turnover; 77% free/reduced lunch — lower-income household profile, screen leases tightly.
- Zoned schools: Center For Inquiry School 84 (math 64% / reading 69%, grade B+, #65 of 994 statewide, top 7%, 469 students, 8% FRL); H L Harshman Middle School (math 3% / reading 16%, grade F, #316 of 330 statewide, top 96%, 549 students, 84% FRL) — zoned schools average 46% FRL vs 77% district-wide (31 pts lower); this property's tenant base skews higher-income than the district average.
- Zoned-school proficiency averages 38% at this address vs 17% district-wide (+21 pts) — the actual schools serving this property are materially stronger than the Indianapolis Public Schools average implies; a family-tenant draw the district grade alone would hide.
- Market conditions: Rents rising fast (+6.8%/yr); 153 active listings in the ZIP; 10 comparable units currently listed for rent nearby; rentals at typical pace (median 26d on market — plan ~3-4 weeks tenant-placement turnaround); 1,906 units permitted in Marion County in 2024 (621 in 5+ unit buildings).
- This rent runs 39% of the median local income ($50k/yr) — at the standard rent-burdened threshold; future hikes will face affordability resistance.
Forward outlook
- Local home prices are declining (-3.0%/yr); year-one equity from $1k of loan paydown is wiped out by about $6k of value loss. Plan a longer hold.
- Marion County population projected at +18% by 2050 — long-run rental-demand tailwind backs the buy-and-hold thesis.
Negotiation context
- Only 9 days on market — expect competitive offers; lowballing is unlikely to land.
Risks & watch-outs
- Watch-outs: built in 1951 — expect roof / HVAC / electrical / plumbing capex.
Questions for the listing agent
- Built in 1951 — when were the roof, HVAC, electrical panel, plumbing, and water heater last replaced?
- Is there a deadline driving the sale (1031 exchange, divorce, estate, relocation)? That informs how much negotiation room exists.
- The area grade is low — what's the realistic commute time and amenity access for the typical tenant pool here? Any planned neighborhood developments (good or bad) we should know about?
- What's the average days-on-market for RENTAL listings here right now (not sales)? A rising rental-DOM trend means longer vacancies and softer asking-rent achievability than the comps imply.
- What's the recent tenant-quality profile in this submarket — average credit score on applications, eviction rate, late-payment / NSF rate, and stable-employment percentage? A property-management company in the area should have these aggregated.
- How much new for-sale + rental construction is in the pipeline within 1–3 miles? Heavy new supply typically softens prices + rents 12–24 months out; constrained supply supports both.
Investment metrics
- 1% rule
- 0.89% ✗
- Cap rate
- 7.06%
- Cash-on-cash
- 2.75%
- DSCR
- 1.12
- GRM
- 9.4
CMA / ARV
- ARV (on-the-fly)
- $183,456
- Comps found
- 12
Show comp detail 12 sales within ~0.75 mi
| Address | Dist | Beds/Ba | Sqft | Sold | Price | $/sf | Match |
|---|---|---|---|---|---|---|---|
| 5426 Culver St | 0.28mi | 3/1.0 (-1) | 1,728 (-2%) | 2mo | $179,000 | $104 | 75 |
| 3919 Barnor Dr | 0.52mi | 5/2.0 (+1) | 1,755 (-0%) | 2mo | $130,500 | $74 | 66 |
| 4013 N Graham Ave | 0.07mi | 3/2.5 (-1) | 1,913 (+8%) | 9mo | $200,000 | $105 | 66 |
| 4128 N Webster Ave | 0.39mi | 4/2.0 | 1,924 (+9%) | 2mo | $195,000 | $101 | 63 |
| 6117 Marilyn Rd | 0.48mi | 4/2.0 | 1,924 (+9%) | 7mo | $173,000 | $90 | 55 |
| 3922 N Butler Ave | 0.55mi | 4/2.0 | 1,589 (-10%) | 4mo | $123,500 | $78 | 53 |
| 6134 Marilyn Rd | 0.51mi | 4/2.0 | 1,514 (-14%) | 2mo | $173,000 | $114 | 49 |
| 4428 N Bolton Ave | 0.57mi | 3/1.5 (-1) | 1,540 (-13%) | 0mo | $219,900 | $143 | 47 |
| 5349 Culver St | 0.43mi | 3/1.5 (-1) | 2,009 (+14%) | 9mo | $175,000 | $87 | 44 |
| 3823 N Butler Ave | 0.53mi | 3/2.0 (-1) | 1,550 (-12%) | 5mo | $220,000 | $142 | 44 |
| 4463 Campbell Ave | 0.68mi | 3/1.5 (-1) | 1,594 (-10%) | 4mo | $76,000 | $48 | 44 |
| 6149 Woodfox Ct | 0.66mi | 3/2.0 (-1) | 1,560 (-12%) | 3mo | $174,900 | $112 | 40 |
Match score weights: distance 35% · size 25% · config 20% · recency 20%. Top-matched comps best support the ARV.
Projected returns pro-forma
-3.0% appreciation · 6.76% rent growth · sell at horizon
- IRR
- -8.1%
- Equity multiple
- 0.69×
- Total profit
- $-16,006
- Equity at exit
- $27,569
- IRR
- 5.5%
- Equity multiple
- 1.47×
- Total profit
- $24,211
- Equity at exit
- $15,987
Cash invested: $51,772 (down + closing). Projections, not guarantees.
Landlord ↔ Tenant lean methodology
- Overall (STATE)
- 90 Strongly Landlord-Friendly
- State Indiana
- 90 Strongly Landlord-Friendly · R+11
- County
- — inherits STATE
- City
- — inherits STATE
ZIP-level market 46226
- Rents YoY
- 6.8%
- Active inventory
- 153
- Price-to-rent
- 9.4×
Monthly cashflow live
- Estimated rent
- $1,642 high interval (Pro) →
- Mortgage (P&I)
- −$970
- Tax from tax record
- −$132 /mo · $1,581/yr
- Insurance
- −$77
- HOA
- −$0
- Vacancy / Maint / Mgmt
- −$345
- Net cashflow
- $118
Break-even live
Sensitivity live
| Price | -10% $223 | -5% $171 | +0% $118 | +5% $66 | +10% $14 |
|---|---|---|---|---|---|
| Rent | -10% $-11 | -5% $54 | +0% $118 | +5% $183 | +10% $248 |
| Rate | -1.0pp $212 | -0.5pp $166 | base $118 | +0.5pp $71 | +1.0pp $22 |
UW: 25.0% down · 7.5% · 30yr · 1.5% tax · 5.0% vac · 8.0% maint · 8.0% mgmt
Financing live
Cash to close
- Down payment
- $46,225
- Closing costs
- $5,547
- Reserves months
- —
- Total cash needed
- —
Loan-product check · same deal, 3 products live
Conventional
25% down · 7.5% · 30yr
- Down + closing
- —
- Monthly P&I
- —
- Monthly cashflow
- —
- DSCR
- —
- Eligible?
- —
Personal DTI + credit; lowest rate.
DSCR
20% down · 8.5% · 30yr
- Down + closing
- —
- Monthly P&I
- —
- Monthly cashflow
- —
- DSCR
- —
- Eligible?
- —
No personal income docs; deal must DSCR.
Hard money
10% down · 12.0% · 12mo
- Down + closing
- —
- Monthly P&I
- —
- Monthly cashflow
- —
- DSCR
- —
- Eligible?
- —
Short-term bridge; refi at stabilization.
Rent comps 10 comps
| Address | Beds | Baths | Sqft | Rent | $/sqft | DOM | Units | Dist |
|---|---|---|---|---|---|---|---|---|
| 3940 N Graham Ave Indianapolis, IN | 3.0 | 1.0 | 2378 | $1,501 | $0.63 | 45d | 1 | 0.11mi |
| 3912 N Webster Ave Indianapolis, IN | 4.0 | 1.0 | 1274 | $1,350 | $1.06 | 23d | 1 | 0.39mi |
| 3710 N Layman Ave Indianapolis, IN | 3.0 | 1.5 | 1638 | $1,500 | $0.92 | 0d | 1 | 0.43mi |
| 3919 Barnor Dr Indianapolis, IN | 5.0 | 2.0 | 1800 | $2,495 | $1.39 | 25d | 1 | 0.55mi |
| 5865 E 46th St Indianapolis, IN | 3.0 | 2.0 | 1400 | $1,500 | $1.07 | 45d | 1 | 0.71mi |
| 3707 N Riley Ave Indianapolis, IN | 3.0 | 1.5 | 2016 | $1,500 | $0.74 | 25d | 1 | 0.91mi |
| 4176 N Irwin Ave Indianapolis, IN | 4.0 | 2.0 | 2006 | $1,595 | $0.80 | 23d | 1 | 0.95mi |
| 3734 Manor Ct Indianapolis, IN | 3.0 | 1.0 | 1414 | $1,399 | $0.99 | 9d | 1 | 1.15mi |
| 3070 N Layman Ave #1 Indianapolis, IN | 3.0 | 2.0 | 1480 | $1,700 | $1.15 | 45d | 1 | 1.20mi |
| 5116 Wexford Rd Indianapolis, IN | 4.0 | 2.0 | 1938 | $2,045 | $1.06 | 6d | 1 | 1.27mi |
Listing history 8 events
-
2026-06-22price $184,900 Active 9 DOM
-
2026-06-21days on market $189,900 Active 9 DOM
-
2026-06-18days on market $189,900 Active 6 DOM
-
2026-06-17days on market $189,900 Active 5 DOM
-
2026-06-16days on market $189,900 Active 4 DOM
-
2026-06-15days on market $189,900 Active 3 DOM
-
2026-06-13remarks 505-char remark
-
2026-06-13$189,900 Active 1 DOM
ⓘ Source: listings_history table (triggers on properties + properties_extension) + one-shot
backfill from property_details.listing_events for pre-trigger history.
Tax reassessment forecast IN · Partial reset (capped growth)
- Current annual tax
- $1,581 · $132/mo
- Projected year-2 tax
- $1,581 · $132/mo
- Expected delta
- $0/yr ($0/mo · 0.0%)
ⓘ Screening estimate from a state-policy table — verify with the county assessor before closing.
Climate risk First Street
- Flood 1/10 Low FEMA zone X (unshaded) · 0% chance over 30 yrs
- Wildfire 1/10 Low
- Heat 3/10 Moderate 7 d/yr ≥101°F today · 18 d/yr by 30 yrs out
- Wind 2/10 Low 0% chance of damaging wind over 30 yrs
- Air quality 4/10 Moderate 5 unhealthy d/yr today · 7 by 30 yrs out
Nearby sold comps map
Loading sold comps map…
Walkable amenities ~0.75 mi
Loading nearby amenities…
Taxation est. · year 1
- Rental income
- $19,701
- − Mortgage interest
- −$10,357
- − Property taxes
- −$1,581
- − Insurance
- −$924
- − Repairs & maintenance
- −$1,576
- − Management
- −$1,576
- − Depreciation
- −$5,379
- Taxable loss
- −$1,694
- Est. tax savings @ 24.0%
- +$406
- After-tax cash flow
- $1,828/yr
For passive investors: Depreciation is non-cash, so a rental often shows a tax loss while cash-flowing — sheltering income. Rental losses are passive: they offset passive income freely, and up to $25,000/yr can offset ordinary (W-2) income if you actively participate and your MAGI is under $100k (phasing out to $0 by $150k); unused losses carry forward. On sale, claimed depreciation is recaptured at up to 25%, and gains may owe capital-gains tax (a 1031 exchange can defer both). Figures are a year-1 estimate at your 24.0% rate — not tax advice; consult a CPA.
Schools (NCES district)
- District
- Indianapolis Public Schools
- NCES district ID
- 1804770
- Math proficiency
- 14% ▼ -7.00%
- Reading proficiency
- 20% ▼ -3.00%
- Median HH income
- $32,034
- Composite
- 13.69/100
- National rank
- #9499
- State rank
- #286 of 301 in IN
Livability — Indianapolis city (balance)
No livability data for this city. (Only ~50 U.S. cities are tracked.)
Census & demographics
- Census place
- Indianapolis city (balance), IN
- County
- Marion County · 998,460 people
- City population
- 881,119
- Metro
- Indianapolis-Carmel-Anderson, IN
- Population (ZIP)
- 47,099
- Household income
- $50,325
- Rent vs Own
- Severe rent burden
- 2742.0
Population outlook (Marion County) Hauer SSP2
- Today (2025)
- 1,025,572 people
- By 2030
- 1,065,727 · +3.9%
- By 2040
- 1,141,577 · +11.3%
- By 2050
- 1,208,920 · +17.9%
- By 2075
- 1,367,288 · +33.3%
- By 2100
- 1,438,201 · +40.2%
Race, ethnicity, and origin ACS 2023
- Neighborhood character
- Diverse neighborhood (Simpson 0.62)
- Race & ethnicity
- Black 53% White 25% Hispanic / Latino 17% Two or more races 9% Asian 2%
- Hispanic origin (detail)
- Mexican 11%
- Common ancestry
- Lithuanian 1% Italian 1% Romanian 1%
- Foreign-born
- 11% · Canada
- Languages at home
- 86% English-only · Spanish 10% French/Haitian/Cajun 1% Other Asian/Pacific 1%
Political lean MEDSL · Marion
- 2024 margin
- Strong D (+27.7) · D 63.0% · R 35.3% · Other 1.7%
- 2008→2024 swing
- -0.7pp no change · 2008: 28.4pp · 2024: 27.7pp
- All cycles
- 2024: D+27.7 2020: D+29.1 2016: D+22.8 2012: D+22.2 2008: D+28.4
Not yet ingested
- Civics
- —
Market trends
- HPI YoY
- ▼ -218.85%
- Current HPI
- 239.43
- Rent YoY
- ▲ 6.76%
- Metro
- Indianapolis-Carmel-Anderson, IN
- State GDP YoY
- ▲ 2.90%
- F500 in state
- 18
Industry mix (Fortune 500 HQ in IN)
| Industry | F500 HQs | Revenue |
|---|---|---|
| Industrial Machinery | 2 | $37B |
|
||
| Healthcare | 1 | $177B |
|
||
| Pharmaceuticals | 1 | $45B |
|
||
| Metals / Steel | 1 | $18B |
|
||
| Agriculture | 1 | $17B |
|
||
| Packaging | 1 | $12B |
|
||
Price history
1 event — show timeline
- 2026-06-12 Listed $189,900 MIBOR as Distributed by MLS Grid
Property tax history
+7.7%/yrLatest (2025): $1,581 · +14.4% YoY. Source: county tax records.
Cash-flow waterfall
monthlySold comps — $/sqft
last 12 mo · ≤1 miLoading sold comps…