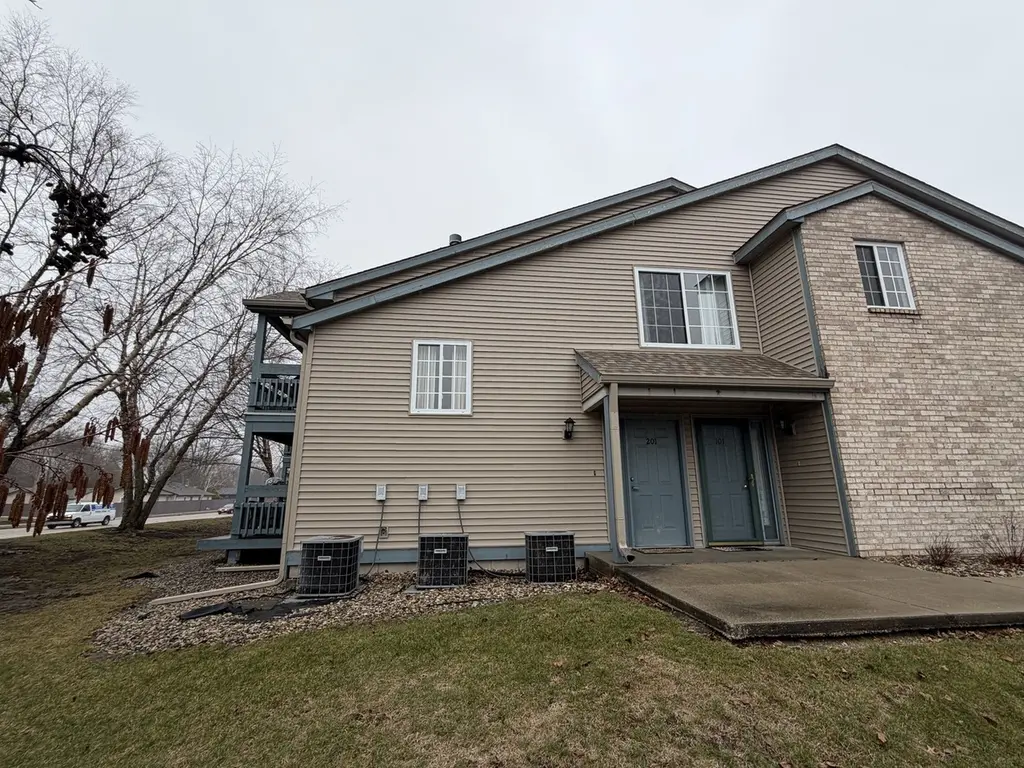
2404 Windward Blvd #201 · Champaign, IL
Flood risk 1/10 · Minimal
- FEMA flood zone
- X (unshaded)
- Chance of flooding over 30 yrs
- 0.0%
- Est. flood insurance / yr
- $507 – $1,088
Fire risk 1/10 · Minimal
- Est. fire insurance / yr
- $804 – $1,492
Heat risk 3/10 · Minor
- Hot days now (above 103°F)
- 7 days/yr
- Hot days in 30 yrs
- 19 days/yr
Wind risk 2/10 · Minimal
- Chance of severe wind over 30 yrs
- 1.0%
Air-quality risk 2/10 · Minimal
- Unhealthy air days now
- 0 days/yr
- Unhealthy air days in 30 yrs
- 1 days/yr
Risk factors via First Street. Map © Google.
Why this score? — see what drove the D grade
The composite is a weighted blend of 9 inputs, each scored 0–100. Each bar is that input's sub-score; the figure is the points it added to the 100-point composite (weight × sub-score).
- ARV discount +10.5/15.0
- Cash flow +9.3/30.0
- Rent growth +4.8/5.0
- 1% rule +4.5/10.0
- Livability +4.2/5.0
- Condition / age +4.0/5.0
- DSCR +2.6/10.0
- Schools +2.2/10.0
- Appreciation +0.0/10.0
$183,900
🖨 Deal sheet (PDF) 📄 Offer letter ✓ Due diligence
Listing remarks MLS
Welcome home to this beautiful 2 bedroom, 2 bath condo in the desirable Ponds of Windsor! The bright, open living space features a cozy fireplace and brand-new waterproof vinyl flooring that flows throughout. Sliding glass doors lead to a private balcony where you can relax and enjoy peaceful views overlooking Morrissey Park. The spacious primary suite offers a full ensuite bath and double closets, providing plenty of storage. A second bedroom and full bath offer flexibility for guests, a home office, or additional living space. Residents also enjoy access to the community pool-perfect for cooling off and relaxing during the warmer months. With its comfortable layout, scenic views, and great amenities, this condo is a wonderful place to call home!
Key facts
- $250 HOA
- Garage
- Community pool
Neighborhood map
What this means for you Summary
Snapshot
- This is a 2-bed/2.0-bath condo listed at $184k. Condition is rated good.
Deal economics
- At list price, monthly cash flow is $-134 ($-2k/yr) — negative.
- To cash-flow at today's rent, offer at most $165k (10.5% below list).
- To meet the 1% rule (rent ≥ 1% of price), the offer needs to be $176k (4.5% below list).
- Recommended offer: $165k (10.5% below list) — sets the bar for cash-flow.
- Cap rate 5.4% vs local median 3.8% in Champaign — top-decile yield for the area; either an underpriced asset or a hidden risk that comps aren't pricing in. Stress-test before assuming the spread holds.
Location & tenants
- Location reads 83/100 on livability (#44 in IL, #902 nationally) — a professional / high-income tenant draw. Strengths: commute A+, cost of living A+, housing A+; Watch: crime F.
- Champaign CUSD 4 (urban): math 24% / reading 26% proficiency, ranked #333 of 620 in IL (top 54%) — low school quality limits family demand, transient renter base, plan for 1-2y turnover.
- Zoned schools: International Prep Academy (math 12% / reading 8%, grade F, #1,517 of 2,056 statewide, top 78%, 568 students, 0% FRL); Jefferson Middle School (math 9% / reading 18%, grade F, #535 of 665 statewide, top 81%, 738 students, 0% FRL); Central High School (math 32% / reading 38%, grade F, #125 of 693 statewide, top 18%, 1,597 students, 0% FRL) — zoned schools average 0% FRL vs 52% district-wide (52 pts lower); this property's tenant base skews higher-income than the district average.
- Market conditions: Rents rising fast (+9.3%/yr); 92 active listings in the ZIP; 8 comparable units currently listed for rent nearby; rentals at typical pace (median 16d on market — plan ~3-4 weeks tenant-placement turnaround); 573 units permitted in Champaign County in 2024 (359 in 5+ unit buildings).
Forward outlook
- Local home prices are declining (-3.0%/yr); year-one equity from $1k of loan paydown is wiped out by about $6k of value loss. Plan a longer hold.
- Champaign County population projected at +15% by 2050 — modest demand growth; plan on rents tracking national, not racing it.
Negotiation context
- It's been on market 103 days — a 9% lower offer ($167k) is reasonable based on typical stale-listing flexibility.
Questions for the listing agent
- What do current leases actually rent for vs. the listed asking? Can we see a recent rent roll and the last 12 months of T-12 income?
- It's been on market 103 days. Have you received any prior offers? Is the seller open to a 11% concession, seller financing, or rate buy-down credit?
- What does the HOA fee cover, when was the last increase, and are there any pending special assessments or reserve-fund shortfalls?
- Any open or pending special assessments — roof, HVAC, plumbing, elevator, façade? What's the per-unit balance and payoff schedule, and is the seller paying it off at close or rolling it to the buyer?
- Why hasn't it sold? Are there any deal-killer items the seller is aware of (foundation, flood, title, zoning, code violations)?
- Is there a deadline driving the sale (1031 exchange, divorce, estate, relocation)? That informs how much negotiation room exists.
- Crime grade is F in this area — have there been break-ins, vandalism, or insurance claims at this property in the last 3 years? What carrier currently insures it and at what premium?
- The area grade is low — what's the realistic commute time and amenity access for the typical tenant pool here? Any planned neighborhood developments (good or bad) we should know about?
- What's the average days-on-market for RENTAL listings here right now (not sales)? A rising rental-DOM trend means longer vacancies and softer asking-rent achievability than the comps imply.
- What's the recent tenant-quality profile in this submarket — average credit score on applications, eviction rate, late-payment / NSF rate, and stable-employment percentage? A property-management company in the area should have these aggregated.
- How much new apartment / multifamily construction is in the pipeline within 1–3 miles? Heavy new supply (>2% of stock underway) typically softens rents 12–24 months out; light construction supports rent growth.
Investment metrics
- 1% rule
- 0.95% ✗
- Cap rate
- 5.42%
- Cash-on-cash
- -3.12%
- DSCR
- 0.86
- GRM
- 8.7
CMA / ARV
- ARV (median comp)
- $197,261
- List price
- $183,900
- Delta
- -6.77%
- Verdict
- FAIR
- Comps
- 20 within 1.0 mi
Projected returns pro-forma
-3.0% appreciation · 8.0% rent growth · sell at horizon
- IRR
- -14.9%
- Equity multiple
- 0.44×
- Total profit
- $-28,876
- Equity at exit
- $27,420
- IRR
- 1.5%
- Equity multiple
- 1.13×
- Total profit
- $6,825
- Equity at exit
- $15,900
Cash invested: $51,492 (down + closing). Projections, not guarantees.
Landlord ↔ Tenant lean methodology
- Overall (STATE)
- 43 Moderately Tenant-Leaning
- State Illinois
- 43 Moderately Tenant-Leaning · D+7
- County
- — inherits STATE
- City
- — inherits STATE
ZIP-level market 61821
- Home prices YoY
- -26.1%
- Rents YoY
- 9.3%
- Active inventory
- 92
- Price-to-rent
- 8.7×
Monthly cashflow live
- Estimated rent
- $1,756 high interval (Pro) →
- Mortgage (P&I)
- −$964
- Tax est. 1.5%
- −$230 /mo · $2,758/yr
- Insurance
- −$77
- HOA
- −$250
- Vacancy / Maint / Mgmt
- −$369
- Net cashflow
- $-134
Break-even live
Sensitivity live
| Price | -10% $-7 | -5% $-70 | +0% $-134 | +5% $-198 | +10% $-261 |
|---|---|---|---|---|---|
| Rent | -10% $-273 | -5% $-203 | +0% $-134 | +5% $-65 | +10% $5 |
| Rate | -1.0pp $-41 | -0.5pp $-87 | base $-134 | +0.5pp $-182 | +1.0pp $-230 |
UW: 25.0% down · 7.5% · 30yr · 1.5% tax · 5.0% vac · 8.0% maint · 8.0% mgmt
Financing live
Cash to close
- Down payment
- $45,975
- Closing costs
- $5,517
- Reserves months
- —
- Total cash needed
- —
Loan-product check · same deal, 3 products live
Conventional
25% down · 7.5% · 30yr
- Down + closing
- —
- Monthly P&I
- —
- Monthly cashflow
- —
- DSCR
- —
- Eligible?
- —
Personal DTI + credit; lowest rate.
DSCR
20% down · 8.5% · 30yr
- Down + closing
- —
- Monthly P&I
- —
- Monthly cashflow
- —
- DSCR
- —
- Eligible?
- —
No personal income docs; deal must DSCR.
Hard money
10% down · 12.0% · 12mo
- Down + closing
- —
- Monthly P&I
- —
- Monthly cashflow
- —
- DSCR
- —
- Eligible?
- —
Short-term bridge; refi at stabilization.
Rent comps 8 comps
| Address | Beds | Baths | Sqft | Rent | $/sqft | DOM | Units | Dist |
|---|---|---|---|---|---|---|---|---|
| 1603 Sandpiper Ct Champaign, IL | 2.0 | 1.0 | 1200 | $1,675 | $1.40 | 45d | 1 | 0.48mi |
| 2406 Leeper Dr Unit Aceves 1 Champaign, IL | 2.0 | 1.5 | 950 | $3,000 | $3.16 | 15d | 1 | 0.50mi |
| 1915 S Mattis Ave Champaign, IL | 1.0–3.0 | 1.0–2.0 | 971 | $1,762 | $1.81 | 15d | 11 | 0.70mi |
| 1924 Melrose Dr Unit C Champaign, IL | 3.0 | 1.0 | 1039 | $1,800 | $1.73 | 15d | 1 | 0.94mi |
| 1920 Melrose Dr Champaign, IL | 2.0 | 1.0 | 1140 | $1,320 | $1.16 | 15d | 1 | 0.95mi |
| 1902 Meadow Dr Champaign, IL | 3.0 | 1.0 | 898 | $1,750 | $1.95 | 15d | 1 | 1.22mi |
| 401 W Curtis Rd Savoy, IL | 1.0–2.0 | 1.0–2.0 | 845 | $1,475 | $1.75 | 15d | 30 | 1.28mi |
| 101 Misty Cv Savoy, IL | 2.0–3.0 | 2.0 | 1349 | $1,810 | $1.34 | 15d | 3 | 1.41mi |
HOA detail condo
- Monthly dues
- $250 · $3,000/yr
- Likely covers
- waterpool
- Assessments
- None detected in remarks — confirm with the listing agent.
Listing history 20 events
-
2026-06-21days on market $183,900 Active 103 DOM
-
2026-06-18days on market $183,900 Active 100 DOM
-
2026-06-18price $183,900 Active 99 DOM
-
2026-06-17days on market $186,900 Active 99 DOM
-
2026-06-16days on market $186,900 Active 98 DOM
-
2026-06-15days on market $186,900 Active 97 DOM
-
2026-06-14days on market $186,900 Active 95 DOM
-
2026-06-13days on market $186,900 Active 94 DOM
-
2026-06-10days on market $186,900 Active 92 DOM
-
2026-06-09days on market $186,900 Active 91 DOM
-
2026-06-08days on market $186,900 Active 90 DOM
-
2026-06-07days on market $186,900 Active 89 DOM
-
2026-06-05days on market $186,900 Active 86 DOM
-
2026-06-03pricedays on market $186,900 Active 85 DOM
-
2026-06-02days on market $189,900 Active 84 DOM
-
2026-06-01days on market $189,900 Active 83 DOM
-
2026-05-31days on market $189,900 Active 82 DOM
-
2026-05-30days on market $189,900 Active 81 DOM
-
2026-04-28price $189,900 757-char remark
Show marketing remark (757 chars)
Welcome home to this beautiful 2 bedroom, 2 bath condo in the desirable Ponds of Windsor! The bright, open living space features a cozy fireplace and brand-new waterproof vinyl flooring that flows throughout. Sliding glass doors lead to a private balcony where you can relax and enjoy peaceful views overlooking Morrissey Park. The spacious primary suite offers a full ensuite bath and double closets, providing plenty of storage. A second bedroom and full bath offer flexibility for guests, a home office, or additional living space. Residents also enjoy access to the community pool-perfect for cooling off and relaxing during the warmer months. With its comfortable layout, scenic views, and great amenities, this condo is a wonderful place to call home!
-
2026-04-08price $194,000 757-char remark
Show marketing remark (757 chars)
Welcome home to this beautiful 2 bedroom, 2 bath condo in the desirable Ponds of Windsor! The bright, open living space features a cozy fireplace and brand-new waterproof vinyl flooring that flows throughout. Sliding glass doors lead to a private balcony where you can relax and enjoy peaceful views overlooking Morrissey Park. The spacious primary suite offers a full ensuite bath and double closets, providing plenty of storage. A second bedroom and full bath offer flexibility for guests, a home office, or additional living space. Residents also enjoy access to the community pool-perfect for cooling off and relaxing during the warmer months. With its comfortable layout, scenic views, and great amenities, this condo is a wonderful place to call home!
ⓘ Source: listings_history table (triggers on properties + properties_extension) + one-shot
backfill from property_details.listing_events for pre-trigger history.
Climate risk First Street
- Flood 1/10 Low FEMA zone X (unshaded) · 0% chance over 30 yrs
- Wildfire 1/10 Low
- Heat 3/10 Moderate 7 d/yr ≥103°F today · 19 d/yr by 30 yrs out
- Wind 2/10 Low 100% chance of damaging wind over 30 yrs
- Air quality 2/10 Low 0 unhealthy d/yr today · 1 by 30 yrs out
Nearby sold comps map
Loading sold comps map…
Walkable amenities ~0.75 mi
Loading nearby amenities…
Taxation est. · year 1
- Rental income
- $21,067
- − Mortgage interest
- −$10,301
- − Property taxes
- −$2,758
- − Insurance
- −$920
- − Repairs & maintenance
- −$1,685
- − Management
- −$1,685
- − HOA
- −$3,000
- − Depreciation
- −$5,350
- Taxable loss
- −$4,633
- Est. tax savings @ 24.0%
- +$1,112
- After-tax cash flow
- $-496/yr
For passive investors: Depreciation is non-cash, so a rental often shows a tax loss while cash-flowing — sheltering income. Rental losses are passive: they offset passive income freely, and up to $25,000/yr can offset ordinary (W-2) income if you actively participate and your MAGI is under $100k (phasing out to $0 by $150k); unused losses carry forward. On sale, claimed depreciation is recaptured at up to 25%, and gains may owe capital-gains tax (a 1031 exchange can defer both). Figures are a year-1 estimate at your 24.0% rate — not tax advice; consult a CPA.
Condition & rehab AI · 12 photos
This well-maintained 2-bedroom, 2-bath condo is move-in ready with good curb appeal and a bright, open floor plan. Minor exterior painting and updating sliding glass doors can further enhance its value.
Value-add opportunities
- Resale Paint exterior siding — Enhances curb appeal and can add value
- Rental Replace sliding glass doors — Improves energy efficiency and safety
- Both Install smart home devices — Enhances convenience and can attract tech-savvy renters
Renovation cost estimate screening
Value-add ROI direction
- Resale Paint exterior siding — Enhances curb appeal and can add value ↑
- Rental Replace sliding glass doors — Improves energy efficiency and safety ↑
- Both Install smart home devices — Enhances convenience and can attract tech-savvy renters ↑
ⓘ Cost ranges are severity-bucket heuristics (US national rule-of-thumb). Get contractor quotes + a written scope before underwriting a rehab budget.
Schools (NCES district)
- District
- Champaign CUSD 4
- NCES district ID
- 1709420
- Math proficiency
- 24% ▼ -7.00%
- Reading proficiency
- 26% ▼ -7.00%
- Median HH income
- $45,797
- Composite
- 21.66/100
- National rank
- #8281
- State rank
- #333 of 620 in IL
Livability — Champaign
- Score
- 83/100
- State rank
- #44
- US rank
- #902
Category grades
Schools grade is shown separately in the Schools card above.
Census & demographics
- Census place
- Champaign, IL
- County
- Champaign County · 182,148 people
- City population
- 96,852
- Metro
- Champaign-Urbana, IL
- Population (ZIP)
- 28,611
- Household income
- $70,715
- Rent vs Own
- Severe rent burden
- 1023.0
Population outlook (Champaign County) Hauer SSP2
- Today (2025)
- 223,848 people
- By 2030
- 231,416 · +3.4%
- By 2040
- 244,321 · +9.1%
- By 2050
- 256,432 · +14.6%
- By 2075
- 285,823 · +27.7%
- By 2100
- 296,406 · +32.4%
Race, ethnicity, and origin ACS 2023
- Neighborhood character
- Diverse neighborhood (Simpson 0.61)
- Race & ethnicity
- White 57% Black 23% Asian 8% Hispanic / Latino 8% Two or more races 6%
- Hispanic origin (detail)
- Mexican 4% Puerto Rican 2%
- Common ancestry
- Romanian 4% Lithuanian 2% Slovak 2%
- Foreign-born
- 14% · Canada, China, South Korea
- Languages at home
- 82% English-only · Spanish 5% French/Haitian/Cajun 5% Tagalog/Filipino 2%
Political lean MEDSL · Champaign
- 2024 margin
- Strong D (+24.1) · D 61.3% · R 37.2% · Other 1.5%
- 2008→2024 swing
- +6.6pp toward D · 2008: 17.5pp · 2024: 24.1pp
- All cycles
- 2024: D+24.1 2020: D+22.8 2016: D+18.4 2012: D+6.8 2008: D+17.5
Not yet ingested
- Civics
- —
Market trends
- HPI YoY
- ▼ -78.19%
- Current HPI
- 221.1245
- Rent YoY
- ▲ 9.29%
- Metro
- Champaign-Urbana, IL
- State GDP YoY
- ▲ 1.59%
- F500 in state
- 60
Industry mix (Fortune 500 HQ in IL)
| Industry | F500 HQs | Revenue |
|---|---|---|
| Insurance | 4 | $201B |
|
||
| Consumer Goods | 4 | $87B |
|
||
| Industrial Machinery | 3 | $64B |
|
||
| Healthcare | 2 | $55B |
|
||
| Retail / Pharmacy | 1 | $148B |
|
||
| Agriculture / Food | 1 | $86B |
|
||
Price history
-2.1% since first listed2 events — show timeline
- 2026-04-28 Price Changed $189,900 MRED as Distributed by MLS Grid
- 2026-04-08 Price Changed $194,000 MRED as Distributed by MLS Grid
Cash-flow waterfall
monthlySold comps — $/sqft
last 12 mo · ≤1 miLoading sold comps…