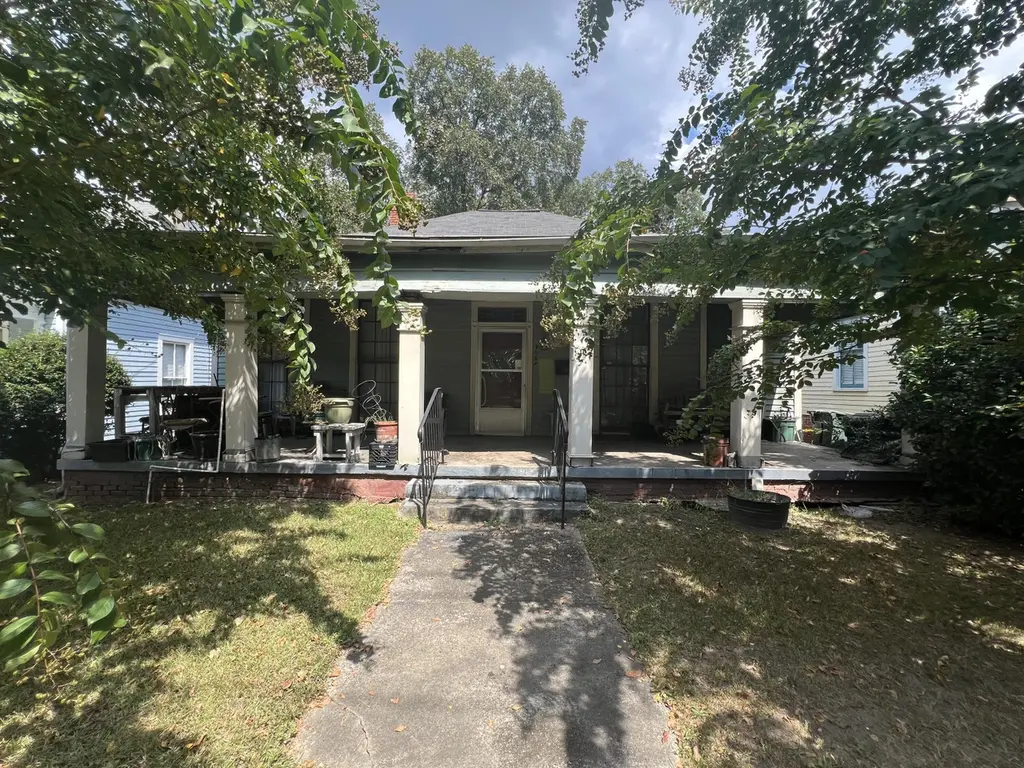
1661 Lawton Ave Ave · Macon-Bibb County, GA
Flood risk 1/10 · Minimal
- FEMA flood zone
- X (unshaded)
- Chance of flooding over 30 yrs
- 0.0%
- Est. flood insurance / yr
- $507 – $1,088
Fire risk 1/10 · Minimal
- Est. fire insurance / yr
- $963 – $1,789
Heat risk 7/10 · Major
- Hot days now (above 108°F)
- 7 days/yr
- Hot days in 30 yrs
- 17 days/yr
Wind risk 6/10 · Moderate
- Chance of severe wind over 30 yrs
- 65.0%
Air-quality risk 4/10 · Minor
- Unhealthy air days now
- 5 days/yr
- Unhealthy air days in 30 yrs
- 5 days/yr
Risk factors via First Street. Map © Google.
Why this score? — see what drove the B- grade
The composite is a weighted blend of 9 inputs, each scored 0–100. Each bar is that input's sub-score; the figure is the points it added to the 100-point composite (weight × sub-score).
- Cash flow +26.1/30.0
- ARV discount +15.0/15.0
- DSCR +8.8/10.0
- 1% rule +6.6/10.0
- Rent growth +3.3/5.0
- Livability +2.5/5.0
- Condition / age +2.5/5.0
- Schools +1.2/10.0
- Appreciation +0.0/10.0
$120,000
🖨 Deal sheet (PDF) 📄 Offer letter ✓ Due diligence
Listing remarks
Opportunity awaits in the 3 bedroom, 2 bath home located in one of Macon's charming historic districts. With plenty of character and endless potential, this property is ready for your vision and updates. Spacious layout offers great bones for renovation rental. Conveniently located near downtown, Mercer University, shopping, and restaurants. Investors!!! Sold as is.
Key facts
- 6,098 sq ft lot
- Built 1940
Neighborhood map
What this means for you Summary
Snapshot
- This is a 3-bed/2.0-bath single-family listed at $120k.
Deal economics
- At list price, monthly cash flow is $303 ($4k/yr) — positive.
- The deal already cash-flows at list — no discount required.
- Meets the 1% rule at list price ($1k rent vs $120k).
- Cap rate 9.3% vs local median 5.4% in Macon-Bibb County — top-decile yield for the area; either an underpriced asset or a hidden risk that comps aren't pricing in. Stress-test before assuming the spread holds.
Location & tenants
- Location reads: area grade B — affects rentability + tenant quality, not the cash-flow math above.
- Bibb County (urban): math 11% / reading 18% proficiency, ranked #161 of 174 in GA (top 92%) — low school quality limits family demand, transient renter base, plan for 1-2y turnover; 75% free/reduced lunch — lower-income household profile, screen leases tightly.
- Market conditions: Rents rising (+3.1%/yr); 74 active listings in the ZIP; 31 comparable units currently listed for rent nearby; rentals at typical pace (median 22d on market — plan ~3-4 weeks tenant-placement turnaround); 45% of comp listings sitting > 30 days — soft ceiling on asking rent; lower-income renter base — watch delinquency; 154 units permitted in Bibb County in 2024 (0 in 5+ unit buildings).
- At $1,392/mo this rent would consume 57% of the median local household income ($29k/yr) (locally 1124% of renters already pay >50% of income on rent) — very limited rent-growth headroom before tenants either downsize or default.
Forward outlook
- Local home prices are declining (-3.0%/yr); year-one equity from $830 of loan paydown is wiped out by about $4k of value loss. Plan a longer hold.
- Bibb County population projected at -12% by 2050 — secular population decline; favor cash flow + early exit over multi-decade hold.
- At projected returns (-3.0% appreciation + 3.1% rent growth), your $34k cash investment doubles in ~10 years — after that, you're playing with house money.
Negotiation context
- Only 0 days on market — expect competitive offers; lowballing is unlikely to land.
- 2 sale attempts with the ask held roughly flat each time — persistent listings suggest the price (not the market) is what's stuck; bring a comps-based counter.
Risks & watch-outs
- Watch-outs: built in 1940 — expect roof / HVAC / electrical / plumbing capex.
- Climate carrying-cost: major wind risk, 65% chance of damaging wind over 30y; extreme-heat days projected 7→17/yr by 2055 (HVAC capex compounding) — expect insurance premiums to compound above CPI over the hold.
Questions for the listing agent
- Built in 1940 — when were the roof, HVAC, electrical panel, plumbing, and water heater last replaced?
- Is there a deadline driving the sale (1031 exchange, divorce, estate, relocation)? That informs how much negotiation room exists.
- What's the average days-on-market for RENTAL listings here right now (not sales)? A rising rental-DOM trend means longer vacancies and softer asking-rent achievability than the comps imply.
- What's the recent tenant-quality profile in this submarket — average credit score on applications, eviction rate, late-payment / NSF rate, and stable-employment percentage? A property-management company in the area should have these aggregated.
- How much new for-sale + rental construction is in the pipeline within 1–3 miles? Heavy new supply typically softens prices + rents 12–24 months out; constrained supply supports both.
Investment metrics
- 1% rule
- 1.16% ✓
- Cap rate
- 9.33%
- Cash-on-cash
- 10.83%
- DSCR
- 1.48
- GRM
- 7.2
CMA / ARV
- ARV (on-the-fly)
- $164,900
- Comps found
- 12
Show comp detail 12 sales within ~0.75 mi
| Address | Dist | Beds/Ba | Sqft | Sold | Price | $/sf | Match |
|---|---|---|---|---|---|---|---|
| 1159 Huguenin Ave | 0.25mi | 4/2.0 (+1) | 2,020 (+4%) | 7mo | $45,000 | $22 | 71 |
| 1081 Ash St | 0.44mi | 3/2.5 | 1,850 (-5%) | 1mo | $319,200 | $173 | 69 |
| 2334 Napier Ave | 0.51mi | 3/1.5 | 1,900 (-2%) | 3mo | $47,500 | $25 | 68 |
| 1987 Dannenberg Ave | 0.29mi | 2/2.0 (-1) | 2,030 (+5%) | 10mo | $16,600 | $8 | 66 |
| 1184 Holt Ave | 0.31mi | 2/2.0 (-1) | 1,832 (-6%) | 11mo | $30,000 | $16 | 62 |
| 1355 Calhoun St | 0.53mi | 3/2.5 | 1,841 (-5%) | 11mo | $250,000 | $136 | 55 |
| 853 Tattnall St | 0.31mi | 4/3.0 (+1) | 1,660 (-14%) | 1mo | $280,000 | $169 | 52 |
| 239 Clisby Pl | 0.60mi | 2/2.0 (-1) | 1,866 (-4%) | 11mo | $159,900 | $86 | 51 |
| 1339 Blackmon Ave | 0.43mi | 3/2.0 | 1,677 (-14%) | 9mo | $24,500 | $15 | 50 |
| 941 Park Pl | 0.55mi | 2/2.0 (-1) | 2,142 (+10%) | 8mo | $300,000 | $140 | 45 |
| 2435 Napier Ave | 0.60mi | 2/2.0 (-1) | 1,730 (-11%) | 6mo | $126,000 | $73 | 44 |
| 248 Clisby Pl | 0.57mi | 3/2.0 | 1,698 (-12%) | 11mo | $145,000 | $85 | 43 |
Match score weights: distance 35% · size 25% · config 20% · recency 20%. Top-matched comps best support the ARV.
Projected returns pro-forma
-3.0% appreciation · 3.11% rent growth · sell at horizon
- IRR
- 0.0%
- Equity multiple
- 1.00×
- Total profit
- $23
- Equity at exit
- $17,892
- IRR
- 9.8%
- Equity multiple
- 1.76×
- Total profit
- $25,527
- Equity at exit
- $10,375
Cash invested: $33,600 (down + closing). Projections, not guarantees.
Landlord ↔ Tenant lean methodology
- Overall (STATE)
- 90 Strongly Landlord-Friendly
- State Georgia
- 90 Strongly Landlord-Friendly · R+3
- County
- — inherits STATE
- City
- — inherits STATE
ZIP-level market 31201
- Rents YoY
- 3.1%
- Active inventory
- 74
- Price-to-rent
- 7.2×
Monthly cashflow live
- Estimated rent
- $1,392 high interval (Pro) →
- Mortgage (P&I)
- −$629
- Tax from tax record
- −$117 /mo · $1,404/yr
- Insurance
- −$50
- HOA
- −$0
- Vacancy / Maint / Mgmt
- −$292
- Net cashflow
- $303
Break-even live
Sensitivity live
| Price | -10% $371 | -5% $337 | +0% $303 | +5% $269 | +10% $235 |
|---|---|---|---|---|---|
| Rent | -10% $193 | -5% $248 | +0% $303 | +5% $358 | +10% $413 |
| Rate | -1.0pp $364 | -0.5pp $334 | base $303 | +0.5pp $272 | +1.0pp $241 |
UW: 25.0% down · 7.5% · 30yr · 1.5% tax · 5.0% vac · 8.0% maint · 8.0% mgmt
Financing live
Cash to close
- Down payment
- $30,000
- Closing costs
- $3,600
- Reserves months
- —
- Total cash needed
- —
Loan-product check · same deal, 3 products live
Conventional
25% down · 7.5% · 30yr
- Down + closing
- —
- Monthly P&I
- —
- Monthly cashflow
- —
- DSCR
- —
- Eligible?
- —
Personal DTI + credit; lowest rate.
DSCR
20% down · 8.5% · 30yr
- Down + closing
- —
- Monthly P&I
- —
- Monthly cashflow
- —
- DSCR
- —
- Eligible?
- —
No personal income docs; deal must DSCR.
Hard money
10% down · 12.0% · 12mo
- Down + closing
- —
- Monthly P&I
- —
- Monthly cashflow
- —
- DSCR
- —
- Eligible?
- —
Short-term bridge; refi at stabilization.
Rent comps 31 comps
| Address | Beds | Baths | Sqft | Rent | $/sqft | DOM | Units | Dist |
|---|---|---|---|---|---|---|---|---|
| 1268 College St Unit 1 Macon, GA | 2.0 | 2.0 | 1500 | $1,730 | $1.15 | 44d | 1 | 0.32mi |
| 2154 Napier Ave Macon, GA | 3.0 | 1.0 | 1344 | $1,400 | $1.04 | 22d | 1 | 0.33mi |
| 1232 Shamrock St Macon, GA | 3.0 | 2.0 | 1282 | $1,700 | $1.33 | 14d | 1 | 0.40mi |
| 1371 Ross St Macon, GA | 3.0 | 2.0 | 1541 | $1,200 | $0.78 | 14d | 1 | 0.45mi |
| 1347 Jackson St Macon, GA | 3.0 | 2.0 | 1435 | $1,300 | $0.91 | 44d | 1 | 0.64mi |
| 2585 Napier Ave Unit A Macon, GA | 2.0 | 2.0 | 2007 | $950 | $0.47 | 44d | 1 | 0.72mi |
| 391 Madison St Macon, GA | 3.0 | 2.0 | 1236 | $1,350 | $1.09 | 14d | 1 | 0.74mi |
| 722 Ash St Macon, GA | 2.0 | 2.0 | 1700 | $3,700 | $2.18 | 44d | 1 | 0.83mi |
| 2259 Robin Lyn Ct Unit 31204 Macon, GA | 2.0 | 2.5 | 1560 | $1,295 | $0.83 | 44d | 1 | 0.87mi |
| 2259 Robin Lyn Ct Macon, GA | 2.0 | 3.0 | 1560 | $1,295 | $0.83 | 44d | 1 | 0.87mi |
| 738 Liberty St Unit 738 Macon, GA | 2.0 | 1.0 | 1378 | $989 | $0.72 | 22d | 1 | 0.87mi |
| 738 Liberty St Unit 730 Macon, GA | 2.0 | 1.0 | 1376 | $680 | $0.49 | 22d | 1 | 0.87mi |
| 2261 Robin Lyn Ct Macon, GA | 2.0 | 3.0 | 1560 | $1,295 | $0.83 | 44d | 1 | 0.87mi |
| 2261 Robin Lyn Ct Unit 31204 Macon, GA | 2.0 | 2.5 | 1560 | $1,295 | $0.83 | 44d | 1 | 0.87mi |
| 2269 Robin Lyn Ct Unit 31204 Macon, GA | 3.0 | 2.5 | 1560 | $1,375 | $0.88 | 22d | 1 | 0.88mi |
| 2269 Robin Lyn Ct Macon, GA | 3.0 | 3.0 | 1560 | $1,375 | $0.88 | 22d | 1 | 0.88mi |
| 2663 Hillcrest Ave Macon, GA | 3.0 | 2.0 | 1931 | $1,395 | $0.72 | 22d | 1 | 0.88mi |
| 2697 Napier Ave Macon, GA | 4.0 | 1.0 | 1550 | $895 | $0.58 | 22d | 1 | 0.90mi |
| 2694 Cherokee Ave Unit A Macon, GA | 3.0 | 1.5 | 1985 | $1,250 | $0.63 | 44d | 1 | 0.91mi |
| 1025 Hillyer Ave Macon, GA | 3.0 | 2.0 | 1738 | $1,800 | $1.04 | 22d | 1 | 0.93mi |
| 1025 Hillyer Ave Macon, GA | 4.0 | 2.0 | 1738 | $1,800 | $1.04 | 44d | 1 | 0.93mi |
| 1336 Winton Ave Macon, GA | 3.0 | 2.0 | 1632 | $1,350 | $0.83 | 44d | 1 | 0.99mi |
| 2794 Napier Ave Macon, GA | 3.0 | 2.0 | 1672 | $1,175 | $0.70 | 44d | 1 | 1.07mi |
| 484 1st St #300 Macon, GA | 2.0 | 1.0 | 1400 | $1,625 | $1.16 | 14d | 1 | 1.11mi |
| 147 Orange St Macon, GA | 3.0 | 2.0 | 1500 | $1,695 | $1.13 | 14d | 1 | 1.11mi |
| 919 Inverness Ave Macon, GA | 3.0 | 2.0 | 1676 | $1,549 | $0.92 | 22d | 1 | 1.14mi |
| 328 Rogers Ave Macon, GA | 3.0 | 2.0 | 1355 | $1,200 | $0.89 | 44d | 1 | 1.21mi |
| 476 3rd St Macon, GA | 2.0 | 1.0 | 942 | $1,850 | $1.96 | 14d | 8 | 1.29mi |
| 462 Cherry St Macon, GA | 2.0 | 1.0–2.0 | 988 | $3,000 | $3.03 | 14d | 25 | 1.34mi |
| 425 Rogers Ave Macon, GA | 3.0 | 2.0 | 1646 | $1,375 | $0.84 | 14d | 1 | 1.36mi |
| 370 Cherry St Macon, GA | 2.0 | 2.0 | 1500 | $1,400 | $0.93 | 44d | 1 | 1.42mi |
Listing history 5 events
-
2025-10-24historical
-
2025-10-23historical
-
2025-10-23historical
-
2025-09-28$120,000
-
2025-09-28$120,000
ⓘ Source: listings_history table (triggers on properties + properties_extension) + one-shot
backfill from property_details.listing_events for pre-trigger history.
Tax reassessment forecast GA · Resets to sale price
- Current annual tax
- $1,404 · $117/mo
- Projected year-2 tax
- $1,404 · $117/mo
- Expected delta
- $0/yr ($0/mo · 0.0%)
ⓘ Screening estimate from a state-policy table — verify with the county assessor before closing.
Climate risk First Street
- Flood 1/10 Low FEMA zone X (unshaded) · 0% chance over 30 yrs
- Wildfire 1/10 Low
- Heat 7/10 Severe 7 d/yr ≥108°F today · 17 d/yr by 30 yrs out
- Wind 6/10 Major 65% chance of damaging wind over 30 yrs
- Air quality 4/10 Moderate 5 unhealthy d/yr today · 5 by 30 yrs out
Nearby sold comps map
Loading sold comps map…
Walkable amenities ~0.75 mi
Loading nearby amenities…
Taxation est. · year 1
- Rental income
- $16,702
- − Mortgage interest
- −$6,722
- − Property taxes
- −$1,404
- − Insurance
- −$600
- − Repairs & maintenance
- −$1,336
- − Management
- −$1,336
- − Depreciation
- −$3,491
- Taxable income
- $1,813
- Est. tax owed @ 24.0%
- −$435
- After-tax cash flow
- $3,204/yr
For passive investors: Depreciation is non-cash, so a rental often shows a tax loss while cash-flowing — sheltering income. Rental losses are passive: they offset passive income freely, and up to $25,000/yr can offset ordinary (W-2) income if you actively participate and your MAGI is under $100k (phasing out to $0 by $150k); unused losses carry forward. On sale, claimed depreciation is recaptured at up to 25%, and gains may owe capital-gains tax (a 1031 exchange can defer both). Figures are a year-1 estimate at your 24.0% rate — not tax advice; consult a CPA.
Schools (NCES district)
- District
- Bibb County
- NCES district ID
- 1300420
- Math proficiency
- 11% ▼ -14.00%
- Reading proficiency
- 18% ▼ -11.00%
- Median HH income
- $37,426
- Composite
- 12.13/100
- National rank
- #9654
- State rank
- #161 of 174 in GA
Livability — Macon-Bibb County
No livability data for this city. (Only ~50 U.S. cities are tracked.)
Census & demographics
- Census place
- Macon-Bibb County, GA
- County
- Bibb County · 164,332 people
- City population
- 143,186
- Metro
- Macon-Bibb County, GA
- Population (ZIP)
- 7,891
- Household income
- $29,420
- Rent vs Own
- Severe rent burden
- 1124.0
Population outlook (Bibb County) Hauer SSP2
- Today (2025)
- 148,772 people
- By 2030
- 145,904 · -1.9%
- By 2040
- 139,404 · -6.3%
- By 2050
- 131,603 · -11.5%
- By 2075
- 111,050 · -25.4%
- By 2100
- 83,346 · -44.0%
Race, ethnicity, and origin ACS 2023
- Neighborhood character
- Diverse neighborhood (Simpson 0.55)
- Race & ethnicity
- Black 59% White 31% Hispanic / Latino 6% Two or more races 5% Asian 2%
- Hispanic origin (detail)
- Mexican 3% Puerto Rican 1%
- Common ancestry
- Slovak 2% Italian 1% Lithuanian 1%
- Foreign-born
- 4% · Canada
- Languages at home
- 92% English-only · Spanish 5% Other Indo-European 2% Chinese 1%
Political lean MEDSL · Bibb
- 2024 margin
- Strong D (+22.4) · D 61.0% · R 38.5%
- 2008→2024 swing
- +4.4pp toward D · 2008: 18.0pp · 2024: 22.4pp
- All cycles
- 2024: D+22.4 2020: D+23.8 2016: D+20.2 2012: D+20.0 2008: D+18.0
Not yet ingested
- Civics
- —
Market trends
- HPI YoY
- ▼ -142.32%
- Current HPI
- 100.04
- Rent YoY
- ▲ 3.11%
- Metro
- Macon-Bibb County, GA
- State GDP YoY
- ▲ 2.66%
- F500 in state
- 28
Industry mix (Fortune 500 HQ in GA)
| Industry | F500 HQs | Revenue |
|---|---|---|
| Paper / Packaging | 2 | $29B |
|
||
| Retail | 1 | $160B |
|
||
| Transportation / Logistics | 1 | $91B |
|
||
| Airlines | 1 | $62B |
|
||
| Consumer Goods | 1 | $47B |
|
||
| Utilities | 1 | $25B |
|
||
Price history
+0.0% since first listed5 events — show timeline
- 2025-10-24 Listing Removed — Hive MLS
- 2025-10-23 Listing Removed — Hive MLS
- 2025-10-23 Listing Removed — Hive MLS
- 2025-09-28 Listed $120,000 Hive MLS
- 2025-09-28 Listed $120,000 Hive MLS
Property tax history
+5.3%/yrLatest (2025): $1,404 · -1.4% YoY. Source: county tax records.
Cash-flow waterfall
monthlySold comps — $/sqft
last 12 mo · ≤1 miLoading sold comps…