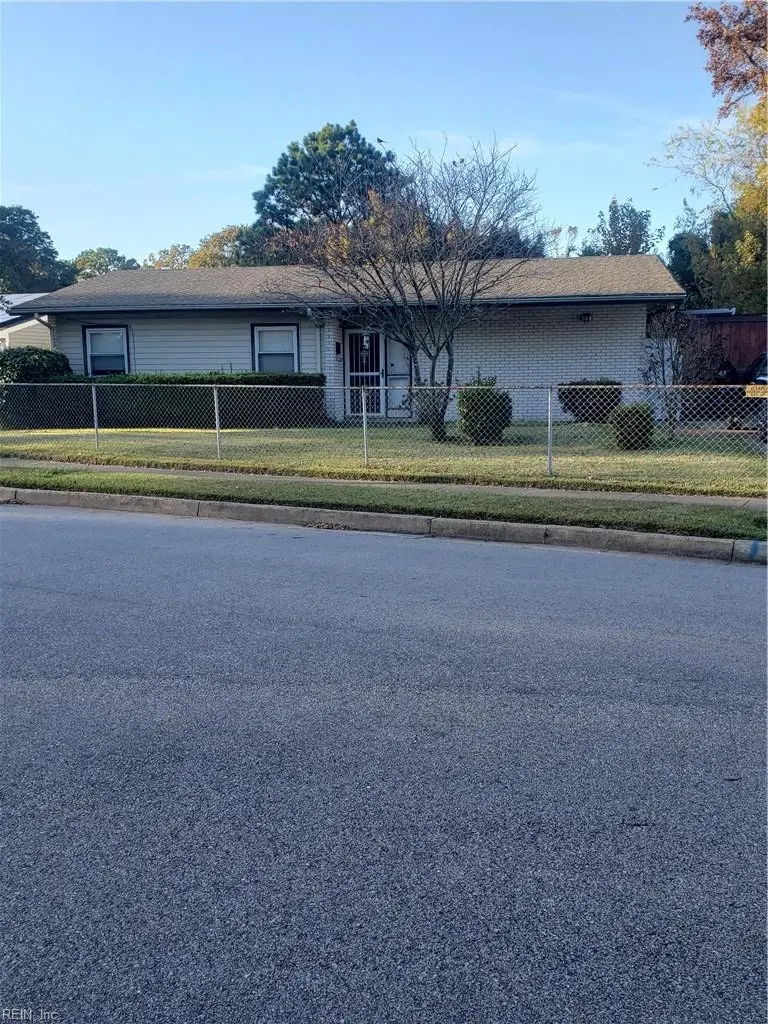
1316 Oakmont Pl · Norfolk, VA
Flood risk 3/10 · Minor
- FEMA flood zone
- X (unshaded)
- Chance of flooding over 30 yrs
- 0.2%
- Est. flood insurance / yr
- $507 – $1,088
Fire risk 1/10 · Minimal
- Est. fire insurance / yr
- $666 – $1,236
Heat risk 9/10 · Severe
- Hot days now (above 104°F)
- 7 days/yr
- Hot days in 30 yrs
- 16 days/yr
Wind risk 8/10 · Major
- Chance of severe wind over 30 yrs
- 80.0%
Air-quality risk 3/10 · Minor
- Unhealthy air days now
- 2 days/yr
- Unhealthy air days in 30 yrs
- 3 days/yr
Risk factors via First Street. Map © Google.
Why this score? — see what drove the D+ grade
The composite is a weighted blend of 9 inputs, each scored 0–100. Each bar is that input's sub-score; the figure is the points it added to the 100-point composite (weight × sub-score).
- ARV discount +15.0/15.0
- Cash flow +13.9/30.0
- DSCR +4.2/10.0
- Livability +4.2/5.0
- Schools +3.5/10.0
- 1% rule +3.4/10.0
- Rent growth +3.4/5.0
- Condition / age +2.5/5.0
- Appreciation +0.0/10.0
$265,000
🖨 Deal sheet (PDF) 📄 Offer letter ✓ Due diligence
Listing remarks
Excellent opportunity to own this 4-bedroom, 2-bathroom ranch-style home featuring a bright and airy living room with lots of windows, open dining room, updated kitchen, SS appliances, a cozy primary bedroom with bath. HVAC 2023, water heater NOV 2025, new bedroom carpet Oct 2025, Luxury Vinyl approx 2 years old. Go out on to a large patio and lovely private backyard, great for summer entertaining. Washer and dryer included (all appliances convey as is) Conveniently located near shopping, highway access, airport, bases, beaches and restaurants.
Key facts
- Private backyard
- Large patio
- Ss appliances
Tags
Property features AI
Finance
- HOA & community: No HOA fees
Exterior
- Parking: Driveway parking; Street parking
- Utilities: City/County water; City/County sewer; Electric water heater; Electric power
- Home design: Detached ranch; Single-story (1 living level)
- Construction: Brick and vinyl siding; Asphalt shingle roof; Slab foundation
- Exterior features: Located on a cul-de-sac; Patio; Back and front fenced yard (chain link); Storage shed
Interior
- Kitchen: Dishwasher; Disposal; Microwave; Electric range; Refrigerator
- Bedrooms: First-floor master bedroom with ensuite; Additional bedroom(s)
- Flooring: Carpet; Ceramic; Laminate; Vinyl
- Bathrooms: 2 full bathrooms
- Heating & cooling: Heat pump (heating and cooling)
- Interior features: Cathedral ceiling; Window treatments; Ceiling fan
- Laundry & utility: Washer; Dryer; Utility room
Neighborhood map
What this means for you Summary
Snapshot
- This is a 4-bed/2.0-bath single-family listed at $265k.
Deal economics
- At list price, monthly cash flow is $28 ($340/yr) — positive.
- The deal already cash-flows at list — no discount required.
- To meet the 1% rule (rent ≥ 1% of price), the offer needs to be $222k (16.4% below list).
- Recommended offer: $222k (16.4% below list) — sets the bar for 1% rule.
- Cap rate 6.4% vs local median 4.0% in Norfolk — top-decile yield for the area; either an underpriced asset or a hidden risk that comps aren't pricing in. Stress-test before assuming the spread holds.
Location & tenants
- Location reads 83/100 on livability (#43 in VA, #1,026 nationally) — a professional / high-income tenant draw. Strengths: amenities A+, commute A+, health & safety A+; Watch: employment C-, crime F.
- Norfolk City Public School District (urban): math 27% / reading 56% proficiency, ranked #118 of 131 in VA (top 90%) — families likely to look elsewhere, expect single-tenant / working-renter base with shorter leases.
- Zoned schools: Larrymore Elementary (math 42% / reading 57%, grade D, #742 of 1,108 statewide, top 70%, 592 students, 96% FRL); Norview Middle (math 19% / reading 54%, grade F, #320 of 342 statewide, top 95%, 1,259 students, 89% FRL); Norview High (math 33% / reading 85%, grade C+, #256 of 319 statewide, top 81%, 1,915 students, 97% FRL) — zoned schools average 94% FRL vs 59% district-wide (35 pts higher); higher-poverty schools than district average — tighter screening recommended.
- Market conditions: Rents rising (+3.4%/yr); 135 active listings in the ZIP; 22 comparable units currently listed for rent nearby; rentals at typical pace (median 23d on market — plan ~3-4 weeks tenant-placement turnaround); 438 units permitted in Norfolk city in 2024 (273 in 5+ unit buildings).
- This rent runs 39% of the median local income ($68k/yr) — at the standard rent-burdened threshold; future hikes will face affordability resistance.
Forward outlook
- Local home prices are declining (-3.0%/yr); year-one equity from $2k of loan paydown is wiped out by about $8k of value loss. Plan a longer hold.
Negotiation context
- Only 4 days on market — expect competitive offers; lowballing is unlikely to land.
- Current owner paid $155k; list at $265k implies a 71% gain — meaningful room to come down on a strong offer.
Risks & watch-outs
- Climate carrying-cost: severe wind risk, 80% chance of damaging wind over 30y; extreme-heat days projected 7→16/yr by 2055 (HVAC capex compounding) — expect insurance premiums to compound above CPI over the hold.
Questions for the listing agent
- Built in 1967 — when were the roof, HVAC, electrical panel, plumbing, and water heater last replaced?
- Is there a deadline driving the sale (1031 exchange, divorce, estate, relocation)? That informs how much negotiation room exists.
- Schools are A-rated — typically a magnet for longer-tenancy family renters. What's the average tenant stay here, and is there a school-zone premium baked into asking?
- Crime grade is F in this area — have there been break-ins, vandalism, or insurance claims at this property in the last 3 years? What carrier currently insures it and at what premium?
- The area grade is low — what's the realistic commute time and amenity access for the typical tenant pool here? Any planned neighborhood developments (good or bad) we should know about?
- What's the average days-on-market for RENTAL listings here right now (not sales)? A rising rental-DOM trend means longer vacancies and softer asking-rent achievability than the comps imply.
- What's the recent tenant-quality profile in this submarket — average credit score on applications, eviction rate, late-payment / NSF rate, and stable-employment percentage? A property-management company in the area should have these aggregated.
- How much new for-sale + rental construction is in the pipeline within 1–3 miles? Heavy new supply typically softens prices + rents 12–24 months out; constrained supply supports both.
Investment metrics
- 1% rule
- 0.84% ✗
- Cap rate
- 6.42%
- Cash-on-cash
- 0.46%
- DSCR
- 1.02
- GRM
- 10.0
CMA / ARV
- ARV (on-the-fly)
- $328,724
- Comps found
- 12
Show comp detail 12 sales within ~0.75 mi
| Address | Dist | Beds/Ba | Sqft | Sold | Price | $/sf | Match |
|---|---|---|---|---|---|---|---|
| 7463 Oakmont Dr | 0.06mi | 3/2.5 (-1) | 1,252 (-8%) | 5mo | $150,000 | $120 | 73 |
| 8060 Chesapeake Blvd | 0.52mi | 4/2.0 | 1,500 (+10%) | 3mo | $305,000 | $203 | 57 |
| 6841 Cedarwood Ct | 0.57mi | 3/2.0 (-1) | 1,455 (+7%) | 3mo | $350,000 | $241 | 55 |
| 7945 Merritt St | 0.55mi | 3/1.5 (-1) | 1,290 (-5%) | 7mo | $315,000 | $244 | 52 |
| 1331 Branch Rd | 0.55mi | 4/2.5 | 1,500 (+10%) | 6mo | $369,900 | $247 | 51 |
| 1136 Templar Blvd | 0.57mi | 4/2.0 | 1,548 (+14%) | 5mo | $379,998 | $245 | 47 |
| 1436 Arbor Ave | 0.60mi | 3/2.5 (-1) | 1,532 (+12%) | 1mo | $365,000 | $238 | 44 |
| 840 Brentwood Dr | 0.70mi | 3/2.0 (-1) | 1,200 (-12%) | 0mo | $309,900 | $258 | 42 |
| 1412 Arbor Ave | 0.59mi | 3/2.5 (-1) | 1,566 (+15%) | 0mo | $295,000 | $188 | 41 |
| 1119 Winston St | 0.72mi | 3/1.0 (-1) | 1,252 (-8%) | 5mo | $190,000 | $152 | 40 |
| 8205 Carlton St | 0.60mi | 4/1.0 | 1,559 (+14%) | 6mo | $315,000 | $202 | 39 |
| 1614 Wapiti Ave | 0.65mi | 3/1.0 (-1) | 1,200 (-12%) | 3mo | $330,000 | $275 | 38 |
Match score weights: distance 35% · size 25% · config 20% · recency 20%. Top-matched comps best support the ARV.
Projected returns pro-forma
-3.0% appreciation · 3.42% rent growth · sell at horizon
- IRR
- -15.1%
- Equity multiple
- 0.46×
- Total profit
- $-40,229
- Equity at exit
- $39,512
- IRR
- -5.9%
- Equity multiple
- 0.61×
- Total profit
- $-28,951
- Equity at exit
- $22,912
Cash invested: $74,200 (down + closing). Projections, not guarantees.
Landlord ↔ Tenant lean methodology
- Overall (STATE)
- 55 Moderately Landlord-Leaning
- State Virginia
- 55 Moderately Landlord-Leaning · D+2
- County
- — inherits STATE
- City
- — inherits STATE
ZIP-level market 23513
- Home prices YoY
- -9.3%
- Rents YoY
- 3.4%
- Active inventory
- 135
- Price-to-rent
- 10.0×
Monthly cashflow live
- Estimated rent
- $2,216 high interval (Pro) →
- Mortgage (P&I)
- −$1,390
- Tax from tax record
- −$222 /mo · $2,665/yr
- Insurance
- −$110
- HOA
- −$0
- Vacancy / Maint / Mgmt
- −$465
- Net cashflow
- $28
Break-even live
Sensitivity live
| Price | -10% $178 | -5% $103 | +0% $28 | +5% $-47 | +10% $-122 |
|---|---|---|---|---|---|
| Rent | -10% $-147 | -5% $-59 | +0% $28 | +5% $116 | +10% $203 |
| Rate | -1.0pp $162 | -0.5pp $96 | base $28 | +0.5pp $-40 | +1.0pp $-110 |
UW: 25.0% down · 7.5% · 30yr · 1.5% tax · 5.0% vac · 8.0% maint · 8.0% mgmt
Financing live
Cash to close
- Down payment
- $66,250
- Closing costs
- $7,950
- Reserves months
- —
- Total cash needed
- —
Loan-product check · same deal, 3 products live
Conventional
25% down · 7.5% · 30yr
- Down + closing
- —
- Monthly P&I
- —
- Monthly cashflow
- —
- DSCR
- —
- Eligible?
- —
Personal DTI + credit; lowest rate.
DSCR
20% down · 8.5% · 30yr
- Down + closing
- —
- Monthly P&I
- —
- Monthly cashflow
- —
- DSCR
- —
- Eligible?
- —
No personal income docs; deal must DSCR.
Hard money
10% down · 12.0% · 12mo
- Down + closing
- —
- Monthly P&I
- —
- Monthly cashflow
- —
- DSCR
- —
- Eligible?
- —
Short-term bridge; refi at stabilization.
Rent comps 22 comps
| Address | Beds | Baths | Sqft | Rent | $/sqft | DOM | Units | Dist |
|---|---|---|---|---|---|---|---|---|
| 6975 Bonnot Dr Norfolk, VA | 3.0 | 1.5 | 1188 | $1,700 | $1.43 | 45d | 1 | 0.40mi |
| 845 Burksdale Rd Norfolk, VA | 5.0 | 2.0 | 1680 | $1,895 | $1.13 | 25d | 1 | 0.73mi |
| 7922 Old Ocean View Rd Norfolk, VA | 1.0–3.0 | 1.0–1.5 | 890 | $1,300 | $1.46 | 3d | 3 | 0.79mi |
| 7120 Clarion Ln Norfolk, VA | 4.0 | 2.0 | 1506 | $2,300 | $1.53 | 19d | 1 | 0.81mi |
| 8107 Old Ocean View Rd Norfolk, VA | 4.0 | 1.0 | 1562 | $2,095 | $1.34 | 19d | 1 | 0.83mi |
| 1831 Banning Rd Norfolk, VA | 3.0 | 2.0 | 1853 | $2,500 | $1.35 | 5d | 1 | 0.83mi |
| 837 Tifton St Norfolk, VA | 3.0 | 2.0 | 1072 | $2,300 | $2.15 | 25d | 1 | 0.95mi |
| 7996 Diggs Rd Unit D Norfolk, VA | 3.0 | 2.0 | 950 | $1,375 | $1.45 | 45d | 1 | 0.98mi |
| 6451 Edward St Norfolk, VA | 3.0 | 2.5 | 1400 | $2,000 | $1.43 | 9d | 1 | 0.98mi |
| 6430 Faraday Ct Norfolk, VA | 4.0 | 1.5 | 1319 | $1,995 | $1.51 | 45d | 1 | 1.00mi |
| 1859 Branchwood St Unit 1492775P Norfolk, VA | 3.0 | 2.0 | 1367 | $3,800 | $2.78 | 16d | 1 | 1.00mi |
| 6450 Crescent Way Norfolk, VA | 1.0–3.0 | 1.0–2.0 | 1128 | $2,369 | $2.10 | 4d | 23 | 1.02mi |
| 1214 Frank St Norfolk, VA | 3.0 | 2.0 | 1250 | $2,300 | $1.84 | 14d | 1 | 1.04mi |
| 1622 Bill St Norfolk, VA | 4.0 | 2.0 | 1528 | $2,350 | $1.54 | 4d | 1 | 1.04mi |
| 1346 Tallwood St Norfolk, VA | 3.0 | 2.0 | 1293 | $2,200 | $1.70 | 5d | 1 | 1.09mi |
| 6419 Grimes Ave Norfolk, VA | 3.0 | 2.0 | 1225 | $2,150 | $1.76 | 45d | 1 | 1.22mi |
| 756 Norman Ave Norfolk, VA | 3.0 | 1.0 | 1500 | $1,875 | $1.25 | 23d | 1 | 1.29mi |
| 8455 Radnor Rd Norfolk, VA | 3.0 | 2.0 | 1650 | $2,195 | $1.33 | 25d | 1 | 1.33mi |
| 408 E Little Creek Rd Norfolk, VA | 3.0 | 2.0 | 1224 | $2,200 | $1.80 | 45d | 1 | 1.33mi |
| 1232 Norview Ave Unit NOR1232R-EA Norfolk, VA | 3.0 | 2.0 | 1106 | $1,600 | $1.45 | 45d | 1 | 1.46mi |
| 8212 Mona Ave Norfolk, VA | 4.0 | 2.0 | 1600 | $2,895 | $1.81 | 22d | 1 | 1.47mi |
| 8507 Chapin St Norfolk, VA | 4.0 | 2.0 | 1550 | $2,400 | $1.55 | 45d | 1 | 1.49mi |
Listing history 3 events
-
2026-06-02statusdays on market $265,000 Under Contract 4 DOM
-
2026-06-01days on market $265,000 Active 3 DOM
-
2026-05-31days on market $265,000 Active 2 DOM
ⓘ Source: listings_history table (triggers on properties + properties_extension) + one-shot
backfill from property_details.listing_events for pre-trigger history.
Tax reassessment forecast VA · Resets to sale price
- Current annual tax
- $2,665 · $222/mo
- Projected year-2 tax
- $2,665 · $222/mo
- Expected delta
- $0/yr ($0/mo · 0.0%)
ⓘ Screening estimate from a state-policy table — verify with the county assessor before closing.
Climate risk First Street
- Flood 3/10 Moderate FEMA zone X (unshaded) · 20% chance over 30 yrs
- Wildfire 1/10 Low
- Heat 9/10 Extreme 7 d/yr ≥104°F today · 16 d/yr by 30 yrs out
- Wind 8/10 Severe 80% chance of damaging wind over 30 yrs
- Air quality 3/10 Moderate 2 unhealthy d/yr today · 3 by 30 yrs out
Nearby sold comps map
Loading sold comps map…
Walkable amenities ~0.75 mi
Loading nearby amenities…
Taxation est. · year 1
- Rental income
- $26,591
- − Mortgage interest
- −$14,844
- − Property taxes
- −$2,665
- − Insurance
- −$1,325
- − Repairs & maintenance
- −$2,127
- − Management
- −$2,127
- − Depreciation
- −$7,709
- Taxable loss
- −$4,207
- Est. tax savings @ 24.0%
- +$1,010
- After-tax cash flow
- $1,350/yr
For passive investors: Depreciation is non-cash, so a rental often shows a tax loss while cash-flowing — sheltering income. Rental losses are passive: they offset passive income freely, and up to $25,000/yr can offset ordinary (W-2) income if you actively participate and your MAGI is under $100k (phasing out to $0 by $150k); unused losses carry forward. On sale, claimed depreciation is recaptured at up to 25%, and gains may owe capital-gains tax (a 1031 exchange can defer both). Figures are a year-1 estimate at your 24.0% rate — not tax advice; consult a CPA.
Schools (NCES district)
- District
- Norfolk City Public School District
- NCES district ID
- 5102670
- Math proficiency
- 27% ▼ -44.00%
- Reading proficiency
- 56% ▼ -10.00%
- Median HH income
- $44,358
- Composite
- 35.08/100
- National rank
- #5026
- State rank
- #118 of 131 in VA
Livability — Norfolk
- Score
- 83/100
- State rank
- #43
- US rank
- #1026
Category grades
Schools grade is shown separately in the Schools card above.
Census & demographics
- Census place
- Norfolk, VA
- County
- Norfolk City · 214,042 people
- City population
- 214,042
- Metro
- Virginia Beach-Norfolk-Newport News, VA-NC
- Population (ZIP)
- 28,628
- Household income
- $68,380
- Rent vs Own
- Severe rent burden
- 1342.0
Population outlook (Norfolk County) Hauer SSP2
- Today (2025)
- 249,032 people
- By 2030
- 252,347 · +1.3%
- By 2040
- 253,644 · +1.9%
- By 2050
- 251,913 · +1.2%
- By 2075
- 245,281 · -1.5%
- By 2100
- 219,548 · -11.8%
Race, ethnicity, and origin ACS 2023
- Neighborhood character
- Diverse neighborhood (Simpson 0.63)
- Race & ethnicity
- Black 55% White 23% Hispanic / Latino 11% Two or more races 7% Asian 5%
- Hispanic origin (detail)
- Mexican 4% Puerto Rican 3%
- Common ancestry
- Romanian 1% Slovak 1% Lithuanian 0%
- Foreign-born
- 10% · Canada
- Languages at home
- 87% English-only · Spanish 6% Tagalog/Filipino 4% French/Haitian/Cajun 1%
Political lean MEDSL · Norfolk
- 2024 margin
- Solid D (+41.5) · D 70.0% · R 28.5% · Other 1.6%
- 2008→2024 swing
- -1.4pp toward R · 2008: 43.0pp · 2024: 41.5pp
- All cycles
- 2024: D+41.5 2020: D+45.6 2016: D+42.0 2012: D+44.0 2008: D+43.0
Not yet ingested
- Civics
- —
Market trends
- HPI YoY
- ▼ -33.67%
- Current HPI
- 329.2241
- Rent YoY
- ▲ 3.42%
- Metro
- Virginia Beach-Norfolk-Newport News, VA-NC
- State GDP YoY
- ▲ 2.40%
- F500 in state
- 50
Industry mix (Fortune 500 HQ in VA)
| Industry | F500 HQs | Revenue |
|---|---|---|
| Aerospace / Defense | 4 | $236B |
|
||
| Technology / Defense | 3 | $32B |
|
||
| Financial Services | 2 | $176B |
|
||
| Utilities | 2 | $27B |
|
||
| Insurance | 2 | $25B |
|
||
| Technology | 2 | $15B |
|
||
Price history
+640.2% since first listed3 events — show timeline
- 2026-05-29 Listed $265,000 REINMLS
- 2007-04-25 Sold (Public Records) $155,000 Public Records
- 1978-11-03 Sold (Public Records) $35,800 Public Records
Property tax history
+4.1%/yrLatest (2025): $2,665 · +9.4% YoY. Source: county tax records.
Cash-flow waterfall
monthlySold comps — $/sqft
last 12 mo · ≤1 miLoading sold comps…