1075 Birch Ln · Peaceful Valley, WA
Flood risk 1/10 · Minimal
- FEMA flood zone
- X (unshaded)
- Chance of flooding over 30 yrs
- 0.0%
- Est. flood insurance / yr
- $507 – $1,088
Fire risk 4/10 · Minor
- Est. fire insurance / yr
- $604 – $1,122
Heat risk 2/10 · Minimal
- Hot days now (above 87°F)
- 8 days/yr
- Hot days in 30 yrs
- 18 days/yr
Wind risk 1/10 · Minimal
- Chance of severe wind over 30 yrs
- —
Air-quality risk 7/10 · Major
- Unhealthy air days now
- 12 days/yr
- Unhealthy air days in 30 yrs
- 12 days/yr
Risk factors via First Street. Map © Google.
Why this score? — see what drove the B+ grade
The composite is a weighted blend of 9 inputs, each scored 0–100. Each bar is that input's sub-score; the figure is the points it added to the 100-point composite (weight × sub-score).
- Cash flow +30.0/30.0
- ARV discount +15.0/15.0
- 1% rule +10.0/10.0
- DSCR +10.0/10.0
- Schools +4.2/10.0
- Livability +3.0/5.0
- Rent growth +2.5/5.0
- Condition / age +2.5/5.0
- Appreciation +0.0/10.0
$59,500
🖨 Deal sheet 📄 Offer letter ✓ Due diligence
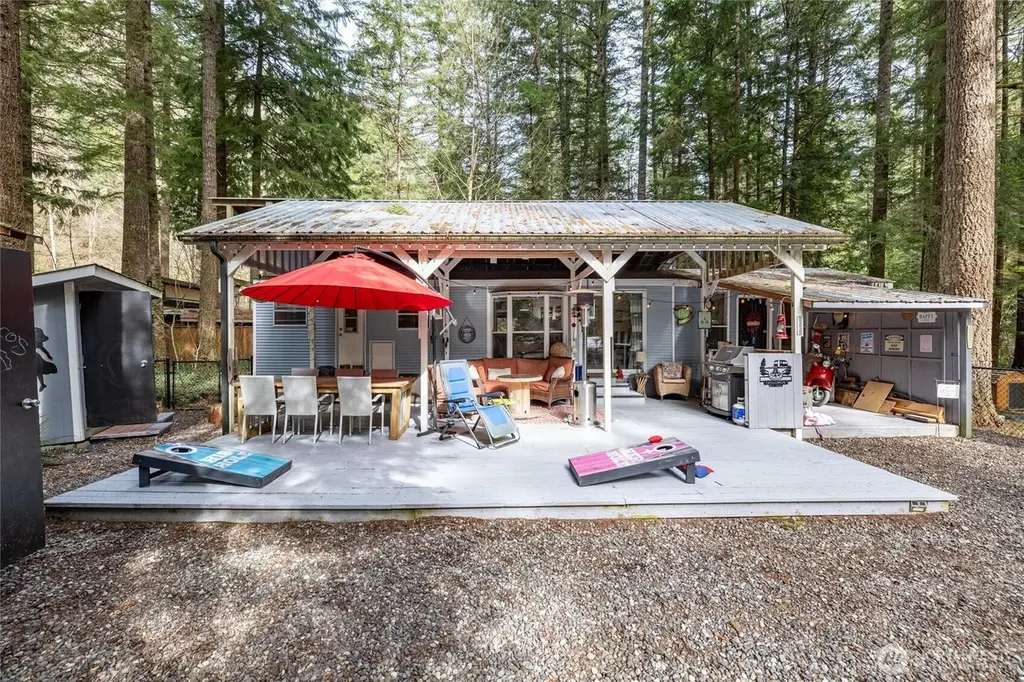
Listing remarks
It’s fun, it’s fully furnished, it’s wonderfully decorated, it’s turn the key and enjoy vacation time! Come one and come all and own this beautiful park model with huge, covered deck! Welcome to Paradise Lakes Country Club. This fun recreational community is just what you have been looking for! The open concept park model boosts all new flooring, side addition, wood burning stove, newer furnace, fridge and stove. This sunny lot is fully fenced, perfect for pets. This property also has 2 sheds and a woodshed with an entire cord of wood that is included in the sale. This community has an indoor pool, sports court, exercise room, comfort stations, playgrounds & mo
Key facts
- Covered deck
- Newer furnace
- Fully fenced
Tags
Neighborhood map
What this means for you Summary
Snapshot
- This is a 2-bed/1.0-bath manufactured listed at $60k.
Deal economics
- At list price, monthly cash flow is $449 ($5k/yr) — positive.
- The deal already cash-flows at list — no discount required.
- Meets the 1% rule at list price ($1k rent vs $60k).
- Recommended offer: $56k (6.0% below list) — sets the bar for market timing.
- Cap rate 15.3% vs local median 4.3% in Peaceful Valley — top-decile yield for the area; either an underpriced asset or a hidden risk that comps aren't pricing in. Stress-test before assuming the spread holds.
Location & tenants
- Location reads 60/100 on livability (#453 in WA) — a middle-class / working-renter tenant base. Strengths: cost of living A, housing A-; Watch: commute C-, health & safety D, schools F.
- Mount Baker School District (rural): math 40% / reading 53% proficiency, ranked #165 of 291 in WA (top 57%) — families likely to look elsewhere, expect single-tenant / working-renter base with shorter leases.
- Market conditions: 39 active listings in the ZIP; 1,190 units permitted in Whatcom County in 2024 (327 in 5+ unit buildings).
Forward outlook
- Local home prices are declining (-3.0%/yr); year-one equity from $411 of loan paydown is wiped out by about $2k of value loss. Plan a longer hold.
- Whatcom County population projected at +28% by 2050 — long-run rental-demand tailwind backs the buy-and-hold thesis.
- At projected returns (-3.0% appreciation + 3.0% rent growth), your $17k cash investment doubles in ~4 years — after that, you're playing with house money.
Negotiation context
- It's been on market 80 days — a 6% lower offer ($56k) is reasonable based on typical stale-listing flexibility.
- 2 sale attempts with the ask held roughly flat each time — persistent listings suggest the price (not the market) is what's stuck; bring a comps-based counter.
Questions for the listing agent
- It's been on market 80 days. Have you received any prior offers? Is the seller open to a 6% concession, seller financing, or rate buy-down credit?
- What does the HOA fee cover, when was the last increase, and are there any pending special assessments or reserve-fund shortfalls?
- Why hasn't it sold? Are there any deal-killer items the seller is aware of (foundation, flood, title, zoning, code violations)?
- Is there a deadline driving the sale (1031 exchange, divorce, estate, relocation)? That informs how much negotiation room exists.
- Schools are F-rated, which usually means shorter tenancies and higher turnover. Who's the typical renter profile here, and what's been the actual vacancy rate?
- What's the average days-on-market for RENTAL listings here right now (not sales)? A rising rental-DOM trend means longer vacancies and softer asking-rent achievability than the comps imply.
- What's the recent tenant-quality profile in this submarket — average credit score on applications, eviction rate, late-payment / NSF rate, and stable-employment percentage? A property-management company in the area should have these aggregated.
- How much new for-sale + rental construction is in the pipeline within 1–3 miles? Heavy new supply typically softens prices + rents 12–24 months out; constrained supply supports both.
Investment metrics
- 1% rule
- 2.10% ✓
- Cap rate
- 15.35%
- Cash-on-cash
- 32.34%
- DSCR
- 2.44
- GRM
- 4.0
CMA / ARV
- ARV (median comp)
- $107,500
- List price
- $59,500
- Delta
- -44.65%
- Verdict
- UNDERPRICED
- Comps
- 6 within 1.0 mi
Show comp detail 5 sales within ~0.75 mi
| Address | Dist | Beds/Ba | Sqft | Sold | Price | $/sf | Match |
|---|---|---|---|---|---|---|---|
| 1131 Alder Ln | 0.15mi | 1/1.0 (-1) | 375 (-2%) | 3mo | $18,000 | $48 | 82 |
| 1031 Exit Rd | 0.16mi | 2/1.0 | 395 (+3%) | 8mo | $40,000 | $101 | 81 |
| 1188 Exit Rd | 0.11mi | 1/1.0 (-1) | 398 (+4%) | 15mo | $55,000 | $138 | 72 |
| 2056 Exit Rd | 0.27mi | 3/1.5 (+1) | 400 (+4%) | 14mo | $15,000 | $38 | 62 |
| 6211 Shamrock Rd | 0.73mi | 1/1.0 (-1) | 365 (-5%) | 15mo | $117,500 | $322 | 40 |
Match score weights: distance 35% · size 25% · config 20% · recency 20%. Top-matched comps best support the ARV.
Projected returns pro-forma
-3.0% appreciation · 3.0% rent growth · sell at horizon
- IRR
- 27.5%
- Equity multiple
- 2.14×
- Total profit
- $19,054
- Equity at exit
- $8,872
- IRR
- 35.1%
- Equity multiple
- 4.23×
- Total profit
- $53,814
- Equity at exit
- $5,144
Cash invested: $16,660 (down + closing). Projections, not guarantees.
Landlord ↔ Tenant lean methodology
- Overall (STATE)
- 28 Tenant-Leaning
- State Washington
- 28 Tenant-Leaning · D+8
- County
- — inherits STATE
- City
- — inherits STATE
ZIP-level market 98295
- Home prices YoY
- -4.8%
- Active inventory
- 39
- Price-to-rent
- 4.0×
Monthly cashflow live
- Estimated rent
- $1,252 medium interval (Pro) →
- Mortgage (P&I)
- −$312
- Tax from tax record
- −$25 /mo · $303/yr
- Insurance
- −$25
- HOA
- −$178
- Vacancy / Maint / Mgmt
- −$263
- Net cashflow
- $449
Break-even live
UW: 25.0% down · 7.5% · 30yr · 1.5% tax · 5.0% vac · 8.0% maint · 8.0% mgmt
Financing live
Cash to close
- Down payment
- $14,875
- Closing costs
- $1,785
- Reserves months
- —
- Total cash needed
- —
Loan-product check · same deal, 3 products live
Conventional
25% down · 7.5% · 30yr
- Down + closing
- —
- Monthly P&I
- —
- Monthly cashflow
- —
- DSCR
- —
- Eligible?
- —
Personal DTI + credit; lowest rate.
DSCR
20% down · 8.5% · 30yr
- Down + closing
- —
- Monthly P&I
- —
- Monthly cashflow
- —
- DSCR
- —
- Eligible?
- —
No personal income docs; deal must DSCR.
Hard money
10% down · 12.0% · 12mo
- Down + closing
- —
- Monthly P&I
- —
- Monthly cashflow
- —
- DSCR
- —
- Eligible?
- —
Short-term bridge; refi at stabilization.
HOA detail
- Monthly dues
- $178 · $2,136/yr
- Likely covers
- landscapingpool
Listing history 18 events
-
2026-06-18days on market $59,500 Active 80 DOM
-
2026-06-17days on market $59,500 Active 79 DOM
-
2026-06-16days on market $59,500 Active 78 DOM
-
2026-06-15days on market $59,500 Active 77 DOM
-
2026-06-14days on market $59,500 Active 75 DOM
-
2026-06-13days on market $59,500 Active 74 DOM
-
2026-06-10days on market $59,500 Active 72 DOM
-
2026-06-09days on market $59,500 Active 71 DOM
-
2026-06-08days on market $59,500 Active 70 DOM
-
2026-06-07days on market $59,500 Active 69 DOM
-
2026-06-05days on market $59,500 Active 66 DOM
-
2026-06-02days on market $59,500 Active 64 DOM
-
2026-06-01days on market $59,500 Active 63 DOM
-
2026-05-31days on market $59,500 Active 62 DOM
-
2026-05-30days on market $59,500 Active 61 DOM
-
2026-04-13status Active
-
2026-04-07status Pending
-
2026-03-24$59,500 Active
ⓘ Source: listings_history table (triggers on properties + properties_extension) + one-shot
backfill from property_details.listing_events for pre-trigger history.
Tax reassessment forecast WA · Resets to sale price
- Current annual tax
- $303 · $25/mo
- Projected year-2 tax
- $583 · $49/mo
- Expected delta
- +$280/yr (+$23/mo · 92.4%)
ⓘ Screening estimate from a state-policy table — verify with the county assessor before closing.
Climate risk First Street
- Flood 1/10 Low FEMA zone X (unshaded) · 0% chance over 30 yrs
- Wildfire 4/10 Moderate
- Heat 2/10 Low 8 d/yr ≥87°F today · 18 d/yr by 30 yrs out
- Wind 1/10 Low
- Air quality 7/10 Severe 12 unhealthy d/yr today · 12 by 30 yrs out
Nearby sold comps map
Loading sold comps map…
Walkable amenities ~0.75 mi
Loading nearby amenities…
Taxation est. · year 1
- Rental income
- $15,024
- − Mortgage interest
- −$3,333
- − Property taxes
- −$303
- − Insurance
- −$298
- − Repairs & maintenance
- −$1,202
- − Management
- −$1,202
- − HOA
- −$2,136
- − Depreciation
- −$1,731
- Taxable income
- $4,820
- Est. tax owed @ 24.0%
- −$1,157
- After-tax cash flow
- $4,231/yr
For passive investors: Depreciation is non-cash, so a rental often shows a tax loss while cash-flowing — sheltering income. Rental losses are passive: they offset passive income freely, and up to $25,000/yr can offset ordinary (W-2) income if you actively participate and your MAGI is under $100k (phasing out to $0 by $150k); unused losses carry forward. On sale, claimed depreciation is recaptured at up to 25%, and gains may owe capital-gains tax (a 1031 exchange can defer both). Figures are a year-1 estimate at your 24.0% rate — not tax advice; consult a CPA.
Schools (NCES district)
- District
- Mount Baker School District
- NCES district ID
- 5305310
- Math proficiency
- 40% ▲ 3.00%
- Reading proficiency
- 53% ▼ -1.00%
- Median HH income
- $53,695
- Composite
- 42.37/100
- National rank
- #6931
- State rank
- #165 of 291 in WA
Livability — Peaceful Valley
- Score
- 60/100
- State rank
- #453
- US rank
- #18635
Category grades
Schools grade is shown separately in the Schools card above.
Census & demographics
- Census place
- Peaceful Valley, WA
- Population (ZIP)
- 3,135
Population outlook (Whatcom County) Hauer SSP2
- Today (2025)
- 240,408 people
- By 2030
- 254,667 · +5.9%
- By 2040
- 281,365 · +17.0%
- By 2050
- 307,592 · +27.9%
- By 2075
- 375,576 · +56.2%
- By 2100
- 421,637 · +75.4%
Race, ethnicity, and origin ACS 2023
- Neighborhood character
- Predominantly White (84%)
- Race & ethnicity
- White 84% Hispanic / Latino 10% Two or more races 6% Native American 2%
- Hispanic origin (detail)
- Mexican 8%
- Common ancestry
- Portuguese 23% Iranian 14% Slovak 2%
- Foreign-born
- 9% · Canada, South Korea
- Languages at home
- 88% English-only · Spanish 5% German/W. Germanic 3% Russian/Polish/Slavic 2%
Political lean MEDSL · Whatcom
- 2024 margin
- Strong D (+24.9) · D 60.8% · R 35.9% · Other 3.3%
- 2008→2024 swing
- +6.9pp toward D · 2008: 18.0pp · 2024: 24.9pp
- All cycles
- 2024: D+24.9 2020: D+23.9 2016: D+17.7 2012: D+12.1 2008: D+18.0
Not yet ingested
- Civics
- —
Market trends
- HPI YoY
- ▼ -17.67%
- Current HPI
- 346.9152
- Rent YoY
- —
- Metro
- —
- State GDP YoY
- ▲ 4.65%
- F500 in state
- 22
Industry mix (Fortune 500 HQ in WA)
| Industry | F500 HQs | Revenue |
|---|---|---|
| Retail | 2 | $269B |
|
||
| Technology / Retail | 1 | $638B |
|
||
| Technology | 1 | $245B |
|
||
| Telecommunications | 1 | $38B |
|
||
| Food / Beverage | 1 | $36B |
|
||
| Automotive / Trucks | 1 | $34B |
|
||
Price history
3 events — show timeline
- 2026-04-13 Relisted — NWMLS as Distributed by MLS Grid
- 2026-04-07 Pending — NWMLS as Distributed by MLS Grid
- 2026-03-24 Listed $59,500 NWMLS as Distributed by MLS Grid
Property tax history
+2.9%/yrLatest (2026): $303 · +13.7% YoY. Source: county tax records.
Cash-flow waterfall
monthlySold comps — $/sqft
last 12 mo · ≤1 miLoading sold comps…