 🏷️ Likely Rental
1405 82nd Ave Lot 52, · West Vero Corridor, FL
Flood risk 1/10 · Minimal
- FEMA flood zone
- X (unshaded)
- Chance of flooding over 30 yrs
- 0.0%
- Est. flood insurance / yr
- $507 – $1,088
Fire risk 4/10 · Minor
- Est. fire insurance / yr
- $947 – $1,759
Heat risk 10/10 · Severe
- Hot days now (above 106°F)
- 7 days/yr
- Hot days in 30 yrs
- 23 days/yr
Wind risk 10/10 · Severe
- Chance of severe wind over 30 yrs
- 99.0%
Air-quality risk 1/10 · Minimal
- Unhealthy air days now
- 0 days/yr
- Unhealthy air days in 30 yrs
- 0 days/yr
Risk factors via First Street. Map © Google.
Why this score? — see what drove the B grade
The composite is a weighted blend of 9 inputs, each scored 0–100. Each bar is that input's sub-score; the figure is the points it added to the 100-point composite (weight × sub-score).
- Cash flow +30.0/30.0
- 1% rule +10.0/10.0
- DSCR +10.0/10.0
- ARV discount +7.5/15.0
- Schools +4.2/10.0
- Condition / age +4.0/5.0
- Livability +3.7/5.0
- Rent growth +2.7/5.0
- Appreciation +0.0/10.0
$65,000
🖨 Deal sheet 📄 Offer letter ✓ Due diligence
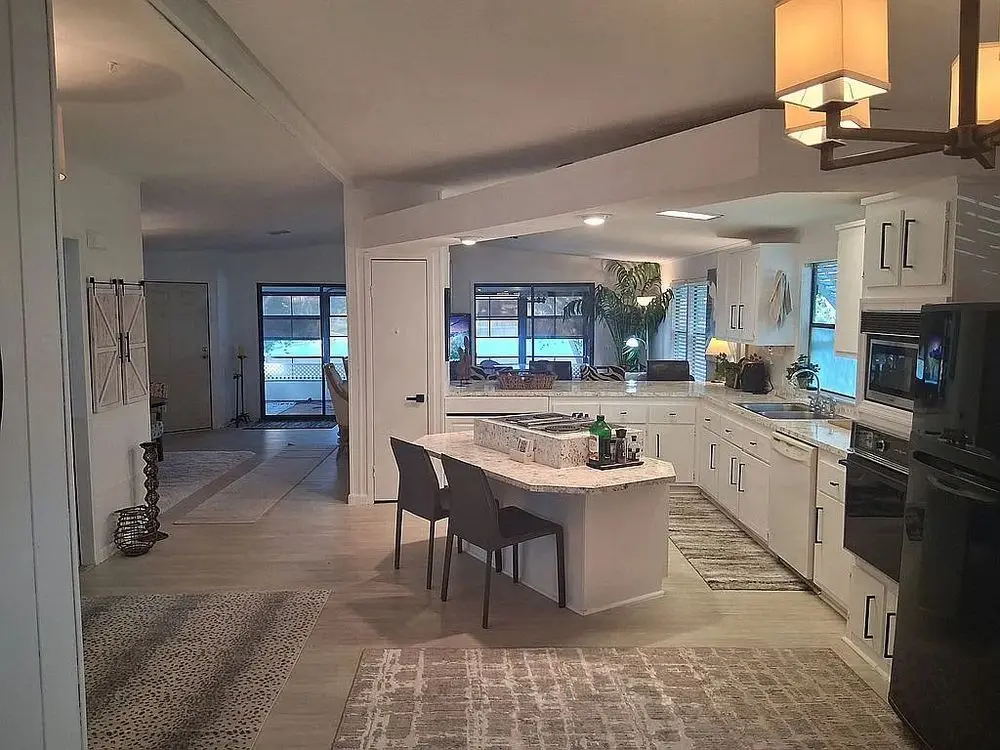
Listing remarks
Waterfront home in a 55 and over park of Veroo Palm Estates. Lot rent is $1,350.00 a month. Land leased property. 2 bed 2 bath 140 sq ft quiet home on the lake. Come furnushed. New Roof, New A/C, upsated insuide throughout. Nice sunroom patio. Must be 55 years old to purchase, 640 credit score and proff of income with a background check. Call for a showing.
Key facts
- Waterfront home
- New a/c
- Sunroom patio
Tags
Neighborhood map
What this means for you Summary
Snapshot
- This is a 2-bed/2.0-bath single-family listed at $65k. Condition is rated good.
Deal economics
- At list price, monthly cash flow is $1k ($12k/yr) — positive.
- The deal already cash-flows at list — no discount required.
- Meets the 1% rule at list price ($2k rent vs $65k).
- Recommended offer: $64k (1.5% below list) — sets the bar for market timing.
- Cap rate 25.5% vs local median 4.0% in West Vero Corridor — top-decile yield for the area; either an underpriced asset or a hidden risk that comps aren't pricing in. Stress-test before assuming the spread holds.
Location & tenants
- Location reads 74/100 on livability (#273 in FL, #4,421 nationally) — a middle-class / working-renter tenant base. Strengths: cost of living A+, housing A+, commute A; Watch: schools F, amenities F, health & safety D-.
- Indian River (other): math 48% / reading 52% proficiency, ranked #35 of 73 in FL (top 48%) — acceptable for families but not a draw, mixed tenant base, ~2y average lease.
- Market conditions: Rents flat; 380 active listings in the ZIP; 13 comparable units currently listed for rent nearby; rentals at typical pace (median 22d on market — plan ~3-4 weeks tenant-placement turnaround); 564 units permitted in Indian River County in 2024 (281 in 5+ unit buildings).
- This rent runs 34% of the median local income ($67k/yr) — at the standard rent-burdened threshold; future hikes will face affordability resistance.
Forward outlook
- Local home prices are declining (-3.0%/yr); year-one equity from $449 of loan paydown is wiped out by about $2k of value loss. Plan a longer hold.
- Indian River County population projected at +18% by 2050 — long-run rental-demand tailwind backs the buy-and-hold thesis.
- At projected returns (-3.0% appreciation + 0.6% rent growth), your $18k cash investment doubles in ~2 years — after that, you're playing with house money.
Negotiation context
- It's been on market 15 days — a 2% lower offer ($64k) is reasonable based on typical stale-listing flexibility.
Risks & watch-outs
- Climate carrying-cost: severe wind risk, 99% chance of damaging wind over 30y; extreme-heat days projected 7→23/yr by 2055 (HVAC capex compounding) — expect insurance premiums to compound above CPI over the hold.
Questions for the listing agent
- Is there a deadline driving the sale (1031 exchange, divorce, estate, relocation)? That informs how much negotiation room exists.
- Schools are F-rated, which usually means shorter tenancies and higher turnover. Who's the typical renter profile here, and what's been the actual vacancy rate?
- What's the average days-on-market for RENTAL listings here right now (not sales)? A rising rental-DOM trend means longer vacancies and softer asking-rent achievability than the comps imply.
- What's the recent tenant-quality profile in this submarket — average credit score on applications, eviction rate, late-payment / NSF rate, and stable-employment percentage? A property-management company in the area should have these aggregated.
- How much new for-sale + rental construction is in the pipeline within 1–3 miles? Heavy new supply typically softens prices + rents 12–24 months out; constrained supply supports both.
Investment metrics
- 1% rule
- 2.90% ✓
- Cap rate
- 25.48%
- Cash-on-cash
- 68.51%
- DSCR
- 4.05
- GRM
- 2.9
CMA / ARV
- ARV (on-the-fly)
- $278,400
- Comps found
- 7
Show comp detail 7 sales within ~0.75 mi
| Address | Dist | Beds/Ba | Sqft | Sold | Price | $/sf | Match |
|---|---|---|---|---|---|---|---|
| 8062 Westfield Cir | 0.35mi | 3/2.0 (+1) | 1,541 (+6%) | 8mo | $340,000 | $221 | 62 |
| 1650 Westfield Ct | 0.46mi | 3/2.0 (+1) | 1,555 (+7%) | 5mo | $440,000 | $283 | 57 |
| 7960 Cabot Tower Pl | 0.65mi | 2/2.0 | 1,545 (+7%) | 6mo | $297,000 | $192 | 54 |
| 7941 Cabot Tower Pl | 0.66mi | 2/2.0 | 1,545 (+7%) | 11mo | $252,000 | $163 | 49 |
| 7942 Brighton Mnr | 0.71mi | 2/2.0 | 1,397 (-4%) | 15mo | $295,000 | $211 | 48 |
| 1862 Easthampton Ter | 0.71mi | 2/2.0 | 1,649 (+14%) | 9mo | $305,000 | $185 | 36 |
| 1872 Easthampton Ter | 0.73mi | 2/2.0 | 1,649 (+14%) | 9mo | $310,000 | $188 | 35 |
Match score weights: distance 35% · size 25% · config 20% · recency 20%. Top-matched comps best support the ARV.
Projected returns pro-forma
-3.0% appreciation · 0.6% rent growth · sell at horizon
- IRR
- 65.2%
- Equity multiple
- 3.81×
- Total profit
- $51,231
- Equity at exit
- $9,692
- IRR
- 68.8%
- Equity multiple
- 7.19×
- Total profit
- $112,567
- Equity at exit
- $5,620
Cash invested: $18,200 (down + closing). Projections, not guarantees.
Landlord ↔ Tenant lean methodology
- Overall (STATE)
- 87 Strongly Landlord-Friendly
- State Florida
- 87 Strongly Landlord-Friendly · R+3
- County
- — inherits STATE
- City
- — inherits STATE
ZIP-level market 32966
- Home prices YoY
- -26.7%
- Rents YoY
- 0.6%
- Active inventory
- 380
- Price-to-rent
- 2.9×
Monthly cashflow live
- Estimated rent
- $1,884 high interval (Pro) →
- Mortgage (P&I)
- −$341
- Tax est. 1.5%
- −$81 /mo · $975/yr
- Insurance
- −$27
- HOA
- −$0
- Vacancy / Maint / Mgmt
- −$396
- Net cashflow
- $1,039
Break-even live
UW: 25.0% down · 7.5% · 30yr · 1.5% tax · 5.0% vac · 8.0% maint · 8.0% mgmt
Financing live
Cash to close
- Down payment
- $16,250
- Closing costs
- $1,950
- Reserves months
- —
- Total cash needed
- —
Loan-product check · same deal, 3 products live
Conventional
25% down · 7.5% · 30yr
- Down + closing
- —
- Monthly P&I
- —
- Monthly cashflow
- —
- DSCR
- —
- Eligible?
- —
Personal DTI + credit; lowest rate.
DSCR
20% down · 8.5% · 30yr
- Down + closing
- —
- Monthly P&I
- —
- Monthly cashflow
- —
- DSCR
- —
- Eligible?
- —
No personal income docs; deal must DSCR.
Hard money
10% down · 12.0% · 12mo
- Down + closing
- —
- Monthly P&I
- —
- Monthly cashflow
- —
- DSCR
- —
- Eligible?
- —
Short-term bridge; refi at stabilization.
Rent comps 13 comps
| Address | Beds | Baths | Sqft | Rent | $/sqft | DOM | Units | Dist |
|---|---|---|---|---|---|---|---|---|
| 8775 20th St #925 Vero Beach, FL | 3.0 | 2.0 | 1356 | $1,799 | $1.33 | 21d | 1 | 0.36mi |
| 8775 20th St #59 Vero Beach, FL | 2.0 | 2.0 | 1147 | $1,699 | $1.48 | 21d | 1 | 0.36mi |
| 8775 20th St #909 Vero Beach, FL | 2.0 | 2.0 | 1000 | $1,799 | $1.80 | 21d | 1 | 0.36mi |
| 589 Johnathans Cay Vero Beach, FL | 3.0 | 2.0 | 1409 | $1,799 | $1.28 | 13d | 1 | 0.42mi |
| 344 Heritage Blvd Vero Beach, FL | 2.0 | 2.0 | 1000 | $1,499 | $1.50 | 21d | 1 | 0.58mi |
| 174 Congress St Vero Beach, FL | 2.0 | 2.0 | 1200 | $1,700 | $1.42 | 21d | 1 | 0.62mi |
| 1930 Westhampton Ct Vero Beach, FL | 2.0 | 2.0 | 1531 | $1,950 | $1.27 | 21d | 1 | 0.68mi |
| 1625 Pointe West Way Vero Beach, FL | 3.0 | 2.5 | 1600 | $2,000 | $1.25 | 21d | 1 | 0.71mi |
| 8415 22nd St Vero Beach, FL | 2.0 | 2.0 | 1100 | $2,000 | $1.82 | 13d | 1 | 0.89mi |
| 2240 86th Dr Vero Beach, FL | 2.0 | 2.0 | 951 | $1,875 | $1.97 | 21d | 1 | 1.00mi |
| 2050 Griffon Rd Vero Beach, FL | 1.0–2.0 | 1.0–2.0 | 850 | $2,295 | $2.70 | 13d | 31 | 1.10mi |
| 2365 89th Dr Vero Beach, FL | 2.0 | 2.0 | 1182 | $1,700 | $1.44 | 21d | 1 | 1.23mi |
| 7580 Heron Cir Vero Beach, FL | 1.0–3.0 | 1.0–2.0 | 1003 | $2,076 | $2.07 | 13d | 21 | 1.23mi |
Listing history 13 events
-
2026-06-19days on market $65,000 Active 15 DOM
-
2026-06-18days on market $65,000 Active 14 DOM
-
2026-06-17days on market $65,000 Active 13 DOM
-
2026-06-16days on market $65,000 Active 12 DOM
-
2026-06-15days on market $65,000 Active 11 DOM
-
2026-06-14days on market $65,000 Active 9 DOM
-
2026-06-13days on market $65,000 Active 8 DOM
-
2026-06-10days on market $65,000 Active 6 DOM
-
2026-06-09days on market $65,000 Active 5 DOM
-
2026-06-08days on market $65,000 Active 4 DOM
-
2026-06-07days on market $65,000 Active 3 DOM
-
2026-06-05remarks 359-char remark
-
2026-06-05$65,000 Active 1 DOM
ⓘ Source: listings_history table (triggers on properties + properties_extension) + one-shot
backfill from property_details.listing_events for pre-trigger history.
Climate risk First Street
- Flood 1/10 Low FEMA zone X (unshaded) · 0% chance over 30 yrs
- Wildfire 4/10 Moderate
- Heat 10/10 Extreme 7 d/yr ≥106°F today · 23 d/yr by 30 yrs out
- Wind 10/10 Extreme 99% chance of damaging wind over 30 yrs
- Air quality 1/10 Low 0 unhealthy d/yr today · 0 by 30 yrs out
Nearby sold comps map
Loading sold comps map…
Walkable amenities ~0.75 mi
Loading nearby amenities…
Taxation est. · year 1
- Rental income
- $22,607
- − Mortgage interest
- −$3,641
- − Property taxes
- −$975
- − Insurance
- −$325
- − Repairs & maintenance
- −$1,809
- − Management
- −$1,809
- − Depreciation
- −$1,891
- Taxable income
- $12,158
- Est. tax owed @ 24.0%
- −$2,918
- After-tax cash flow
- $9,551/yr
For passive investors: Depreciation is non-cash, so a rental often shows a tax loss while cash-flowing — sheltering income. Rental losses are passive: they offset passive income freely, and up to $25,000/yr can offset ordinary (W-2) income if you actively participate and your MAGI is under $100k (phasing out to $0 by $150k); unused losses carry forward. On sale, claimed depreciation is recaptured at up to 25%, and gains may owe capital-gains tax (a 1031 exchange can defer both). Figures are a year-1 estimate at your 24.0% rate — not tax advice; consult a CPA.
Condition & rehab AI · 13 photos
This waterfront home in Vero Palm Estates is in good condition with recent updates, including a new roof and A/C. It offers a good balance of curb appeal and interior updates, making it a solid investment.
Value-add opportunities
- Both Paint exterior siding — Enhances curb appeal and value
- Both Trim and mulch landscaping — Improves curb appeal and enhances property value
Renovation cost estimate screening
Value-add ROI direction
- Both Paint exterior siding — Enhances curb appeal and value ↑
- Both Trim and mulch landscaping — Improves curb appeal and enhances property value ↑
ⓘ Cost ranges are severity-bucket heuristics (US national rule-of-thumb). Get contractor quotes + a written scope before underwriting a rehab budget.
Schools (NCES district)
- District
- Indian River
- NCES district ID
- 1200930
- Math proficiency
- 48% ▼ -9.00%
- Reading proficiency
- 52% ▼ -3.00%
- Median HH income
- $46,597
- Composite
- 42.45/100
- National rank
- #3218
- State rank
- #35 of 73 in FL
Livability — West Vero Corridor
- Score
- 74/100
- State rank
- #273
- US rank
- #4421
Category grades
Schools grade is shown separately in the Schools card above.
Census & demographics
- Census place
- West Vero Corridor, FL
- County
- Indian River County · 143,738 people
- Metro
- Sebastian-Vero Beach, FL
- Population (ZIP)
- 20,686
- Household income
- $66,771
- Rent vs Own
- Severe rent burden
- 766.0
Population outlook (Indian River County) Hauer SSP2
- Today (2025)
- 165,104 people
- By 2030
- 172,869 · +4.7%
- By 2040
- 185,640 · +12.4%
- By 2050
- 194,465 · +17.8%
- By 2075
- 211,115 · +27.9%
- By 2100
- 211,781 · +28.3%
Race, ethnicity, and origin ACS 2023
- Neighborhood character
- Predominantly White (83%)
- Race & ethnicity
- White 83% Hispanic / Latino 9% Two or more races 7% Black 5%
- Hispanic origin (detail)
- Puerto Rican 4% Cuban 1%
- Common ancestry
- Romanian 5% Lithuanian 3% Slovak 2%
- Foreign-born
- 8% · Canada, Jamaica
- Languages at home
- 90% English-only · Spanish 7% Russian/Polish/Slavic 1% French/Haitian/Cajun 1%
Political lean MEDSL · Indian River
- 2024 margin
- Strong R (+27.4) · D 36.0% · R 63.4%
- 2008→2024 swing
- -12.5pp toward R · 2008: -14.8pp · 2024: -27.4pp
- All cycles
- 2024: R+27.4 2020: R+21.6 2016: R+24.5 2012: R+22.3 2008: R+14.8
Not yet ingested
- Civics
- —
Market trends
- HPI YoY
- ▼ -102.01%
- Current HPI
- 280.669
- Rent YoY
- ▲ 0.60%
- Metro
- Sebastian-Vero Beach, FL
- State GDP YoY
- ▲ 3.28%
- F500 in state
- 36
Industry mix (Fortune 500 HQ in FL)
| Industry | F500 HQs | Revenue |
|---|---|---|
| Industrial Technology | 2 | $29B |
|
||
| Insurance | 2 | $17B |
|
||
| Retail | 1 | $60B |
|
||
| Technology Distribution | 1 | $58B |
|
||
| Homebuilding | 1 | $35B |
|
||
| Technology Manufacturing | 1 | $35B |
|
||
Price history
1 event — show timeline
- 2026-06-04 Listed $65,000 ForSaleByOwner.com
Cash-flow waterfall
monthlySold comps — $/sqft
last 12 mo · ≤1 miLoading sold comps…