 Duplex
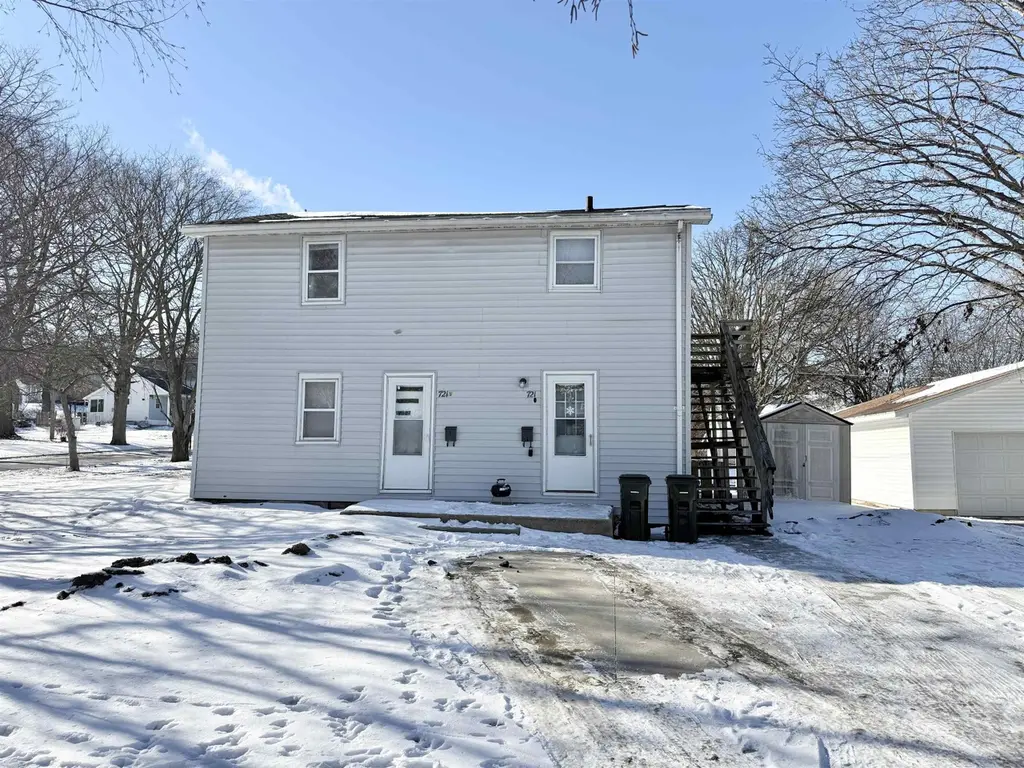
721 Olive St · Cedar Falls, IA
Flood risk 1/10 · Minimal
- FEMA flood zone
- X (unshaded)
- Chance of flooding over 30 yrs
- 0.0%
- Est. flood insurance / yr
- $473 – $860
Fire risk 1/10 · Minimal
- Est. fire insurance / yr
- $902 – $1,676
Heat risk 3/10 · Minor
- Hot days now (above 101°F)
- 7 days/yr
- Hot days in 30 yrs
- 15 days/yr
Wind risk 2/10 · Minimal
- Chance of severe wind over 30 yrs
- —
Air-quality risk 1/10 · Minimal
- Unhealthy air days now
- 0 days/yr
- Unhealthy air days in 30 yrs
- 0 days/yr
Risk factors via First Street. Map © Google.
Why this score? — see what drove the C+ grade
The composite is a weighted blend of 9 inputs, each scored 0–100. Each bar is that input's sub-score; the figure is the points it added to the 100-point composite (weight × sub-score).
- Cash flow +25.6/30.0
- DSCR +8.5/10.0
- ARV discount +7.5/15.0
- 1% rule +6.6/10.0
- Schools +6.6/10.0
- Livability +4.0/5.0
- Rent growth +3.0/5.0
- Condition / age +2.5/5.0
- Appreciation +0.0/10.0
$165,000
🖨 Deal sheet 📄 Offer letter ✓ Due diligence
Multi-family units
County records classify this as Multi-Family (2-4 Unit). Listing-text estimate: 2 units. confirmed
Listing remarks MLS
Cedar Falls Duplex with Great Cashflow! Need I really say more?!?! This Up/Down Duplex is fully occupied and Brings in great Income! One Bedroom, One Bath on the main floor and One Bedroom, One Bath upstairs in the other Unit. Call today to get your showing scheduled! And lets start bringing in some extra income for you!! Call with questions.
Key facts
- 4,356 sq ft lot
- 2 parking spots
- Built 1920
Neighborhood map
What this means for you Summary
Snapshot
- This is a 2 × 1-bed/1-bath units multifamily listed at $165k.
Deal economics
- At list price, monthly cash flow is $391 ($5k/yr) — positive. Per door: $196/mo.
- The deal already cash-flows at list — no discount required.
- Meets the 1% rule at list price ($2k rent vs $165k).
- Recommended offer: $145k (12.0% below list) — sets the bar for market timing.
- Cap rate 9.1% vs local median 3.1% in Cedar Falls — top-decile yield for the area; either an underpriced asset or a hidden risk that comps aren't pricing in. Stress-test before assuming the spread holds.
Location & tenants
- Location reads 81/100 on livability (#60 in IA, #1,357 nationally) — a professional / high-income tenant draw. Strengths: schools A+, cost of living A+, housing A+; Watch: amenities D, commute F.
- Cedar Falls Community School District (urban): math 76% / reading 79% proficiency, ranked #45 of 289 in IA (top 16%) — strong family-tenant draw, lease renewals of 3-5y typical; only 18% free/reduced lunch — higher-income household profile.
- Market conditions: Rents rising (+2.0%/yr); 387 active listings in the ZIP; 15 comparable units currently listed for rent nearby; rentals lingering (median 44d on market — plan ~5-8 weeks vacancy on turnover, expect pricing pressure); 60% of comp listings sitting > 30 days — soft ceiling on asking rent; solid renter incomes; 287 units permitted in Black Hawk County in 2024 (67 in 5+ unit buildings).
Forward outlook
- Local home prices are declining (-3.0%/yr); year-one equity from $1k of loan paydown is wiped out by about $5k of value loss. Plan a longer hold.
- Black Hawk County population projected at +10% by 2050 — modest demand growth; plan on rents tracking national, not racing it.
Negotiation context
- It's been on market 141 days — a 12% lower offer ($145k) is reasonable based on typical stale-listing flexibility.
Risks & watch-outs
- Watch-outs: built in 1920 — expect roof / HVAC / electrical / plumbing capex.
Questions for the listing agent
- It's been on market 141 days. Have you received any prior offers? Is the seller open to a 12% concession, seller financing, or rate buy-down credit?
- Can we see the unit-by-unit rent roll, current vacancy, and any below-market leases? What's the average tenancy length?
- What capital expenditures (roof, boiler, parking lot, exteriors) have been made in the last 5 years, and what's planned in the next 2?
- Built in 1920 — when were the roof, HVAC, electrical panel, plumbing, and water heater last replaced?
- Why hasn't it sold? Are there any deal-killer items the seller is aware of (foundation, flood, title, zoning, code violations)?
- Is there a deadline driving the sale (1031 exchange, divorce, estate, relocation)? That informs how much negotiation room exists.
- Schools are A-rated — typically a magnet for longer-tenancy family renters. What's the average tenant stay here, and is there a school-zone premium baked into asking?
- What's the average days-on-market for RENTAL listings here right now (not sales)? A rising rental-DOM trend means longer vacancies and softer asking-rent achievability than the comps imply.
- What's the recent tenant-quality profile in this submarket — average credit score on applications, eviction rate, late-payment / NSF rate, and stable-employment percentage? A property-management company in the area should have these aggregated.
- How much new apartment / multifamily construction is in the pipeline within 1–3 miles? Heavy new supply (>2% of stock underway) typically softens rents 12–24 months out; light construction supports rent growth.
Investment metrics
- 1% rule
- 1.16% ✓
- Cap rate
- 9.14%
- Cash-on-cash
- 10.16%
- DSCR
- 1.45
- GRM
- 7.2
CMA / ARV
- ARV (median comp)
- $1,536,743
- List price
- $165,000
- Delta
- -89.26%
- Verdict
- UNDERPRICED
- Comps
- 2 within 2.0 mi
Show comp detail 1 sale within ~0.75 mi
| Address | Dist | Beds/Ba | Sqft | Sold | Price | $/sf | Match |
|---|---|---|---|---|---|---|---|
| 930 W 1st St | 0.42mi | 2/2.0 | 1,508 (+8%) | 7mo | $147,000 | $97 | 58 |
Match score weights: distance 35% · size 25% · config 20% · recency 20%. Top-matched comps best support the ARV.
Projected returns pro-forma
-3.0% appreciation · 1.97% rent growth · sell at horizon
- IRR
- -2.2%
- Equity multiple
- 0.92×
- Total profit
- $-3,766
- Equity at exit
- $24,602
- IRR
- 6.4%
- Equity multiple
- 1.45×
- Total profit
- $20,990
- Equity at exit
- $14,266
Cash invested: $46,200 (down + closing). Projections, not guarantees.
Landlord ↔ Tenant lean methodology
- Overall (STATE)
- 83 Strongly Landlord-Friendly
- State Iowa
- 83 Strongly Landlord-Friendly · R+6
- County
- — inherits STATE
- City
- — inherits STATE
ZIP-level market 50613
- Rents YoY
- 2.0%
- Active inventory
- 387
- Price-to-rent
- 14.4×
Monthly cashflow live
- Estimated rent
- $1,910 high interval (Pro) →
- Mortgage (P&I)
- −$865
- Tax from tax record
- −$184 /mo · $2,204/yr
- Insurance
- −$69
- HOA
- −$0
- Vacancy / Maint / Mgmt
- −$401
- Net cashflow
- $391
Break-even live
2-unit breakdown (identical units grouped — click to expand)
| Units | Beds | Baths | Est. rent |
|---|---|---|---|
| 2× units | 1 | 1 | $1,910 |
| #1 | 1 | 1 | $955 |
| #2 | 1 | 1 | $955 |
| Total (2 units) | $1,910 | ||
UW: 25.0% down · 7.5% · 30yr · 1.5% tax · 5.0% vac · 8.0% maint · 8.0% mgmt
Financing live
Cash to close
- Down payment
- $41,250
- Closing costs
- $4,950
- Reserves months
- —
- Total cash needed
- —
Loan-product check · same deal, 3 products live
Conventional
25% down · 7.5% · 30yr
- Down + closing
- —
- Monthly P&I
- —
- Monthly cashflow
- —
- DSCR
- —
- Eligible?
- —
Personal DTI + credit; lowest rate.
DSCR
20% down · 8.5% · 30yr
- Down + closing
- —
- Monthly P&I
- —
- Monthly cashflow
- —
- DSCR
- —
- Eligible?
- —
No personal income docs; deal must DSCR.
Hard money
10% down · 12.0% · 12mo
- Down + closing
- —
- Monthly P&I
- —
- Monthly cashflow
- —
- DSCR
- —
- Eligible?
- —
Short-term bridge; refi at stabilization.
Rent comps 15 comps
| Address | Beds | Baths | Sqft | Rent | $/sqft | DOM | Units | Dist |
|---|---|---|---|---|---|---|---|---|
| 1014 Main St Cedar Falls, IA | 2.0 | 1.0 | 1400 | $1,500 | $1.07 | 43d | 1 | 0.54mi |
| 221 E 5th St #209 Cedar Falls, IA | 2.0 | 2.0 | 1200 | $2,000 | $1.67 | 43d | 1 | 0.61mi |
| 100 E 2nd St Cedar Falls, IA | 1.0 | 1.0 | 986 | $1,610 | $1.63 | 20d | 6 | 0.65mi |
| 300 State St Cedar Falls, IA | 2.0 | 1.0 | 1000 | $1,650 | $1.65 | 43d | 2 | 0.68mi |
| 1320-1322 Delta Dr Unit 1322 (South Side) Cedar Falls, IA | 3.0 | 2.0 | 1664 | $1,350 | $0.81 | 43d | 1 | 0.69mi |
| 1823-1825 Alden Ave Unit 1825 Cedar Falls, IA | 2.0 | 1.0 | 1133 | $1,250 | $1.10 | 43d | 1 | 0.73mi |
| 1902 Campus St Cedar Falls, IA | 3.0 | 2.0 | 1300 | $1,350 | $1.04 | 20d | 1 | 0.79mi |
| 1815 W 18th St Cedar Falls, IA | 1.0–3.0 | 1.0–3.0 | 1065 | $1,200 | $1.13 | 20d | 7 | 0.88mi |
| 1915 Main St Cedar Falls, IA | 2.0 | 1.0 | 960 | $1,050 | $1.09 | 43d | 1 | 0.90mi |
| 1123 W 22nd St Cedar Falls, IA | 2.0 | 1.0 | 966 | $850 | $0.88 | 20d | 1 | 0.98mi |
| 2208 Walnut St Cedar Falls, IA | 3.0 | 1.0 | 1380 | $1,400 | $1.01 | 43d | 1 | 1.01mi |
| 2311 Olive St Cedar Falls, IA | 3.0–4.0 | 1.0 | 1050 | $995 | $0.95 | 20d | 2 | 1.06mi |
| 2412 Olive St Cedar Falls, IA | 2.0 | 1.0 | 900 | $800 | $0.89 | 43d | 1 | 1.14mi |
| 810 W 25th St Unit 810-5 Cedar Falls, IA | 2.0 | 1.0 | 878 | $825 | $0.94 | 43d | 1 | 1.19mi |
| 2515 Olive St Cedar Falls, IA | 3.0 | 1.0 | 1380 | $975 | $0.71 | 20d | 1 | 1.21mi |
Listing history 22 events
-
2026-06-19days on market $165,000 Active 141 DOM
-
2026-06-18days on market $165,000 Active 140 DOM
-
2026-06-17days on market $165,000 Active 139 DOM
-
2026-06-16days on market $165,000 Active 138 DOM
-
2026-06-15days on market $165,000 Active 137 DOM
-
2026-06-14days on market $165,000 Active 135 DOM
-
2026-06-13days on market $165,000 Active 134 DOM
-
2026-06-10days on market $165,000 Active 132 DOM
-
2026-06-09days on market $165,000 Active 131 DOM
-
2026-06-08days on market $165,000 Active 130 DOM
-
2026-06-07days on market $165,000 Active 129 DOM
-
2026-06-05days on market $165,000 Active 126 DOM
-
2026-06-03days on market $165,000 Active 125 DOM
-
2026-06-02days on market $165,000 Active 124 DOM
-
2026-06-01days on market $165,000 Active 123 DOM
-
2026-05-31days on market $165,000 Active 122 DOM
-
2026-05-30days on market $165,000 Active 121 DOM
-
2026-02-18price $165,000 348-char remark
Show marketing remark (348 chars)
Cedar Falls Duplex with Great Cashflow! Need I really say more?!?! This Up/Down Duplex is fully occupied and Brings in great Income! One Bedroom, One Bath on the main floor and One Bedroom, One Bath upstairs in the other Unit. Call today to get your showing scheduled! And lets start bringing in some extra income for you!! Call with questions.
-
2026-01-29$175,000 Active 348-char remark
Show marketing remark (348 chars)
Cedar Falls Duplex with Great Cashflow! Need I really say more?!?! This Up/Down Duplex is fully occupied and Brings in great Income! One Bedroom, One Bath on the main floor and One Bedroom, One Bath upstairs in the other Unit. Call today to get your showing scheduled! And lets start bringing in some extra income for you!! Call with questions.
-
2025-06-26price $220,000
-
2024-08-01soldstatus $200,000
-
2023-01-05soldstatus $135,000
ⓘ Source: listings_history table (triggers on properties + properties_extension) + one-shot
backfill from property_details.listing_events for pre-trigger history.
Tax reassessment forecast IA · Partial reset (capped growth)
- Current annual tax
- $2,204 · $184/mo
- Projected year-2 tax
- $2,397 · $200/mo
- Expected delta
- +$193/yr (+$16/mo · 8.8%)
ⓘ Screening estimate from a state-policy table — verify with the county assessor before closing.
Climate risk First Street
- Flood 1/10 Low FEMA zone X (unshaded) · 0% chance over 30 yrs
- Wildfire 1/10 Low
- Heat 3/10 Moderate 7 d/yr ≥101°F today · 15 d/yr by 30 yrs out
- Wind 2/10 Low
- Air quality 1/10 Low 0 unhealthy d/yr today · 0 by 30 yrs out
Nearby sold comps map
Loading sold comps map…
Walkable amenities ~0.75 mi
Loading nearby amenities…
Taxation est. · year 1
- Rental income
- $22,920
- − Mortgage interest
- −$9,243
- − Property taxes
- −$2,204
- − Insurance
- −$825
- − Repairs & maintenance
- −$1,834
- − Management
- −$1,834
- − Depreciation
- −$4,800
- Taxable income
- $2,181
- Est. tax owed @ 24.0%
- −$523
- After-tax cash flow
- $4,171/yr
For passive investors: Depreciation is non-cash, so a rental often shows a tax loss while cash-flowing — sheltering income. Rental losses are passive: they offset passive income freely, and up to $25,000/yr can offset ordinary (W-2) income if you actively participate and your MAGI is under $100k (phasing out to $0 by $150k); unused losses carry forward. On sale, claimed depreciation is recaptured at up to 25%, and gains may owe capital-gains tax (a 1031 exchange can defer both). Figures are a year-1 estimate at your 24.0% rate — not tax advice; consult a CPA.
Schools (NCES district)
- District
- Cedar Falls Community School District
- NCES district ID
- 1906510
- Math proficiency
- 76% ▼ -6.00%
- Reading proficiency
- 79% ▼ -2.00%
- Median HH income
- $53,634
- Composite
- 65.93/100
- National rank
- #443
- State rank
- #45 of 289 in IA
Livability — Cedar Falls
- Score
- 81/100
- State rank
- #60
- US rank
- #1357
Category grades
Schools grade is shown separately in the Schools card above.
Census & demographics
- Census place
- Cedar Falls, IA
- County
- Black Hawk County · 112,933 people
- City population
- 43,867
- Metro
- Waterloo-Cedar Falls, IA
- Population (ZIP)
- 43,867
- Household income
- $78,503
- Rent vs Own
- Severe rent burden
- 1514.0
Population outlook (Black Hawk County) Hauer SSP2
- Today (2025)
- 139,716 people
- By 2030
- 142,853 · +2.2%
- By 2040
- 147,843 · +5.8%
- By 2050
- 153,247 · +9.7%
- By 2075
- 167,977 · +20.2%
- By 2100
- 177,320 · +26.9%
Race, ethnicity, and origin ACS 2023
- Neighborhood character
- Predominantly White (90%)
- Race & ethnicity
- White 90% Asian 3% Two or more races 3% Hispanic / Latino 3% Black 1%
- Common ancestry
- Portuguese 6% Italian 3% Iranian 3%
- Foreign-born
- 4% · Canada, South Korea
- Languages at home
- 95% English-only · Spanish 2% Russian/Polish/Slavic 1% Other Indo-European 1%
Political lean MEDSL · Black Hawk
- 2024 margin
- Toss-up / Even · D 50.0% · R 48.8% · Other 1.2%
- 2008→2024 swing
- -21.3pp toward R · 2008: 22.4pp · 2024: 1.2pp
- All cycles
- 2024: D+1.2 2020: D+9.0 2016: D+7.3 2012: D+20.0 2008: D+22.4
Not yet ingested
- Civics
- —
Market trends
- HPI YoY
- ▼ -175.51%
- Current HPI
- 169.0591
- Rent YoY
- ▲ 1.97%
- Metro
- Waterloo-Cedar Falls, IA
- State GDP YoY
- ▲ 2.48%
- F500 in state
- 4
Industry mix (Fortune 500 HQ in IA)
| Industry | F500 HQs | Revenue |
|---|---|---|
| Financial Services | 1 | $16B |
|
||
| Retail / Convenience | 1 | $15B |
|
||
Price history
+22.2% since first listed5 events — show timeline
- 2026-02-18 Price Changed $165,000 NEIRBR as distributed by MLS GRID
- 2026-01-29 Listed $175,000 NEIRBR as distributed by MLS GRID
- 2025-06-26 Price Changed $220,000 NEIRBR as distributed by MLS GRID
- 2024-08-01 Sold (Public Records) $200,000 Public Records
- 2023-01-05 Sold (Public Records) $135,000 Public Records
Property tax history
+2.8%/yrLatest (2025): $2,204 · +2.9% YoY. Source: county tax records.
Cash-flow waterfall
monthlySold comps — $/sqft
last 12 mo · ≤1 miLoading sold comps…