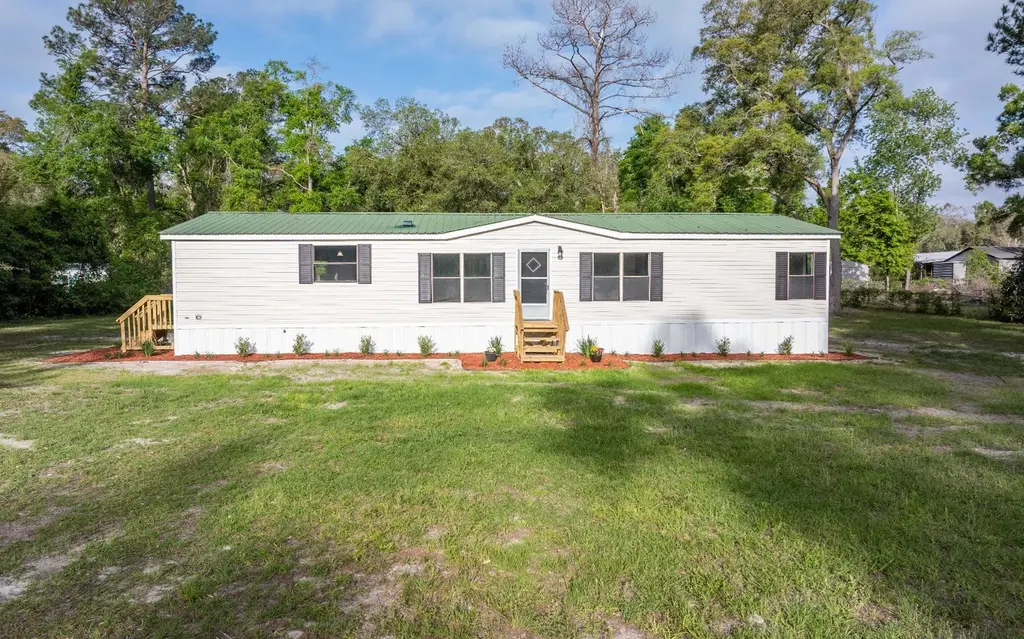
152 SW Kimdale Loop · Lake City, FL
Flood risk 1/10 · Minimal
- FEMA flood zone
- X (unshaded)
- Chance of flooding over 30 yrs
- 0.0%
- Est. flood insurance / yr
- $507 – $1,088
Fire risk 5/10 · Moderate
- Est. fire insurance / yr
- $947 – $1,759
Heat risk 8/10 · Major
- Hot days now (above 108°F)
- 7 days/yr
- Hot days in 30 yrs
- 19 days/yr
Wind risk 9/10 · Severe
- Chance of severe wind over 30 yrs
- 99.0%
Air-quality risk 5/10 · Moderate
- Unhealthy air days now
- 7 days/yr
- Unhealthy air days in 30 yrs
- 9 days/yr
Risk factors via First Street. Map © Google.
Why this score? — see what drove the D grade
The composite is a weighted blend of 9 inputs, each scored 0–100. Each bar is that input's sub-score; the figure is the points it added to the 100-point composite (weight × sub-score).
- Appreciation +10.0/10.0
- ARV discount +7.5/15.0
- Cash flow +7.4/30.0
- Schools +4.5/10.0
- Livability +3.7/5.0
- Rent growth +2.5/5.0
- Condition / age +2.5/5.0
- 1% rule +2.1/10.0
- DSCR +1.5/10.0
$169,000
🖨 Deal sheet (PDF) 📄 Offer letter ✓ Due diligence
Listing remarks MLS
Nice location and neighborhood. Perfect spot to put home/mobile if you enjoy country living. Lot is wooded and zoned A-3. Go & See! Septic System "AS IS"
Key facts
- Gas fireplace
- Spacious lot
- Ample cabinet space
Tags
Property features AI
Exterior
- Parking: 3-car garage
- Utilities: Private well water
- Home design: Residential manufactured home; Located on a 0.7-acre lot; Zoned A-3
- Construction: Frame construction
- Exterior features: Metal roof
Interior
- Kitchen: Dishwasher; Electric cooktop; Refrigerator
- Bathrooms: Two full bathrooms
- Heating & cooling: Central heating (electric); Central air conditioning; Ceiling fans
- Interior features: Gas fireplace
Neighborhood map
What this means for you Summary
Snapshot
- This is a 3-bed/2.0-bath other listed at $169k.
Deal economics
- At list price, monthly cash flow is $-220 ($-3k/yr) — negative.
- To cash-flow at today's rent, offer at most $137k (18.8% below list).
- To meet the 1% rule (rent ≥ 1% of price), the offer needs to be $120k (29.0% below list).
- Recommended offer: $120k (29.0% below list) — sets the bar for 1% rule.
- Cap rate 4.7% vs local median 3.8% in Lake City — meaningfully above typical; check what's discounted (condition, days-on-market, listing class) to confirm the premium yield is real.
Location & tenants
- Location reads 73/100 on livability (#304 in FL) — a middle-class / working-renter tenant base. Strengths: cost of living A+, housing A+, health & safety A+; Watch: amenities C-, commute F, employment F.
- Columbia (town): math 53% / reading 54% proficiency, ranked #25 of 73 in FL (top 34%) — acceptable for families but not a draw, mixed tenant base, ~2y average lease.
- Zoned schools: Columbia City Elementary School (math 62% / reading 63%, grade B, #601 of 2,144 statewide, top 28%, 615 students, 62% FRL) — zoned schools at 62% FRL track the district average.
- Market conditions: 206 active listings in the ZIP; 1 comparable units currently listed for rent nearby; 178 units permitted in Columbia County in 2024 (0 in 5+ unit buildings).
Forward outlook
- In year one you build about $18k of equity ($1k loan paydown + $17k appreciation (10.0% local appreciation)).
- Columbia County population projected to shrink 7% by 2050 — rents likely to lag national; underwrite the cash flow, not the appreciation.
- By year 3, paydown + projected appreciation supports a ~$46k cash-out refi (75% LTV) — recoverable capital for the next deal without selling this one.
Negotiation context
- It's been on market 72 days — a 6% lower offer ($159k) is reasonable based on typical stale-listing flexibility.
- Current owner paid $19k; list at $169k implies a 789% gain — meaningful room to come down on a strong offer.
Risks & watch-outs
- Climate carrying-cost: severe wind risk, 99% chance of damaging wind over 30y; moderate wildfire risk; extreme-heat days projected 7→19/yr by 2055 (HVAC capex compounding) — expect insurance premiums to compound above CPI over the hold.
Questions for the listing agent
- What do current leases actually rent for vs. the listed asking? Can we see a recent rent roll and the last 12 months of T-12 income?
- It's been on market 72 days. Have you received any prior offers? Is the seller open to a 29% concession, seller financing, or rate buy-down credit?
- Why hasn't it sold? Are there any deal-killer items the seller is aware of (foundation, flood, title, zoning, code violations)?
- Is there a deadline driving the sale (1031 exchange, divorce, estate, relocation)? That informs how much negotiation room exists.
- Schools are B-rated — typically a magnet for longer-tenancy family renters. What's the average tenant stay here, and is there a school-zone premium baked into asking?
- The area grade is low — what's the realistic commute time and amenity access for the typical tenant pool here? Any planned neighborhood developments (good or bad) we should know about?
- What's the average days-on-market for RENTAL listings here right now (not sales)? A rising rental-DOM trend means longer vacancies and softer asking-rent achievability than the comps imply.
- What's the recent tenant-quality profile in this submarket — average credit score on applications, eviction rate, late-payment / NSF rate, and stable-employment percentage? A property-management company in the area should have these aggregated.
- How much new for-sale + rental construction is in the pipeline within 1–3 miles? Heavy new supply typically softens prices + rents 12–24 months out; constrained supply supports both.
Investment metrics
- 1% rule
- 0.71% ✗
- Cap rate
- 4.73%
- Cash-on-cash
- -5.58%
- DSCR
- 0.75
- GRM
- 11.7
CMA / ARV
No comps found within radius.
Projected returns pro-forma
10.0% appreciation · 3.0% rent growth · sell at horizon
- IRR
- 20.3%
- Equity multiple
- 2.65×
- Total profit
- $78,053
- Equity at exit
- $152,249
- IRR
- 18.5%
- Equity multiple
- 6.09×
- Total profit
- $240,904
- Equity at exit
- $328,330
Cash invested: $47,320 (down + closing). Projections, not guarantees.
Landlord ↔ Tenant lean methodology
- Overall (STATE)
- 87 Strongly Landlord-Friendly
- State Florida
- 87 Strongly Landlord-Friendly · R+3
- County
- — inherits STATE
- City
- — inherits STATE
ZIP-level market 32024
- Home prices YoY
- 7.6%
- Active inventory
- 206
- Price-to-rent
- 11.7×
Monthly cashflow live
- Estimated rent
- $1,200 medium interval (Pro) →
- Mortgage (P&I)
- −$886
- Tax est. 1.5%
- −$211 /mo · $2,535/yr
- Insurance
- −$70
- HOA
- −$0
- Vacancy / Maint / Mgmt
- −$252
- Net cashflow
- $-220
Break-even live
Sensitivity live
| Price | -10% $-103 | -5% $-162 | +0% $-220 | +5% $-278 | +10% $-337 |
|---|---|---|---|---|---|
| Rent | -10% $-315 | -5% $-267 | +0% $-220 | +5% $-173 | +10% $-125 |
| Rate | -1.0pp $-135 | -0.5pp $-177 | base $-220 | +0.5pp $-264 | +1.0pp $-308 |
UW: 25.0% down · 7.5% · 30yr · 1.5% tax · 5.0% vac · 8.0% maint · 8.0% mgmt
Financing live
Cash to close
- Down payment
- $42,250
- Closing costs
- $5,070
- Reserves months
- —
- Total cash needed
- —
Loan-product check · same deal, 3 products live
Conventional
25% down · 7.5% · 30yr
- Down + closing
- —
- Monthly P&I
- —
- Monthly cashflow
- —
- DSCR
- —
- Eligible?
- —
Personal DTI + credit; lowest rate.
DSCR
20% down · 8.5% · 30yr
- Down + closing
- —
- Monthly P&I
- —
- Monthly cashflow
- —
- DSCR
- —
- Eligible?
- —
No personal income docs; deal must DSCR.
Hard money
10% down · 12.0% · 12mo
- Down + closing
- —
- Monthly P&I
- —
- Monthly cashflow
- —
- DSCR
- —
- Eligible?
- —
Short-term bridge; refi at stabilization.
Rent comps 1 comps
| Address | Beds | Baths | Sqft | Rent | $/sqft | DOM | Units | Dist |
|---|---|---|---|---|---|---|---|---|
| 429 SW Dairy St Lake City, FL | 3.0 | 2.0 | 1704 | $1,200 | $0.70 | 15d | 1 | 1.06mi |
Listing history 23 events
-
2026-06-21days on market $169,000 Active 72 DOM
-
2026-06-19days on market $169,000 Active 70 DOM
-
2026-06-18days on market $169,000 Active 69 DOM
-
2026-06-17days on market $169,000 Active 68 DOM
-
2026-06-17price $169,000 Active 67 DOM
-
2026-06-16days on market $175,000 Active 67 DOM
-
2026-06-15days on market $175,000 Active 66 DOM
-
2026-06-14days on market $175,000 Active 64 DOM
-
2026-06-12days on market $175,000 Active 63 DOM
-
2026-06-09days on market $175,000 Active 60 DOM
-
2026-06-08days on market $175,000 Active 59 DOM
-
2026-06-07pricedays on market $175,000 Active 58 DOM
-
2026-06-05days on market $185,000 Active 55 DOM
-
2026-06-03days on market $185,000 Active 54 DOM
-
2026-06-02days on market $185,000 Active 53 DOM
-
2026-06-01days on market $185,000 Active 52 DOM
-
2026-05-31days on market $185,000 Active 51 DOM
-
2026-05-30days on market $185,000 Active 50 DOM
-
2026-05-18price $195,000
-
2026-05-06price $200,000
-
2026-04-22price $210,000
-
2026-04-10$218,700 Active
-
2020-09-25soldstatus $19,000 169-char remark
Show marketing remark (169 chars)
Nice location and neighborhood. Perfect spot to put home/mobile if you enjoy country living. Lot is wooded and zoned A-3. Go & See! Septic System "AS IS"
ⓘ Source: listings_history table (triggers on properties + properties_extension) + one-shot
backfill from property_details.listing_events for pre-trigger history.
Climate risk First Street
- Flood 1/10 Low FEMA zone X (unshaded) · 0% chance over 30 yrs
- Wildfire 5/10 Major
- Heat 8/10 Severe 7 d/yr ≥108°F today · 19 d/yr by 30 yrs out
- Wind 9/10 Extreme 99% chance of damaging wind over 30 yrs
- Air quality 5/10 Major 7 unhealthy d/yr today · 9 by 30 yrs out
Nearby sold comps map
Loading sold comps map…
Walkable amenities ~0.75 mi
Loading nearby amenities…
Taxation est. · year 1
- Rental income
- $14,400
- − Mortgage interest
- −$9,467
- − Property taxes
- −$2,535
- − Insurance
- −$845
- − Repairs & maintenance
- −$1,152
- − Management
- −$1,152
- − Depreciation
- −$4,916
- Taxable loss
- −$5,667
- Est. tax savings @ 24.0%
- +$1,360
- After-tax cash flow
- $-1,279/yr
For passive investors: Depreciation is non-cash, so a rental often shows a tax loss while cash-flowing — sheltering income. Rental losses are passive: they offset passive income freely, and up to $25,000/yr can offset ordinary (W-2) income if you actively participate and your MAGI is under $100k (phasing out to $0 by $150k); unused losses carry forward. On sale, claimed depreciation is recaptured at up to 25%, and gains may owe capital-gains tax (a 1031 exchange can defer both). Figures are a year-1 estimate at your 24.0% rate — not tax advice; consult a CPA.
Schools (NCES district)
- District
- Columbia
- NCES district ID
- 1200360
- Math proficiency
- 53% ▼ -10.00%
- Reading proficiency
- 54% ▼ -3.00%
- Median HH income
- $40,053
- Composite
- 44.74/100
- National rank
- #2750
- State rank
- #25 of 73 in FL
Livability — Lake City
- Score
- 73/100
- State rank
- #304
- US rank
- #5154
Category grades
Schools grade is shown separately in the Schools card above.
Census & demographics
- City population
- 40,507
- Population (ZIP)
- 20,644
Population outlook (Columbia County) Hauer SSP2
- Today (2025)
- 68,129 people
- By 2030
- 67,501 · -0.9%
- By 2040
- 65,465 · -3.9%
- By 2050
- 63,058 · -7.4%
- By 2075
- 56,291 · -17.4%
- By 2100
- 45,243 · -33.6%
Race, ethnicity, and origin ACS 2023
- Neighborhood character
- Predominantly White (78%)
- Race & ethnicity
- White 78% Hispanic / Latino 10% Two or more races 7% Black 6% Asian 2%
- Hispanic origin (detail)
- Mexican 2% Puerto Rican 3%
- Common ancestry
- Italian 2% Portuguese 1% Lithuanian 1%
- Foreign-born
- 5% · Canada, Jamaica
- Languages at home
- 91% English-only · Spanish 8% Vietnamese 1%
Political lean MEDSL · Columbia
- 2024 margin
- Solid R (+50.2) · D 24.6% · R 74.7%
- 2008→2024 swing
- -16.4pp toward R · 2008: -33.8pp · 2024: -50.2pp
- All cycles
- 2024: R+50.2 2020: R+45.2 2016: R+44.5 2012: R+36.7 2008: R+33.8
Not yet ingested
- Civics
- —
Market trends
- HPI YoY
- ▲ 19.05%
- Current HPI
- 269.4659
- Rent YoY
- —
- Metro
- —
- State GDP YoY
- ▲ 3.28%
- F500 in state
- 36
Industry mix (Fortune 500 HQ in FL)
| Industry | F500 HQs | Revenue |
|---|---|---|
| Industrial Technology | 2 | $29B |
|
||
| Insurance | 2 | $17B |
|
||
| Retail | 1 | $60B |
|
||
| Technology Distribution | 1 | $58B |
|
||
| Homebuilding | 1 | $35B |
|
||
| Technology Manufacturing | 1 | $35B |
|
||
Price history
+926.3% since first listed5 events — show timeline
- 2026-05-18 Price Changed $195,000 NFMLS
- 2026-05-06 Price Changed $200,000 NFMLS
- 2026-04-22 Price Changed $210,000 NFMLS
- 2026-04-10 Listed $218,700 NFMLS
- 2020-09-25 Sold (MLS) $19,000 NFMLS
Property tax history
+1.5%/yrLatest (2025): $308 · +12.2% YoY. Source: county tax records.
Cash-flow waterfall
monthlySold comps — $/sqft
last 12 mo · ≤1 miLoading sold comps…