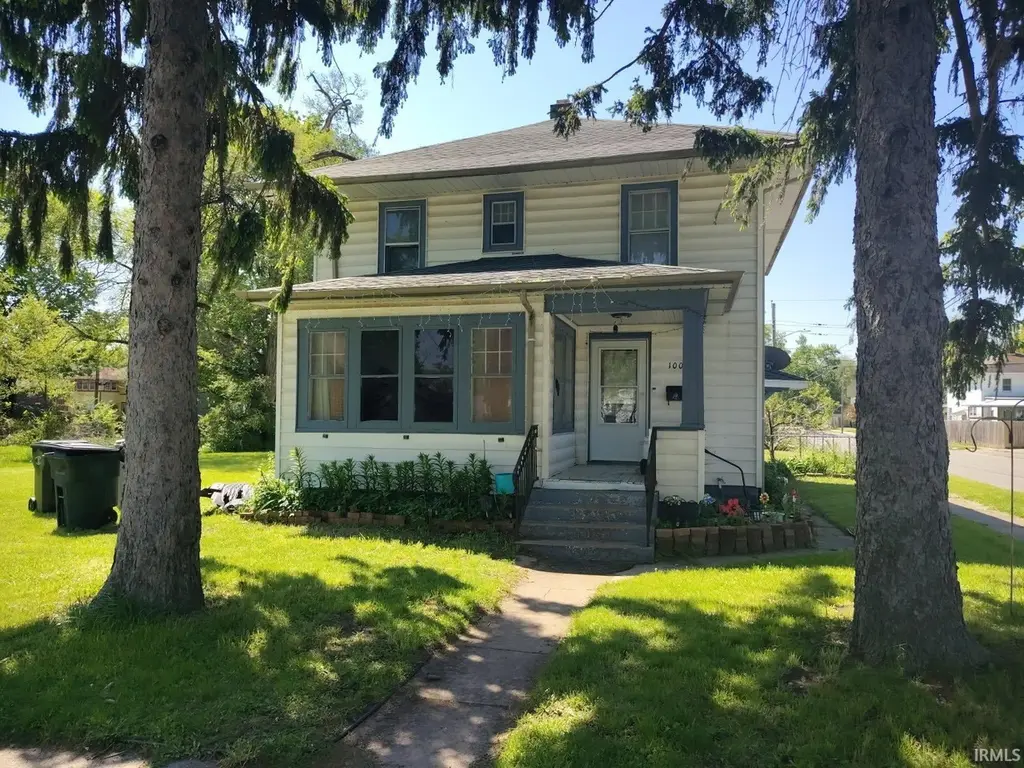
1002 E Bowman St · South Bend, IN
Flood risk 1/10 · Minimal
- FEMA flood zone
- X (unshaded)
- Chance of flooding over 30 yrs
- 0.0%
- Est. flood insurance / yr
- $473 – $860
Fire risk 1/10 · Minimal
- Est. fire insurance / yr
- $717 – $1,331
Heat risk 2/10 · Minimal
- Hot days now (above 99°F)
- 7 days/yr
- Hot days in 30 yrs
- 16 days/yr
Wind risk 2/10 · Minimal
- Chance of severe wind over 30 yrs
- —
Air-quality risk 3/10 · Minor
- Unhealthy air days now
- 2 days/yr
- Unhealthy air days in 30 yrs
- 3 days/yr
Risk factors via First Street. Map © Google.
Why this score? — see what drove the D+ grade
The composite is a weighted blend of 9 inputs, each scored 0–100. Each bar is that input's sub-score; the figure is the points it added to the 100-point composite (weight × sub-score).
- Cash flow +20.6/30.0
- DSCR +6.6/10.0
- 1% rule +4.6/10.0
- Rent growth +3.5/5.0
- ARV discount +3.2/15.0
- Livability +3.2/5.0
- Condition / age +2.5/5.0
- Schools +1.4/10.0
- Appreciation +0.0/10.0
$150,000
🖨 Deal sheet (PDF) 📄 Offer letter ✓ Due diligence
Listing remarks
Nice two story home on a corner lot.
Key facts
- 5,120 sq ft lot
- Built 2002
- Listed 2 days
Property features AI
Finance
- Other: Annual tax amount listed (agent/broker for full details)
Exterior
- Utilities: Public water; Public sewer
- Home design: Single-family, site-built home; One story
- Construction: Built with other/unspecified construction materials
- Exterior features: Corner lot; Lot dimensions approximately 40 x 128
Interior
- Bathrooms: 1 full bathroom
- Heating & cooling: Natural gas heating with forced air; Cooling present (other type)
- Interior features: Full basement; 9 total rooms
- Laundry & utility: Laundry on the main level
Neighborhood map
What this means for you Summary
Snapshot
- This is a 3-bed/1.0-bath single-family listed at $150k.
Deal economics
- At list price, monthly cash flow is $202 ($2k/yr) — positive.
- The deal already cash-flows at list — no discount required.
- To meet the 1% rule (rent ≥ 1% of price), the offer needs to be $144k (4.2% below list).
- Recommended offer: $144k (4.2% below list) — sets the bar for 1% rule.
- Cap rate 7.9% vs local median 4.4% in South Bend — top-decile yield for the area; either an underpriced asset or a hidden risk that comps aren't pricing in. Stress-test before assuming the spread holds.
Location & tenants
- Location reads 64/100 on livability (#365 in IN) — a middle-class / working-renter tenant base. Strengths: cost of living A+, housing A+, health & safety A+; Watch: amenities D, employment D, crime F.
- South Bend Community School Corporation (urban): math 12% / reading 21% proficiency, ranked #284 of 301 in IN (top 94%) — low school quality limits family demand, transient renter base, plan for 1-2y turnover; 66% free/reduced lunch — lower-income household profile, screen leases tightly.
- Zoned schools: Lincoln Elementary School (math 7% / reading 6%, grade F, #964 of 994 statewide, top 97%, 467 students, 86% FRL); Lasalle Academy (math 23% / reading 53%, grade F, #136 of 330 statewide, top 44%, 488 students, 56% FRL); Riley High School (math 19% / reading 46%, grade F, #293 of 369 statewide, top 80%, 992 students, 67% FRL) — zoned schools at 70% FRL track the district average.
- Market conditions: Rents rising fast (+4.1%/yr); 78 active listings in the ZIP; 14 comparable units currently listed for rent nearby; rentals lingering (median 45d on market — plan ~5-8 weeks vacancy on turnover, expect pricing pressure); 57% of comp listings sitting > 30 days — soft ceiling on asking rent; lower-income renter base — watch delinquency; 754 units permitted in St. Joseph County in 2024 (460 in 5+ unit buildings).
- This rent runs 41% of the median local income ($43k/yr) — at the standard rent-burdened threshold; future hikes will face affordability resistance.
Forward outlook
- Local home prices are declining (-3.0%/yr); year-one equity from $1k of loan paydown is wiped out by about $4k of value loss. Plan a longer hold.
Negotiation context
- Only 2 days on market — expect competitive offers; lowballing is unlikely to land.
Questions for the listing agent
- Is there a deadline driving the sale (1031 exchange, divorce, estate, relocation)? That informs how much negotiation room exists.
- Schools are F-rated, which usually means shorter tenancies and higher turnover. Who's the typical renter profile here, and what's been the actual vacancy rate?
- Crime grade is F in this area — have there been break-ins, vandalism, or insurance claims at this property in the last 3 years? What carrier currently insures it and at what premium?
- The area grade is low — what's the realistic commute time and amenity access for the typical tenant pool here? Any planned neighborhood developments (good or bad) we should know about?
- What's the average days-on-market for RENTAL listings here right now (not sales)? A rising rental-DOM trend means longer vacancies and softer asking-rent achievability than the comps imply.
- What's the recent tenant-quality profile in this submarket — average credit score on applications, eviction rate, late-payment / NSF rate, and stable-employment percentage? A property-management company in the area should have these aggregated.
- How much new for-sale + rental construction is in the pipeline within 1–3 miles? Heavy new supply typically softens prices + rents 12–24 months out; constrained supply supports both.
Investment metrics
- 1% rule
- 0.96% ✗
- Cap rate
- 7.91%
- Cash-on-cash
- 5.76%
- DSCR
- 1.26
- GRM
- 8.7
CMA / ARV
- ARV (on-the-fly)
- $136,800
- Comps found
- 12
Show comp detail 12 sales within ~0.75 mi
| Address | Dist | Beds/Ba | Sqft | Sold | Price | $/sf | Match |
|---|---|---|---|---|---|---|---|
| 1120 E Ewing Ave | 0.23mi | 4/2.0 (+1) | 1,568 (+3%) | 1mo | $220,000 | $140 | 74 |
| 922 Milton St | 0.11mi | 3/1.5 | 1,344 (-12%) | 3mo | $60,000 | $45 | 71 |
| 1133 Milton St | 0.21mi | 3/1.0 | 1,344 (-12%) | 0mo | $85,000 | $63 | 71 |
| 626 E Dubail Ave | 0.35mi | 3/1.0 | 1,638 (+8%) | 2mo | $150,500 | $92 | 69 |
| 1112 E Fox St | 0.15mi | 3/1.0 | 1,300 (-14%) | 2mo | $148,500 | $114 | 67 |
| 2405 Miami St | 0.26mi | 4/1.0 (+1) | 1,664 (+10%) | 2mo | $121,300 | $73 | 66 |
| 822 E Ewing Ave | 0.21mi | 4/2.0 (+1) | 1,660 (+9%) | 1mo | $150,000 | $90 | 65 |
| 320 E Fox St | 0.48mi | 4/1.0 (+1) | 1,584 (+4%) | 1mo | $72,500 | $46 | 64 |
| 201 E Bowman St | 0.58mi | 3/2.0 | 1,456 (-4%) | 0mo | $51,000 | $35 | 62 |
| 1522 E Ewing Ave | 0.63mi | 3/1.5 | 1,411 (-7%) | 0mo | $220,000 | $156 | 56 |
| 1149 E Indiana Ave | 0.40mi | 4/1.5 (+1) | 1,344 (-12%) | 1mo | $90,000 | $67 | 54 |
| 2609 Rush St | 0.53mi | 3/1.0 | 1,332 (-12%) | 2mo | $166,000 | $125 | 53 |
Match score weights: distance 35% · size 25% · config 20% · recency 20%. Top-matched comps best support the ARV.
Projected returns pro-forma
-3.0% appreciation · 4.08% rent growth · sell at horizon
- IRR
- -6.3%
- Equity multiple
- 0.76×
- Total profit
- $-9,919
- Equity at exit
- $22,365
- IRR
- 4.5%
- Equity multiple
- 1.34×
- Total profit
- $14,364
- Equity at exit
- $12,969
Cash invested: $42,000 (down + closing). Projections, not guarantees.
Landlord ↔ Tenant lean methodology
- Overall (STATE)
- 90 Strongly Landlord-Friendly
- State Indiana
- 90 Strongly Landlord-Friendly · R+11
- County
- — inherits STATE
- City
- — inherits STATE
ZIP-level market 46613
- Home prices YoY
- -7.2%
- Rents YoY
- 4.1%
- Active inventory
- 78
- Price-to-rent
- 8.7×
Monthly cashflow live
- Estimated rent
- $1,438 high interval (Pro) →
- Mortgage (P&I)
- −$787
- Tax from tax record
- −$85 /mo · $1,017/yr
- Insurance
- −$62
- HOA
- −$0
- Vacancy / Maint / Mgmt
- −$302
- Net cashflow
- $202
Break-even live
Sensitivity live
| Price | -10% $287 | -5% $244 | +0% $202 | +5% $159 | +10% $117 |
|---|---|---|---|---|---|
| Rent | -10% $88 | -5% $145 | +0% $202 | +5% $259 | +10% $315 |
| Rate | -1.0pp $277 | -0.5pp $240 | base $202 | +0.5pp $163 | +1.0pp $123 |
UW: 25.0% down · 7.5% · 30yr · 1.5% tax · 5.0% vac · 8.0% maint · 8.0% mgmt
Financing live
Cash to close
- Down payment
- $37,500
- Closing costs
- $4,500
- Reserves months
- —
- Total cash needed
- —
Loan-product check · same deal, 3 products live
Conventional
25% down · 7.5% · 30yr
- Down + closing
- —
- Monthly P&I
- —
- Monthly cashflow
- —
- DSCR
- —
- Eligible?
- —
Personal DTI + credit; lowest rate.
DSCR
20% down · 8.5% · 30yr
- Down + closing
- —
- Monthly P&I
- —
- Monthly cashflow
- —
- DSCR
- —
- Eligible?
- —
No personal income docs; deal must DSCR.
Hard money
10% down · 12.0% · 12mo
- Down + closing
- —
- Monthly P&I
- —
- Monthly cashflow
- —
- DSCR
- —
- Eligible?
- —
Short-term bridge; refi at stabilization.
Rent comps 14 comps
| Address | Beds | Baths | Sqft | Rent | $/sqft | DOM | Units | Dist |
|---|---|---|---|---|---|---|---|---|
| 1912 Miami St Unit 1912 South Bend, IN | 3.0 | 1.5 | 1300 | $1,400 | $1.08 | 45d | 1 | 0.11mi |
| 909 E Fairview Ave South Bend, IN | 3.0 | 1.0 | 1128 | $1,450 | $1.29 | 45d | 1 | 0.32mi |
| 821 E Fairview Ave South Bend, IN | 3.0 | 1.0 | 1248 | $1,399 | $1.12 | 45d | 1 | 0.34mi |
| 1149 E Indiana Ave South Bend, IN | 4.0 | 2.0 | 1344 | $1,200 | $0.89 | 15d | 1 | 0.43mi |
| 1126 E Broadway St South Bend, IN | 4.0 | 2.0 | 1492 | $1,365 | $0.91 | 22d | 1 | 0.50mi |
| 525 E Eckman St South Bend, IN | 3.0 | 1.0 | 1400 | $1,500 | $1.07 | 45d | 1 | 0.58mi |
| 317 E Indiana Ave South Bend, IN | 3.0 | 1.0 | 1344 | $1,200 | $0.89 | 22d | 1 | 0.60mi |
| 114 Altgeld St South Bend, IN | 3.0 | 2.0 | 1680 | $1,399 | $0.83 | 45d | 1 | 0.71mi |
| 405 E Woodside St South Bend, IN | 3.0 | 1.0 | 1440 | $1,425 | $0.99 | 22d | 1 | 0.73mi |
| 1007 E Chippewa Ave South Bend, IN | 3.0 | 1.0 | 1344 | $1,399 | $1.04 | 45d | 1 | 1.03mi |
| 3406 Whitcomb Ave South Bend, IN | 4.0 | 3.0 | 1665 | $7,887 | $4.74 | 45d | 1 | 1.09mi |
| 1106 S 20th St South Bend, IN | 1.0–3.0 | 1.0–2.0 | 885 | $1,200 | $1.36 | 15d | 1 | 1.19mi |
| 2002 Catalpa Ave South Bend, IN | 3.0 | 1.0 | 1424 | $1,250 | $0.88 | 22d | 1 | 1.35mi |
| 416 E Chippewa Ave South Bend, IN | 4.0 | 2.0 | 1440 | $1,900 | $1.32 | 45d | 1 | 1.37mi |
Listing history 2 events
-
2026-05-10status Pending
-
2026-05-08$150,000 Active
ⓘ Source: listings_history table (triggers on properties + properties_extension) + one-shot
backfill from property_details.listing_events for pre-trigger history.
Tax reassessment forecast IN · Partial reset (capped growth)
- Current annual tax
- $1,017 · $85/mo
- Projected year-2 tax
- $1,146 · $96/mo
- Expected delta
- +$129/yr (+$11/mo · 12.7%)
ⓘ Screening estimate from a state-policy table — verify with the county assessor before closing.
Climate risk First Street
- Flood 1/10 Low FEMA zone X (unshaded) · 0% chance over 30 yrs
- Wildfire 1/10 Low
- Heat 2/10 Low 7 d/yr ≥99°F today · 16 d/yr by 30 yrs out
- Wind 2/10 Low
- Air quality 3/10 Moderate 2 unhealthy d/yr today · 3 by 30 yrs out
Nearby sold comps map
Loading sold comps map…
Walkable amenities ~0.75 mi
Loading nearby amenities…
Taxation est. · year 1
- Rental income
- $17,250
- − Mortgage interest
- −$8,402
- − Property taxes
- −$1,017
- − Insurance
- −$750
- − Repairs & maintenance
- −$1,380
- − Management
- −$1,380
- − Depreciation
- −$4,364
- Taxable loss
- −$43
- Est. tax savings @ 24.0%
- +$10
- After-tax cash flow
- $2,431/yr
For passive investors: Depreciation is non-cash, so a rental often shows a tax loss while cash-flowing — sheltering income. Rental losses are passive: they offset passive income freely, and up to $25,000/yr can offset ordinary (W-2) income if you actively participate and your MAGI is under $100k (phasing out to $0 by $150k); unused losses carry forward. On sale, claimed depreciation is recaptured at up to 25%, and gains may owe capital-gains tax (a 1031 exchange can defer both). Figures are a year-1 estimate at your 24.0% rate — not tax advice; consult a CPA.
Schools (NCES district)
- District
- South Bend Community School Corporation
- NCES district ID
- 1810290
- Math proficiency
- 12% ▼ -10.00%
- Reading proficiency
- 21% ▼ -6.00%
- Median HH income
- $41,935
- Composite
- 14.21/100
- National rank
- #9452
- State rank
- #284 of 301 in IN
Livability — South Bend
- Score
- 64/100
- State rank
- #365
- US rank
- #13730
Category grades
Schools grade is shown separately in the Schools card above.
Census & demographics
- Census place
- South Bend, IN
- County
- Saint Joseph County · 189,048 people
- City population
- 99,767
- Metro
- South Bend-Mishawaka, IN-MI
- Population (ZIP)
- 12,279
- Household income
- $42,537
- Rent vs Own
- Severe rent burden
- 545.0
Population outlook (St. Joseph County) Hauer SSP2
- Today (2025)
- 273,186 people
- By 2030
- 273,594 · +0.1%
- By 2040
- 271,641 · -0.6%
- By 2050
- 269,187 · -1.5%
- By 2075
- 263,136 · -3.7%
- By 2100
- 245,659 · -10.1%
Race, ethnicity, and origin ACS 2023
- Neighborhood character
- Highly diverse neighborhood (Simpson 0.72)
- Race & ethnicity
- White 41% Hispanic / Latino 24% Black 23% Two or more races 22% Asian 2% Native American 1%
- Hispanic origin (detail)
- Mexican 22%
- Common ancestry
- Romanian 4% Italian 1% Slovak 1%
- Foreign-born
- 9% · Canada, Philippines
- Languages at home
- 81% English-only · Spanish 17% Other Asian/Pacific 1%
Political lean MEDSL · St. Joseph
- 2024 margin
- Toss-up / Even · D 50.0% · R 48.5% · Other 1.5%
- 2008→2024 swing
- -15.6pp toward R · 2008: 17.1pp · 2024: 1.5pp
- All cycles
- 2024: D+1.5 2020: D+5.8 2016: D+0.2 2012: D+3.5 2008: D+17.1
Not yet ingested
- Civics
- —
Market trends
- HPI YoY
- ▼ -20.88%
- Current HPI
- 270.0303
- Rent YoY
- ▲ 4.08%
- Metro
- South Bend-Mishawaka, IN-MI
- State GDP YoY
- ▲ 2.90%
- F500 in state
- 18
Industry mix (Fortune 500 HQ in IN)
| Industry | F500 HQs | Revenue |
|---|---|---|
| Industrial Machinery | 2 | $37B |
|
||
| Healthcare | 1 | $177B |
|
||
| Pharmaceuticals | 1 | $45B |
|
||
| Metals / Steel | 1 | $18B |
|
||
| Agriculture | 1 | $17B |
|
||
| Packaging | 1 | $12B |
|
||
Price history
2 events — show timeline
- 2026-05-10 Pending — IRMLS
- 2026-05-08 Listed $150,000 IRMLS
Property tax history
-14.3%/yrLatest (2023): $1,017 · +10.3% YoY. Source: county tax records.
Cash-flow waterfall
monthlySold comps — $/sqft
last 12 mo · ≤1 miLoading sold comps…