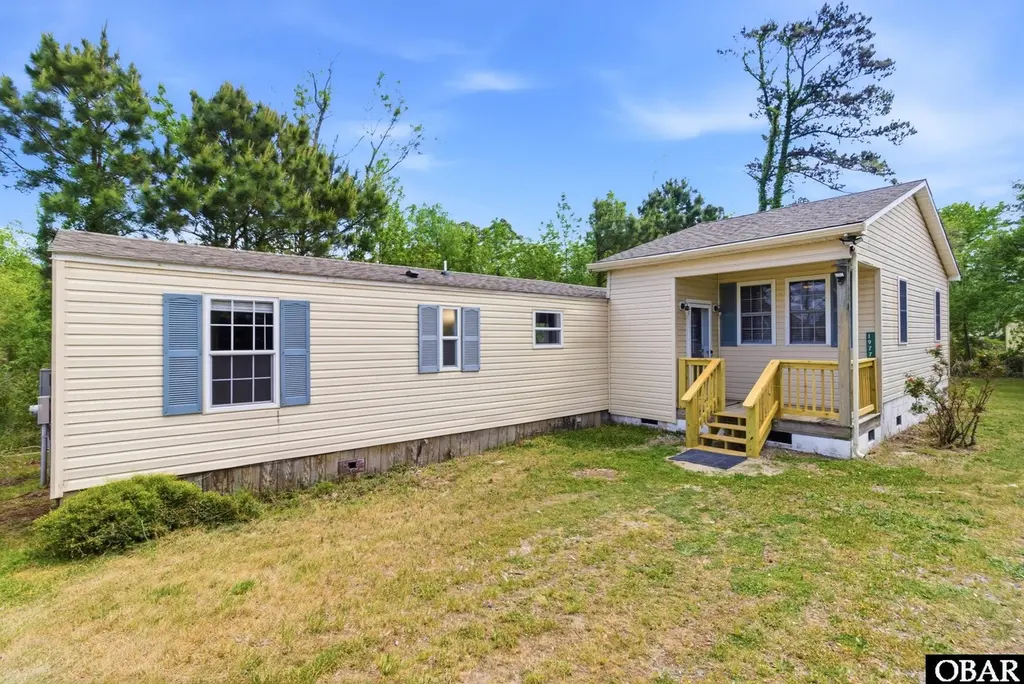
1977 Colington Rd Lot PTN 2 · Kill Devil Hills, NC
Flood risk 10/10 · Severe
- FEMA flood zone
- X (shaded)
- Chance of flooding over 30 yrs
- 0.99%
- Est. flood insurance / yr
- $507 – $1,088
Fire risk 2/10 · Minimal
- Est. fire insurance / yr
- $906 – $1,684
Heat risk 8/10 · Major
- Hot days now (above 101°F)
- 7 days/yr
- Hot days in 30 yrs
- 19 days/yr
Wind risk 9/10 · Severe
- Chance of severe wind over 30 yrs
- 99.0%
Air-quality risk 1/10 · Minimal
- Unhealthy air days now
- 0 days/yr
- Unhealthy air days in 30 yrs
- 0 days/yr
Risk factors via First Street. Map © Google.
Why this score? — see what drove the D+ grade
The composite is a weighted blend of 9 inputs, each scored 0–100. Each bar is that input's sub-score; the figure is the points it added to the 100-point composite (weight × sub-score).
- Cash flow +20.3/30.0
- DSCR +6.4/10.0
- 1% rule +5.4/10.0
- Schools +4.0/10.0
- Condition / age +4.0/5.0
- Livability +3.4/5.0
- Rent growth +2.5/5.0
- ARV discount +2.4/15.0
- Appreciation +0.0/10.0
$269,000
🖨 Deal sheet 📄 Offer letter ✓ Due diligence
Listing remarks
If you’ve been waiting for something affordable that doesn’t feel like a total project, this might be your spot. This 3 bedroom, 1.5 bath home started life as a single-wide, but don’t let that scare you off. .. it’s had a solid glow-up. With an addition for extra space and a series of recent upgrades including a new roof, HVAC, appliances, and flooring, much of the heavy lifting has already been done. Inside, you’ll find a clean, refreshed interior that’s move-in ready, whether you’re looking for employee housing, a primary residence, or a practical investment property. It’s not pretending to be something it’s not… but it is a com
Key facts
- Hvac
- Appliances
- Flooring
Tags
Property features AI
Finance
- HOA & community: Community park; Community playground
Exterior
- Parking: Off-street unpaved parking
- Utilities: Public water; Septic tank sewer
- Home design: Single-family residence; Residential property; Located in Colington Hrbr subdivision; Zoned R-2
- Exterior features: Outdoor pool; Asphalt roof
Interior
- Kitchen: Range; Oven; Dishwasher; Refrigerator
- Bathrooms: One full bathroom; One half bathroom; One partial bathroom
- Interior features: Central air conditioning; Central electric heating
Neighborhood map
What this means for you Summary
Snapshot
- This is a 3-bed/1.5-bath manufactured listed at $269k. Condition is rated good.
Deal economics
- At list price, monthly cash flow is $279 ($3k/yr) — positive.
- The deal already cash-flows at list — no discount required.
- Meets the 1% rule at list price ($3k rent vs $269k).
- Recommended offer: $261k (3.0% below list) — sets the bar for market timing.
- Cap rate 7.8% vs local median 1.6% in Kill Devil Hills — top-decile yield for the area; either an underpriced asset or a hidden risk that comps aren't pricing in. Stress-test before assuming the spread holds.
Location & tenants
- Location reads 67/100 on livability (#222 in NC) — a middle-class / working-renter tenant base. Strengths: housing A, health & safety B+, crime B; Watch: employment C-, amenities F, commute F.
- Dare County Schools (town): math 44% / reading 48% proficiency, ranked #77 of 178 in NC (top 43%) — families likely to look elsewhere, expect single-tenant / working-renter base with shorter leases.
- Market conditions: 196 active listings in the ZIP; 1 comparable units currently listed for rent nearby; 371 units permitted in Dare County in 2024 (0 in 5+ unit buildings).
Forward outlook
- Local home prices are declining (-3.0%/yr); year-one equity from $2k of loan paydown is wiped out by about $8k of value loss. Plan a longer hold.
- Dare County population projected at +14% by 2050 — modest demand growth; plan on rents tracking national, not racing it.
Negotiation context
- It's been on market 60 days — a 3% lower offer ($261k) is reasonable based on typical stale-listing flexibility.
Risks & watch-outs
- Watch-outs: flood insurance adds $66/mo.
- Climate carrying-cost: severe flood risk; severe wind risk, 99% chance of damaging wind over 30y; extreme-heat days projected 7→19/yr by 2055 (HVAC capex compounding) — expect insurance premiums to compound above CPI over the hold.
Questions for the listing agent
- It's been on market 60 days. Have you received any prior offers? Is the seller open to a 3% concession, seller financing, or rate buy-down credit?
- What's the actual annual flood-insurance premium (NFIP or private), and is the property in a SFHA with mandatory coverage?
- Is there a deadline driving the sale (1031 exchange, divorce, estate, relocation)? That informs how much negotiation room exists.
- The area grade is low — what's the realistic commute time and amenity access for the typical tenant pool here? Any planned neighborhood developments (good or bad) we should know about?
- What's the average days-on-market for RENTAL listings here right now (not sales)? A rising rental-DOM trend means longer vacancies and softer asking-rent achievability than the comps imply.
- What's the recent tenant-quality profile in this submarket — average credit score on applications, eviction rate, late-payment / NSF rate, and stable-employment percentage? A property-management company in the area should have these aggregated.
- How much new for-sale + rental construction is in the pipeline within 1–3 miles? Heavy new supply typically softens prices + rents 12–24 months out; constrained supply supports both.
Investment metrics
- 1% rule
- 1.04% ✓
- Cap rate
- 7.83%
- Cash-on-cash
- 5.50%
- DSCR
- 1.24
- GRM
- 8.0
CMA / ARV
- ARV (on-the-fly)
- $241,728
- Comps found
- 1
Show comp detail 1 sale within ~0.75 mi
| Address | Dist | Beds/Ba | Sqft | Sold | Price | $/sf | Match |
|---|---|---|---|---|---|---|---|
| 133 Williams Dr Lot 2 | 0.09mi | 3/2.0 | 1,385 (+10%) | 20mo | $266,500 | $192 | 61 |
Match score weights: distance 35% · size 25% · config 20% · recency 20%. Top-matched comps best support the ARV.
Projected returns pro-forma
-3.0% appreciation · 3.0% rent growth · sell at horizon
- IRR
- -9.3%
- Equity multiple
- 0.66×
- Total profit
- $-25,760
- Equity at exit
- $40,109
- IRR
- 0.1%
- Equity multiple
- 1.01×
- Total profit
- $758
- Equity at exit
- $23,258
Cash invested: $75,320 (down + closing). Projections, not guarantees.
Landlord ↔ Tenant lean methodology
- Overall (STATE)
- 85 Strongly Landlord-Friendly
- State North Carolina
- 85 Strongly Landlord-Friendly · R+3
- County
- — inherits STATE
- City
- — inherits STATE
ZIP-level market 27948
- Home prices YoY
- -1.9%
- Active inventory
- 196
- Price-to-rent
- 8.0×
Monthly cashflow live
- Estimated rent
- $2,790 medium interval (Pro) →
- Mortgage (P&I)
- −$1,411
- Tax est. 1.5%
- −$336 /mo · $4,035/yr
- Insurance
- −$112
- Flood insurance flood zone
- −$66 /mo · $798/yr
- HOA
- −$0
- Vacancy / Maint / Mgmt
- −$586
- Net cashflow
- $279
Break-even live
UW: 25.0% down · 7.5% · 30yr · 1.5% tax · 5.0% vac · 8.0% maint · 8.0% mgmt
Financing live
Cash to close
- Down payment
- $67,250
- Closing costs
- $8,070
- Reserves months
- —
- Total cash needed
- —
Loan-product check · same deal, 3 products live
Conventional
25% down · 7.5% · 30yr
- Down + closing
- —
- Monthly P&I
- —
- Monthly cashflow
- —
- DSCR
- —
- Eligible?
- —
Personal DTI + credit; lowest rate.
DSCR
20% down · 8.5% · 30yr
- Down + closing
- —
- Monthly P&I
- —
- Monthly cashflow
- —
- DSCR
- —
- Eligible?
- —
No personal income docs; deal must DSCR.
Hard money
10% down · 12.0% · 12mo
- Down + closing
- —
- Monthly P&I
- —
- Monthly cashflow
- —
- DSCR
- —
- Eligible?
- —
Short-term bridge; refi at stabilization.
Rent comps 1 comps
| Address | Beds | Baths | Sqft | Rent | $/sqft | DOM | Units | Dist |
|---|---|---|---|---|---|---|---|---|
| 100 Lexington Ln Unit 106D Kill Devil Hills, NC | 3.0 | 3.0 | 1321 | $2,790 | $2.11 | 4d | 1 | 0.57mi |
Listing history 15 events
-
2026-06-18days on market $269,000 Active 60 DOM
-
2026-06-17days on market $269,000 Active 59 DOM
-
2026-06-16days on market $269,000 Active 58 DOM
-
2026-06-15days on market $269,000 Active 57 DOM
-
2026-06-13days on market $269,000 Active 55 DOM
-
2026-06-12days on market $269,000 Active 54 DOM
-
2026-06-09pricedays on market $269,000 Active 51 DOM
-
2026-06-08days on market $275,000 Active 50 DOM
-
2026-06-07days on market $275,000 Active 49 DOM
-
2026-06-07days on market $275,000 Active 48 DOM
-
2026-06-04days on market $275,000 Active 45 DOM
-
2026-06-02days on market $275,000 Active 44 DOM
-
2026-06-01days on market $275,000 Active 43 DOM
-
2026-05-31days on market $275,000 Active 42 DOM
-
2026-04-19$275,000 Active
ⓘ Source: listings_history table (triggers on properties + properties_extension) + one-shot
backfill from property_details.listing_events for pre-trigger history.
Climate risk First Street
- Flood 10/10 Extreme FEMA zone X (shaded) · 99% chance over 30 yrs
- Wildfire 2/10 Low
- Heat 8/10 Severe 7 d/yr ≥101°F today · 19 d/yr by 30 yrs out
- Wind 9/10 Extreme 99% chance of damaging wind over 30 yrs
- Air quality 1/10 Low 0 unhealthy d/yr today · 0 by 30 yrs out
Nearby sold comps map
Loading sold comps map…
Walkable amenities ~0.75 mi
Loading nearby amenities…
Taxation est. · year 1
- Rental income
- $33,480
- − Mortgage interest
- −$15,068
- − Property taxes
- −$4,035
- − Insurance
- −$2,142
- − Repairs & maintenance
- −$2,678
- − Management
- −$2,678
- − Depreciation
- −$7,825
- Taxable loss
- −$948
- Est. tax savings @ 24.0%
- +$228
- After-tax cash flow
- $3,571/yr
For passive investors: Depreciation is non-cash, so a rental often shows a tax loss while cash-flowing — sheltering income. Rental losses are passive: they offset passive income freely, and up to $25,000/yr can offset ordinary (W-2) income if you actively participate and your MAGI is under $100k (phasing out to $0 by $150k); unused losses carry forward. On sale, claimed depreciation is recaptured at up to 25%, and gains may owe capital-gains tax (a 1031 exchange can defer both). Figures are a year-1 estimate at your 24.0% rate — not tax advice; consult a CPA.
Condition & rehab AI · 1 photo
This 1977 single-wide home has undergone significant renovations, including a new roof, HVAC, appliances, and flooring, making it move-in ready. It offers a good investment opportunity with potential for further value enhancement through exterior painting and landscaping.
Value-add opportunities
- Both Painting the exterior — Enhances curb appeal and value
- Both Landscaping the front yard — Improves curb appeal and enhances property value
- Both Reorganizing the interior for better flow — Enhances functionality and appeal
Renovation cost estimate screening
Value-add ROI direction
- Both Painting the exterior — Enhances curb appeal and value ↑
- Both Landscaping the front yard — Improves curb appeal and enhances property value ↑
- Both Reorganizing the interior for better flow — Enhances functionality and appeal ↑
ⓘ Cost ranges are severity-bucket heuristics (US national rule-of-thumb). Get contractor quotes + a written scope before underwriting a rehab budget.
Schools (NCES district)
- District
- Dare County Schools
- NCES district ID
- 3701110
- Math proficiency
- 44% ▼ -4.00%
- Reading proficiency
- 48% ▼ -7.00%
- Median HH income
- $54,233
- Composite
- 39.86/100
- National rank
- #3866
- State rank
- #77 of 178 in NC
Livability — Kill Devil Hills
- Score
- 67/100
- State rank
- #222
- US rank
- #10501
Category grades
Schools grade is shown separately in the Schools card above.
Census & demographics
- Population (ZIP)
- 12,628
Population outlook (Dare County) Hauer SSP2
- Today (2025)
- 39,201 people
- By 2030
- 40,756 · +4.0%
- By 2040
- 43,015 · +9.7%
- By 2050
- 44,477 · +13.5%
- By 2075
- 48,522 · +23.8%
- By 2100
- 50,980 · +30.0%
Race, ethnicity, and origin ACS 2023
- Neighborhood character
- Predominantly White (86%)
- Race & ethnicity
- White 86% Hispanic / Latino 9% Two or more races 8%
- Hispanic origin (detail)
- Mexican 4% Puerto Rican 1%
- Common ancestry
- Lithuanian 5% Slovak 2% Romanian 2%
- Foreign-born
- 5% · Canada, China
- Languages at home
- 90% English-only · Spanish 6% French/Haitian/Cajun 1% Other Indo-European 1%
Political lean MEDSL · Dare
- 2024 margin
- R (+18.8) · D 40.1% · R 58.9%
- 2008→2024 swing
- -9.5pp toward R · 2008: -9.2pp · 2024: -18.8pp
- All cycles
- 2024: R+18.8 2020: R+16.5 2016: R+22.1 2012: R+16.1 2008: R+9.2
Not yet ingested
- Civics
- —
Market trends
- HPI YoY
- ▼ -14.01%
- Current HPI
- 731.56
- Rent YoY
- —
- Metro
- —
- State GDP YoY
- ▲ 3.28%
- F500 in state
- 26
Industry mix (Fortune 500 HQ in NC)
| Industry | F500 HQs | Revenue |
|---|---|---|
| Financial Services | 2 | $213B |
|
||
| Retail | 2 | $95B |
|
||
| Industrial Conglomerate | 1 | $38B |
|
||
| Metals / Steel | 1 | $35B |
|
||
| Utilities | 1 | $30B |
|
||
| Industrial Machinery | 1 | $19B |
|
||
Price history
1 event — show timeline
- 2026-04-19 Listed $275,000 OBMLS
Cash-flow waterfall
monthlySold comps — $/sqft
last 12 mo · ≤1 miLoading sold comps…