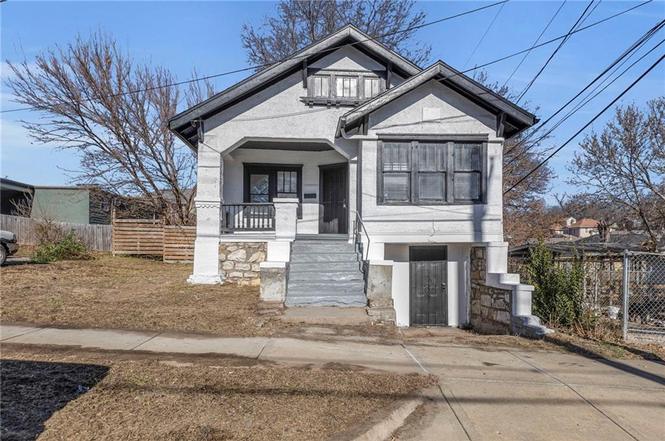
1406 E 45th St · Kansas City, MO
Flood risk 3/10 · Minor
- FEMA flood zone
- X (unshaded)
- Chance of flooding over 30 yrs
- 0.2%
- Est. flood insurance / yr
- $473 – $860
Fire risk 1/10 · Minimal
- Est. fire insurance / yr
- $1,054 – $1,958
Heat risk 4/10 · Minor
- Hot days now (above 106°F)
- 7 days/yr
- Hot days in 30 yrs
- 17 days/yr
Wind risk 2/10 · Minimal
- Chance of severe wind over 30 yrs
- —
Air-quality risk 3/10 · Minor
- Unhealthy air days now
- 2 days/yr
- Unhealthy air days in 30 yrs
- 4 days/yr
Risk factors via First Street. Map © Google.
Why this score? — see what drove the C- grade
The composite is a weighted blend of 9 inputs, each scored 0–100. Each bar is that input's sub-score; the figure is the points it added to the 100-point composite (weight × sub-score).
- Cash flow +22.5/30.0
- ARV discount +7.5/15.0
- DSCR +7.2/10.0
- 1% rule +4.7/10.0
- Livability +3.9/5.0
- Rent growth +3.5/5.0
- Condition / age +2.5/5.0
- Schools +1.5/10.0
- Appreciation +0.0/10.0
$129,000
🖨 Deal sheet 📄 Offer letter ✓ Due diligence
Listing remarks
MOVE-IN READY RAISED RANCH! Fresh paint inside and out welcomes you home. Relax on the covered front porch—the perfect spot to enjoy your favorite beverage. Inside, find beautiful hardwood floors throughout and an updated, light and bright kitchen opened to the dining area, featuring stainless steel appliances and a convenient eat-in bar. The main level offers three comfortable bedrooms and an updated full bath. Basement provides ample space for storage or future finishing possibilities. Ideally located just minutes from the Plaza with easy access to dining, shopping, parks and major highways. Perfect as a primary residence or investment opportunity—don’t miss this one!
Key facts
- Covered front porch
- Updated full bath
- Eat-in bar
Tags
Neighborhood map
What this means for you Summary
Snapshot
- This is a 2-bed/1.0-bath single-family listed at $129k.
Deal economics
- At list price, monthly cash flow is $217 ($3k/yr) — positive.
- The deal already cash-flows at list — no discount required.
- To meet the 1% rule (rent ≥ 1% of price), the offer needs to be $125k (2.7% below list).
- Recommended offer: $117k (9.0% below list) — sets the bar for market timing.
- Cap rate 8.3% vs local median 3.9% in Kansas City — top-decile yield for the area; either an underpriced asset or a hidden risk that comps aren't pricing in. Stress-test before assuming the spread holds.
Location & tenants
- Location reads 78/100 on livability (#28 in MO, #2,671 nationally) — a middle-class / working-renter tenant base. Strengths: amenities A+, commute A+, cost of living A+; Watch: schools C-, crime F.
- Kansas City 33 (urban): math 12% / reading 24% proficiency, ranked #308 of 324 in MO (top 95%) — low school quality limits family demand, transient renter base, plan for 1-2y turnover; 75% free/reduced lunch — lower-income household profile, screen leases tightly.
- Market conditions: Rents rising (+4.0%/yr); tight market (median 1 DOM); 125 active listings in the ZIP; 40 comparable units currently listed for rent nearby; rentals at typical pace (median 17d on market — plan ~3-4 weeks tenant-placement turnaround); 4,002 units permitted in Jackson County in 2024 (2,271 in 5+ unit buildings).
Forward outlook
- Local home prices are declining (-3.0%/yr); year-one equity from $892 of loan paydown is wiped out by about $4k of value loss. Plan a longer hold.
- Jackson County population projected at +4% by 2050 — modest demand growth; plan on rents tracking national, not racing it.
Negotiation context
- It's been on market 91 days — a 9% lower offer ($117k) is reasonable based on typical stale-listing flexibility.
- 10 sale attempts since 19y ago with the ask held roughly flat each time — persistent listings suggest the price (not the market) is what's stuck; bring a comps-based counter.
Risks & watch-outs
- Watch-outs: built in 1922 — expect roof / HVAC / electrical / plumbing capex.
Questions for the listing agent
- It's been on market 91 days. Have you received any prior offers? Is the seller open to a 9% concession, seller financing, or rate buy-down credit?
- Built in 1922 — when were the roof, HVAC, electrical panel, plumbing, and water heater last replaced?
- Why hasn't it sold? Are there any deal-killer items the seller is aware of (foundation, flood, title, zoning, code violations)?
- Is there a deadline driving the sale (1031 exchange, divorce, estate, relocation)? That informs how much negotiation room exists.
- Crime grade is F in this area — have there been break-ins, vandalism, or insurance claims at this property in the last 3 years? What carrier currently insures it and at what premium?
- What's the average days-on-market for RENTAL listings here right now (not sales)? A rising rental-DOM trend means longer vacancies and softer asking-rent achievability than the comps imply.
- What's the recent tenant-quality profile in this submarket — average credit score on applications, eviction rate, late-payment / NSF rate, and stable-employment percentage? A property-management company in the area should have these aggregated.
- How much new for-sale + rental construction is in the pipeline within 1–3 miles? Heavy new supply typically softens prices + rents 12–24 months out; constrained supply supports both.
Investment metrics
- 1% rule
- 0.97% ✗
- Cap rate
- 8.31%
- Cash-on-cash
- 7.21%
- DSCR
- 1.32
- GRM
- 8.6
CMA / ARV
- ARV (on-the-fly)
- $128,992
- Comps found
- 12
Show comp detail 12 sales within ~0.75 mi
| Address | Dist | Beds/Ba | Sqft | Sold | Price | $/sf | Match |
|---|---|---|---|---|---|---|---|
| 1406 E 45th St | 0.00mi | 3/1.0 (+1) | 928 (0%) | 0mo | $129,000 | $139 | 95 |
| 4314 Paseo Blvd | 0.20mi | 3/2.0 (+1) | 908 (-2%) | 7mo | $109,500 | $121 | 72 |
| 4304 Holmes St | 0.59mi | 2/1.0 | 928 (0%) | 1mo | $220,000 | $237 | 72 |
| 4139 Flora Ave | 0.39mi | 2/1.0 | 894 (-4%) | 8mo | $79,900 | $89 | 69 |
| 1508 E 49th Ter | 0.57mi | 2/1.0 | 916 (-1%) | 4mo | $90,000 | $98 | 68 |
| 2303 E 41st St E | 0.72mi | 2/1.0 | 918 (-1%) | 4mo | $80,000 | $87 | 61 |
| 4144 Flora Ave | 0.38mi | 2/1.0 | 851 (-8%) | 9mo | $109,000 | $128 | 61 |
| 5001 Troostwood Rd | 0.68mi | 2/1.0 | 901 (-3%) | 3mo | $253,000 | $281 | 61 |
| 1537 E 50th St | 0.66mi | 2/1.0 | 910 (-2%) | 7mo | $110,000 | $121 | 60 |
| 4432 Forest Ave | 0.23mi | 2/2.0 | 1,058 (+14%) | 5mo | $165,000 | $156 | 58 |
| 4119 Holmes St | 0.68mi | 2/1.0 | 1,060 (+14%) | 5mo | $269,000 | $254 | 41 |
| 620 E 42nd St | 0.66mi | 2/2.0 | 1,054 (+14%) | 8mo | $310,000 | $294 | 36 |
Match score weights: distance 35% · size 25% · config 20% · recency 20%. Top-matched comps best support the ARV.
Projected returns pro-forma
-3.0% appreciation · 3.95% rent growth · sell at horizon
- IRR
- -4.3%
- Equity multiple
- 0.84×
- Total profit
- $-5,923
- Equity at exit
- $19,234
- IRR
- 6.3%
- Equity multiple
- 1.48×
- Total profit
- $17,489
- Equity at exit
- $11,154
Cash invested: $36,120 (down + closing). Projections, not guarantees.
Landlord ↔ Tenant lean methodology
- Overall (STATE)
- 81 Strongly Landlord-Friendly
- State Missouri
- 81 Strongly Landlord-Friendly · R+10
- County
- — inherits STATE
- City
- — inherits STATE
ZIP-level market 64110
- Rents YoY
- 4.0%
- Median DOM (111 sales)
- 1 d
- Active inventory
- 125
- Price-to-rent
- 8.6×
Monthly cashflow live
- Estimated rent
- $1,255 high interval (Pro) →
- Mortgage (P&I)
- −$676
- Tax from tax record
- −$44 /mo · $527/yr
- Insurance
- −$54
- HOA
- −$0
- Vacancy / Maint / Mgmt
- −$263
- Net cashflow
- $217
Break-even live
Sensitivity live
| Price | -10% $290 | -5% $254 | +0% $217 | +5% $181 | +10% $144 |
|---|---|---|---|---|---|
| Rent | -10% $118 | -5% $167 | +0% $217 | +5% $267 | +10% $316 |
| Rate | -1.0pp $282 | -0.5pp $250 | base $217 | +0.5pp $184 | +1.0pp $150 |
UW: 25.0% down · 7.5% · 30yr · 1.5% tax · 5.0% vac · 8.0% maint · 8.0% mgmt
Financing live
Cash to close
- Down payment
- $32,250
- Closing costs
- $3,870
- Reserves months
- —
- Total cash needed
- —
Loan-product check · same deal, 3 products live
Conventional
25% down · 7.5% · 30yr
- Down + closing
- —
- Monthly P&I
- —
- Monthly cashflow
- —
- DSCR
- —
- Eligible?
- —
Personal DTI + credit; lowest rate.
DSCR
20% down · 8.5% · 30yr
- Down + closing
- —
- Monthly P&I
- —
- Monthly cashflow
- —
- DSCR
- —
- Eligible?
- —
No personal income docs; deal must DSCR.
Hard money
10% down · 12.0% · 12mo
- Down + closing
- —
- Monthly P&I
- —
- Monthly cashflow
- —
- DSCR
- —
- Eligible?
- —
Short-term bridge; refi at stabilization.
Rent comps 40 comps
| Address | Beds | Baths | Sqft | Rent | $/sqft | DOM | Units | Dist |
|---|---|---|---|---|---|---|---|---|
| 1500 E 46th St Kansas City, MO | 1.0–3.0 | 1.0 | 803 | $1,050 | $1.31 | 44d | 1 | 0.13mi |
| 1214 Brush Creek Blvd Unit 03 Kansas City, MO | 2.0 | 1.0 | 950 | $1,050 | $1.11 | 17d | 1 | 0.17mi |
| 4401 Wayne Ave Kansas City, MO | 2.0 | 1.5 | 955 | $1,300 | $1.36 | 24d | 1 | 0.18mi |
| 4232 Virginia Ave Unit 1 Kansas City, MO | 1.0 | 1.0 | 592 | $750 | $1.27 | 20d | 1 | 0.31mi |
| 4209 Flora Ave Kansas City, MO | 2.0 | 1.0 | 778 | $1,200 | $1.54 | 16d | 1 | 0.36mi |
| 4818 Paseo Blvd Unit 1W Kansas City, MO | 1.0 | 1.0 | 526 | $945 | $1.80 | 24d | 1 | 0.44mi |
| 4818 Paseo Blvd Kansas City, MO | 1.0 | 1.0 | 526 | $945 | $1.80 | 4d | 8 | 0.46mi |
| 4818 Paseo Blvd Kansas City, MO | 1.0 | 1.0 | 526 | $945 | $1.80 | 11d | 10 | 0.46mi |
| 4818 The Paseo Unit 3S Kansas City, MO | 1.0 | 1.0 | 526 | $895 | $1.70 | 24d | 1 | 0.47mi |
| 4818 The Paseo Unit 2N Kansas City, MO | 1.0 | 1.0 | 526 | $995 | $1.89 | 24d | 1 | 0.47mi |
| 4818 The Paseo Unit 2N Kansas City, MO | 1.0 | 1.0 | 526 | $945 | $1.80 | 16d | 1 | 0.47mi |
| 820 E 43rd St Kansas City, MO | 2.0 | 1.0 | 900 | $985 | $1.09 | 17d | 1 | 0.48mi |
| 1320 E 49th St Kansas City, MO | 1.0 | 1.0 | 550 | $1,000 | $1.82 | 3d | 2 | 0.48mi |
| 4119 Forest Ave Kansas City, MO | 2.0 | 1.0 | 950 | $1,400 | $1.47 | 13d | 1 | 0.49mi |
| 4154 Harrison St Kansas City, MO | 2.0 | 1.0 | 1100 | $1,395 | $1.27 | 44d | 1 | 0.51mi |
| 815 E 42nd St Unit 815-3W Kansas City, MO | 1.0 | 1.0 | 650 | $1,050 | $1.62 | 8d | 1 | 0.55mi |
| 817 E 42nd St Kansas City, MO | 1.0 | 1.0 | 650 | $1,050 | $1.62 | 4d | 1 | 0.55mi |
| 809 E 42nd St Unit 809-3W Kansas City, MO | 1.0 | 1.0 | 650 | $1,050 | $1.62 | 44d | 1 | 0.56mi |
| 4925 Tracy Ave Unit 1 Kansas City, MO | 2.0 | 1.0 | 1000 | $1,400 | $1.40 | 44d | 1 | 0.57mi |
| 801 E 42nd St Unit 3E Kansas City, MO | 1.0 | 1.0 | 700 | $965 | $1.38 | 4d | 1 | 0.57mi |
| 4023 Harrison St Unit 4021-2N Kansas City, MO | 2.0 | 1.0 | 850 | $1,295 | $1.52 | 24d | 1 | 0.65mi |
| 4023 Harrison St Unit 40232-S Kansas City, MO | 2.0 | 1.0 | 850 | $1,250 | $1.47 | 24d | 1 | 0.65mi |
| 607 E 42nd St Kansas City, MO | 1.0–2.0 | 1.0 | 625 | $1,150 | $1.84 | 4d | 3 | 0.66mi |
| 4201 Kenwood Ave Kansas City, MO | 2.0 | 1.0 | 750 | $919 | $1.23 | 21d | 2 | 0.67mi |
| 4013 Charlotte St Unit 1N Kansas City, MO | 2.0 | 1.0 | 900 | $1,200 | $1.33 | 24d | 1 | 0.73mi |
| 2305 E 41st St Kansas City, MO | 2.0 | 1.0 | 750 | $1,000 | $1.33 | 8d | 1 | 0.76mi |
| 4228 Locust St Kansas City, MO | 1.0 | 1.0 | 700 | $1,095 | $1.56 | 8d | 1 | 0.78mi |
| 4930 Park Ave Kansas City, MO | 3.0 | 1.0 | 900 | $1,300 | $1.44 | 16d | 1 | 0.79mi |
| 3933 Charlotte St Kansas City, MO | 1.0 | 1.0 | 575 | $875 | $1.52 | 21d | 1 | 0.80mi |
| 406 E 43rd St Unit 3E Kansas City, MO | 2.0 | 1.0 | 1100 | $1,675 | $1.52 | 44d | 1 | 0.80mi |
| 4308 Oak St Kansas City, MO | 2.0 | 1.0 | 531 | $1,600 | $3.01 | 3d | 1 | 0.80mi |
| 319 E 43rd St Unit 1 Kansas City, MO | 2.0 | 1.0 | 1100 | $1,470 | $1.34 | 15d | 1 | 0.81mi |
| 918 E 39th St Kansas City, MO | 2.0 | 1.0 | 1050 | $1,175 | $1.12 | 44d | 1 | 0.83mi |
| 4800 Oak St Kansas City, MO | 1.0–3.0 | 1.0–2.0 | 967 | $1,940 | $2.00 | 2d | 18 | 0.86mi |
| 303 Brush Creek Blvd Kansas City, MO | 1.0 | 1.0 | 575 | $950 | $1.65 | 44d | 6 | 0.86mi |
| 4550 Warwick Blvd #909 Kansas City, MO | 1.0 | 1.0 | 1000 | $1,700 | $1.70 | 4d | 1 | 0.87mi |
| 3933 Kenwood Ave Kansas City, MO | 2.0 | 2.0 | 1050 | $2,295 | $2.19 | 4d | 1 | 0.87mi |
| 4515 Walnut St Kansas City, MO | 1.0–2.0 | 1.0–2.0 | 780 | $2,055 | $2.63 | 2d | 12 | 0.89mi |
| 4534 S Benton Ave Kansas City, MO | 2.0 | 1.0 | 912 | $1,045 | $1.15 | 16d | 1 | 0.91mi |
| 3909 Kenwood Ave #1 Kansas City, MO | 2.0 | 1.0 | 875 | $1,295 | $1.48 | 8d | 1 | 0.91mi |
Listing history 31 events
-
2026-04-23status Pending
-
2026-01-22$129,000 Active
-
2025-10-30historical
-
2025-09-10status Active
-
2025-08-25status Pending
-
2025-06-11price $139,000
-
2025-04-25price $144,000
-
2025-03-07$149,000 Active
-
2025-03-07historical
-
2024-12-05$149,000 Active
-
2024-08-02historical
-
2024-05-22$155,000 Active
-
2017-02-22soldstatus
-
2017-02-15soldstatus Sold
-
2017-01-28status Pending
-
2016-10-07$35,000 Active
-
2015-09-08soldstatus
-
2015-05-04$30,000
-
2014-04-11soldstatus
-
2014-04-11soldstatus
-
2014-04-10soldstatus
-
2014-03-10$16,500
-
2013-04-08soldstatus
-
2010-05-17historical
-
2010-04-05$39,000
-
2007-12-03soldstatus
-
2007-10-26soldstatus
-
2007-03-10$19,900
-
2004-10-01soldstatus
-
1997-08-18soldstatus
-
1995-10-12soldstatus
ⓘ Source: listings_history table (triggers on properties + properties_extension) + one-shot
backfill from property_details.listing_events for pre-trigger history.
Tax reassessment forecast MO · Resets to sale price
- Current annual tax
- $527 · $44/mo
- Projected year-2 tax
- $1,251 · $104/mo
- Expected delta
- +$724/yr (+$60/mo · 137.5%)
ⓘ Screening estimate from a state-policy table — verify with the county assessor before closing.
Climate risk First Street
- Flood 3/10 Moderate FEMA zone X (unshaded) · 20% chance over 30 yrs
- Wildfire 1/10 Low
- Heat 4/10 Moderate 7 d/yr ≥106°F today · 17 d/yr by 30 yrs out
- Wind 2/10 Low
- Air quality 3/10 Moderate 2 unhealthy d/yr today · 4 by 30 yrs out
Nearby sold comps map
Loading sold comps map…
Walkable amenities ~0.75 mi
Loading nearby amenities…
Taxation est. · year 1
- Rental income
- $15,056
- − Mortgage interest
- −$7,226
- − Property taxes
- −$527
- − Insurance
- −$645
- − Repairs & maintenance
- −$1,204
- − Management
- −$1,204
- − Depreciation
- −$3,753
- Taxable income
- $496
- Est. tax owed @ 24.0%
- −$119
- After-tax cash flow
- $2,485/yr
For passive investors: Depreciation is non-cash, so a rental often shows a tax loss while cash-flowing — sheltering income. Rental losses are passive: they offset passive income freely, and up to $25,000/yr can offset ordinary (W-2) income if you actively participate and your MAGI is under $100k (phasing out to $0 by $150k); unused losses carry forward. On sale, claimed depreciation is recaptured at up to 25%, and gains may owe capital-gains tax (a 1031 exchange can defer both). Figures are a year-1 estimate at your 24.0% rate — not tax advice; consult a CPA.
Schools (NCES district)
- District
- Kansas City 33
- NCES district ID
- 2916400
- Math proficiency
- 12% ▼ -8.00%
- Reading proficiency
- 24% ▬ 0.00%
- Median HH income
- $35,227
- Composite
- 14.8/100
- National rank
- #9387
- State rank
- #308 of 324 in MO
Livability — Kansas City
- Score
- 78/100
- State rank
- #28
- US rank
- #2671
Category grades
Schools grade is shown separately in the Schools card above.
Census & demographics
- Census place
- Kansas City, MO
- County
- Jackson County · 687,798 people
- City population
- 439,467
- Metro
- Kansas City, MO-KS
- Population (ZIP)
- 16,878
- Household income
- $63,044
- Rent vs Own
- Severe rent burden
- 962.0
Population outlook (Jackson County) Hauer SSP2
- Today (2025)
- 719,589 people
- By 2030
- 731,456 · +1.6%
- By 2040
- 746,689 · +3.8%
- By 2050
- 749,289 · +4.1%
- By 2075
- 736,227 · +2.3%
- By 2100
- 668,210 · -7.1%
Race, ethnicity, and origin ACS 2023
- Neighborhood character
- Diverse neighborhood (Simpson 0.63)
- Race & ethnicity
- White 49% Black 34% Two or more races 10% Hispanic / Latino 9% Asian 2%
- Hispanic origin (detail)
- Mexican 6%
- Common ancestry
- Romanian 2% Lithuanian 2% Italian 2%
- Foreign-born
- 4% · Canada
- Languages at home
- 92% English-only · Spanish 6% French/Haitian/Cajun 1% Other Indo-European 1%
Political lean MEDSL · Jackson
- 2024 margin
- D (+19.3) · D 58.9% · R 39.5% · Other 1.6%
- 2008→2024 swing
- -6.1pp toward R · 2008: 25.4pp · 2024: 19.3pp
- All cycles
- 2024: D+19.3 2020: D+22.0 2016: D+16.6 2012: D+19.0 2008: D+25.4
Not yet ingested
- Civics
- —
Market trends
- HPI YoY
- ▼ -514.37%
- Current HPI
- 371.8501
- Rent YoY
- ▲ 3.95%
- Metro
- Kansas City, MO-KS
- State GDP YoY
- ▲ 1.84%
- F500 in state
- 20
Industry mix (Fortune 500 HQ in MO)
| Industry | F500 HQs | Revenue |
|---|---|---|
| Healthcare | 1 | $163B |
|
||
| Insurance | 1 | $21B |
|
||
| Industrial Technology | 1 | $17B |
|
||
| Retail | 1 | $16B |
|
||
| Industrial Distribution | 1 | $10B |
|
||
| Utilities | 1 | $9B |
|
||
Price history
+548.2% since first listed31 events — show timeline
- 2026-04-23 Pending — Heartland MLS as Distributed by MLS Grid
- 2026-01-22 Listed $129,000 Heartland MLS as Distributed by MLS Grid
- 2025-10-30 Listing Removed — Heartland MLS as Distributed by MLS Grid
- 2025-09-10 Relisted — Heartland MLS as Distributed by MLS Grid
- 2025-08-25 Pending — Heartland MLS as Distributed by MLS Grid
- 2025-06-11 Price Changed $139,000 Heartland MLS as Distributed by MLS Grid
- 2025-04-25 Price Changed $144,000 Heartland MLS as Distributed by MLS Grid
- 2025-03-07 Listing Removed — Heartland MLS as Distributed by MLS Grid
- 2025-03-07 Listed $149,000 Heartland MLS as Distributed by MLS Grid
- 2024-12-05 Listed $149,000 Heartland MLS as Distributed by MLS Grid
- 2024-08-02 Listing Removed — Heartland MLS as Distributed by MLS Grid
- 2024-05-22 Listed $155,000 Heartland MLS as Distributed by MLS Grid
- 2017-02-22 Sold (Public Records) — Public Records
- 2017-02-15 Sold (MLS) — Heartland MLS as Distributed by MLS Grid
- 2017-01-28 Pending — Heartland MLS as Distributed by MLS Grid
- 2016-10-07 Listed $35,000 Heartland MLS as Distributed by MLS Grid
- 2015-09-08 Sold (MLS) — Heartland MLS as Distributed by MLS Grid
- 2015-05-04 Listed $30,000 Heartland MLS as Distributed by MLS Grid
- 2014-04-11 Sold (Public Records) — Public Records
- 2014-04-11 Sold (Public Records) — Public Records
- 2014-04-10 Sold (MLS) — Heartland MLS as Distributed by MLS Grid
- 2014-03-10 Listed $16,500 Heartland MLS as Distributed by MLS Grid
- 2013-04-08 Sold (Public Records) — Public Records
- 2010-05-17 Listing Removed — Heartland MLS as Distributed by MLS Grid
- 2010-04-05 Listed $39,000 Heartland MLS as Distributed by MLS Grid
- 2007-12-03 Sold (Public Records) — Public Records
- 2007-10-26 Sold (MLS) — Heartland MLS as Distributed by MLS Grid
- 2007-03-10 Listed $19,900 Heartland MLS as Distributed by MLS Grid
- 2004-10-01 Sold (Public Records) — Public Records
- 1997-08-18 Sold (Public Records) — Public Records
- 1995-10-12 Sold (Public Records) — Public Records
Property tax history
+10.4%/yrLatest (2025): $527 · -45.3% YoY. Source: county tax records.
Cash-flow waterfall
monthlySold comps — $/sqft
last 12 mo · ≤1 miLoading sold comps…