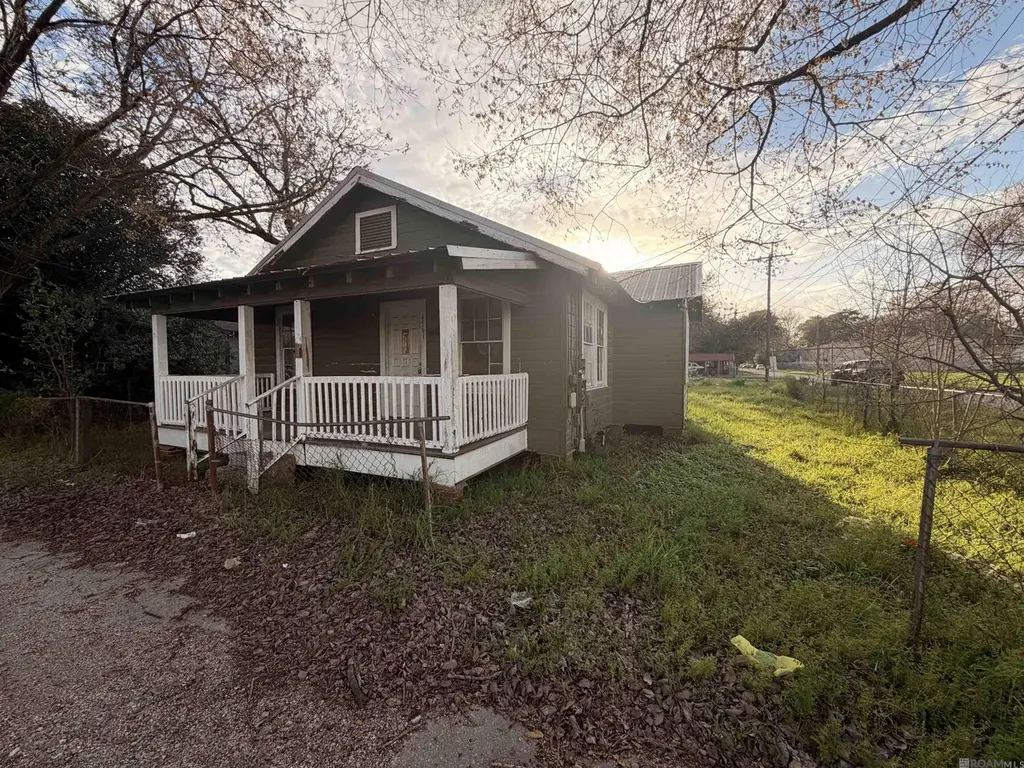
4561 E Brookstown Dr · Baton Rouge, LA
Flood risk 1/10 · Minimal
- FEMA flood zone
- X (unshaded)
- Chance of flooding over 30 yrs
- 0.0%
- Est. flood insurance / yr
- $507 – $1,088
Fire risk 1/10 · Minimal
- Est. fire insurance / yr
- $1,269 – $2,357
Heat risk 8/10 · Major
- Hot days now (above 108°F)
- 7 days/yr
- Hot days in 30 yrs
- 20 days/yr
Wind risk 9/10 · Severe
- Chance of severe wind over 30 yrs
- 99.0%
Air-quality risk 3/10 · Minor
- Unhealthy air days now
- 3 days/yr
- Unhealthy air days in 30 yrs
- 4 days/yr
Risk factors via First Street. Map © Google.
Why this score? — see what drove the B+ grade
The composite is a weighted blend of 9 inputs, each scored 0–100. Each bar is that input's sub-score; the figure is the points it added to the 100-point composite (weight × sub-score).
- Cash flow +30.0/30.0
- ARV discount +15.0/15.0
- 1% rule +10.0/10.0
- DSCR +10.0/10.0
- Livability +3.7/5.0
- Condition / age +2.5/5.0
- Schools +2.4/10.0
- Rent growth +2.2/5.0
- Appreciation +0.0/10.0
$40,000
🖨 Deal sheet 📄 Offer letter ✓ Due diligence
Listing remarks MLS
Age of structure unknown. Property sold as-is with no warranties. Buyer to verify all information including age, measurements, and condition.
Key facts
- 6,969 sq ft lot
- Built 1900
- Listed 100 days
Neighborhood map
What this means for you Summary
Snapshot
- This is a 3-bed/1.0-bath single-family listed at $40k.
Deal economics
- At list price, monthly cash flow is $524 ($6k/yr) — positive.
- The deal already cash-flows at list — no discount required.
- Meets the 1% rule at list price ($968 rent vs $40k).
- Recommended offer: $36k (9.0% below list) — sets the bar for market timing.
- Cap rate 22.0% vs local median 4.3% in Baton Rouge — top-decile yield for the area; either an underpriced asset or a hidden risk that comps aren't pricing in. Stress-test before assuming the spread holds.
Location & tenants
- Location reads 74/100 on livability (#24 in LA, #4,535 nationally) — a middle-class / working-renter tenant base. Strengths: commute A+, cost of living A+, health & safety A+; Watch: amenities D, crime F, employment D-.
- East Baton Rouge Parish (urban): math 22% / reading 34% proficiency, ranked #47 of 98 in LA (top 48%) — low school quality limits family demand, transient renter base, plan for 1-2y turnover; 77% free/reduced lunch — lower-income household profile, screen leases tightly.
- Market conditions: Rents soft (-1.2%/yr); 155 active listings in the ZIP; 13 comparable units currently listed for rent nearby; rentals at typical pace (median 23d on market — plan ~3-4 weeks tenant-placement turnaround); lower-income renter base — watch delinquency; 2,252 units permitted in East Baton Rouge Parish in 2024 (440 in 5+ unit buildings).
- At $968/mo this rent would consume 46% of the median local household income ($25k/yr) (locally 1980% of renters already pay >50% of income on rent) — very limited rent-growth headroom before tenants either downsize or default.
Forward outlook
- Local home prices are declining (-3.0%/yr); year-one equity from $277 of loan paydown is wiped out by about $1k of value loss. Plan a longer hold.
- East Baton Rouge County population projected at +4% by 2050 — modest demand growth; plan on rents tracking national, not racing it.
- At projected returns (-3.0% appreciation + 0.0% rent growth), your $11k cash investment doubles in ~3 years — after that, you're playing with house money.
Negotiation context
- It's been on market 100 days — a 9% lower offer ($36k) is reasonable based on typical stale-listing flexibility.
- 2 sale attempts with the ask held roughly flat each time — persistent listings suggest the price (not the market) is what's stuck; bring a comps-based counter.
Risks & watch-outs
- Watch-outs: built in 1900 — expect roof / HVAC / electrical / plumbing capex.
- Climate carrying-cost: severe wind risk, 99% chance of damaging wind over 30y; extreme-heat days projected 7→20/yr by 2055 (HVAC capex compounding) — expect insurance premiums to compound above CPI over the hold.
Questions for the listing agent
- It's been on market 100 days. Have you received any prior offers? Is the seller open to a 9% concession, seller financing, or rate buy-down credit?
- Built in 1900 — when were the roof, HVAC, electrical panel, plumbing, and water heater last replaced?
- Why hasn't it sold? Are there any deal-killer items the seller is aware of (foundation, flood, title, zoning, code violations)?
- Is there a deadline driving the sale (1031 exchange, divorce, estate, relocation)? That informs how much negotiation room exists.
- Crime grade is F in this area — have there been break-ins, vandalism, or insurance claims at this property in the last 3 years? What carrier currently insures it and at what premium?
- What's the average days-on-market for RENTAL listings here right now (not sales)? A rising rental-DOM trend means longer vacancies and softer asking-rent achievability than the comps imply.
- What's the recent tenant-quality profile in this submarket — average credit score on applications, eviction rate, late-payment / NSF rate, and stable-employment percentage? A property-management company in the area should have these aggregated.
- How much new for-sale + rental construction is in the pipeline within 1–3 miles? Heavy new supply typically softens prices + rents 12–24 months out; constrained supply supports both.
Investment metrics
- 1% rule
- 2.42% ✓
- Cap rate
- 22.02%
- Cash-on-cash
- 56.16%
- DSCR
- 3.50
- GRM
- 3.4
CMA / ARV
- ARV (median comp)
- $62,483
- List price
- $40,000
- Delta
- -35.98%
- Verdict
- UNDERPRICED
- Comps
- 20 within 1.0 mi
Show comp detail 7 sales within ~0.75 mi
| Address | Dist | Beds/Ba | Sqft | Sold | Price | $/sf | Match |
|---|---|---|---|---|---|---|---|
| 5262 E Brookstown Dr | 0.39mi | 3/1.0 | 949 (+5%) | 2mo | $23,000 | $24 | 71 |
| 5765 Beech St | 0.36mi | 2/1.0 (-1) | 816 (-9%) | 2mo | $17,000 | $21 | 61 |
| 5176 Enterprise St | 0.39mi | 2/1.0 (-1) | 1,000 (+11%) | 8mo | $18,900 | $19 | 52 |
| 5135 Enterprise St | 0.36mi | 2/1.0 (-1) | 1,000 (+11%) | 10mo | $17,500 | $18 | 51 |
| 4778 Broadway St | 0.26mi | 3/1.5 | 1,000 (+11%) | 24mo | $69,900 | $70 | 47 |
| 5388 Byron St | 0.48mi | 2/1.0 (-1) | 1,000 (+11%) | 16mo | $70,000 | $70 | 41 |
| 6814 Spring Dr | 0.66mi | 2/1.0 (-1) | 1,008 (+12%) | 19mo | $45,000 | $45 | 28 |
Match score weights: distance 35% · size 25% · config 20% · recency 20%. Top-matched comps best support the ARV.
Projected returns pro-forma
-3.0% appreciation · 0.0% rent growth · sell at horizon
- IRR
- 51.2%
- Equity multiple
- 3.15×
- Total profit
- $24,060
- Equity at exit
- $5,964
- IRR
- 55.4%
- Equity multiple
- 5.73×
- Total profit
- $52,950
- Equity at exit
- $3,458
Cash invested: $11,200 (down + closing). Projections, not guarantees.
Landlord ↔ Tenant lean methodology
- Overall (STATE)
- 90 Strongly Landlord-Friendly
- State Louisiana
- 90 Strongly Landlord-Friendly · R+12
- County
- — inherits STATE
- City
- — inherits STATE
ZIP-level market 70805
- Rents YoY
- -1.2%
- Active inventory
- 155
- Price-to-rent
- 3.4×
Monthly cashflow live
- Estimated rent
- $968 high interval (Pro) →
- Mortgage (P&I)
- −$210
- Tax from tax record
- −$14 /mo · $165/yr
- Insurance
- −$17
- HOA
- −$0
- Vacancy / Maint / Mgmt
- −$203
- Net cashflow
- $524
Break-even live
UW: 25.0% down · 7.5% · 30yr · 1.5% tax · 5.0% vac · 8.0% maint · 8.0% mgmt
Financing live
Cash to close
- Down payment
- $10,000
- Closing costs
- $1,200
- Reserves months
- —
- Total cash needed
- —
Loan-product check · same deal, 3 products live
Conventional
25% down · 7.5% · 30yr
- Down + closing
- —
- Monthly P&I
- —
- Monthly cashflow
- —
- DSCR
- —
- Eligible?
- —
Personal DTI + credit; lowest rate.
DSCR
20% down · 8.5% · 30yr
- Down + closing
- —
- Monthly P&I
- —
- Monthly cashflow
- —
- DSCR
- —
- Eligible?
- —
No personal income docs; deal must DSCR.
Hard money
10% down · 12.0% · 12mo
- Down + closing
- —
- Monthly P&I
- —
- Monthly cashflow
- —
- DSCR
- —
- Eligible?
- —
Short-term bridge; refi at stabilization.
Rent comps 13 comps
| Address | Beds | Baths | Sqft | Rent | $/sqft | DOM | Units | Dist |
|---|---|---|---|---|---|---|---|---|
| 4189 W Brookstown Dr Baton Rouge, LA | 1.0–2.0 | 1.0 | 695 | $825 | $1.19 | 14d | 20 | 0.35mi |
| 5617 Prescott Rd Baton Rouge, LA | 1.0–2.0 | 1.0 | 687 | $900 | $1.31 | 23d | 26 | 0.39mi |
| 5350 Clayton Dr Baton Rouge, LA | 3.0 | 1.0 | 1050 | $850 | $0.81 | 43d | 1 | 0.45mi |
| 5665 McClelland Dr Apt 220 Baton Rouge, LA | 3.0 | 1.5 | 870 | $950 | $1.09 | 14d | 1 | 0.75mi |
| 5665 McClelland Dr Apt 201 Baton Rouge, LA | 3.0 | 1.5 | 870 | $1,050 | $1.21 | 43d | 1 | 0.75mi |
| 5665 McClelland Dr Apt 133 Baton Rouge, LA | 2.0 | 1.0 | 775 | $825 | $1.06 | 43d | 1 | 0.75mi |
| 5665 McClelland Dr Unit 245 Baton Rouge, LA | 2.0 | 1.5 | 765 | $800 | $1.05 | 43d | 1 | 0.75mi |
| 5665 McClelland Dr Baton Rouge, LA | 2.0 | 1.0 | 775 | $825 | $1.06 | 23d | 1 | 0.76mi |
| 3540 N Foster Dr Baton Rouge, LA | 2.0 | 1.0 | 1000 | $1,000 | $1.00 | 23d | 1 | 1.02mi |
| 4380 Mohican-Prescott Crossover Baton Rouge, LA | 2.0 | 2.0 | 910 | $1,055 | $1.16 | 43d | 1 | 1.07mi |
| 3225 Victoria Dr Baton Rouge, LA | 1.0–3.0 | 1.0–3.0 | 1062 | $1,289 | $1.21 | 14d | 18 | 1.08mi |
| 3647 Mission Dr Baton Rouge, LA | 3.0 | 1.0 | 900 | $895 | $0.99 | 23d | 1 | 1.20mi |
| 3577 Mission Dr Baton Rouge, LA | 2.0 | 1.0 | 755 | $950 | $1.26 | 18d | 1 | 1.22mi |
Listing history 20 events
-
2026-06-18days on market $40,000 Active 100 DOM
-
2026-06-17days on market $40,000 Active 99 DOM
-
2026-06-16days on market $40,000 Active 98 DOM
-
2026-06-15days on market $40,000 Active 97 DOM
-
2026-06-14days on market $40,000 Active 95 DOM
-
2026-06-10days on market $40,000 Active 92 DOM
-
2026-06-09days on market $40,000 Active 91 DOM
-
2026-06-08days on market $40,000 Active 90 DOM
-
2026-06-07days on market $40,000 Active 89 DOM
-
2026-06-05days on market $40,000 Active 86 DOM
-
2026-06-03days on market $40,000 Active 85 DOM
-
2026-06-02days on market $40,000 Active 84 DOM
-
2026-06-01days on market $40,000 Active 83 DOM
-
2026-05-31days on market $40,000 Active 82 DOM
-
2026-05-31days on market $40,000 Active 81 DOM
-
2026-03-10$40,000 Active 141-char remark
Show marketing remark (141 chars)
Age of structure unknown. Property sold as-is with no warranties. Buyer to verify all information including age, measurements, and condition.
-
2026-03-07$40,000 Active 141-char remark
Show marketing remark (141 chars)
Age of structure unknown. Property sold as-is with no warranties. Buyer to verify all information including age, measurements, and condition.
-
2022-01-04soldstatus $135,000
-
2016-10-12soldstatus $66,000
-
1993-11-10soldstatus
ⓘ Source: listings_history table (triggers on properties + properties_extension) + one-shot
backfill from property_details.listing_events for pre-trigger history.
Tax reassessment forecast LA · Resets to sale price
- Current annual tax
- $165 · $14/mo
- Projected year-2 tax
- $220 · $18/mo
- Expected delta
- +$55/yr (+$5/mo · 33.1%)
ⓘ Screening estimate from a state-policy table — verify with the county assessor before closing.
Climate risk First Street
- Flood 1/10 Low FEMA zone X (unshaded) · 0% chance over 30 yrs
- Wildfire 1/10 Low
- Heat 8/10 Severe 7 d/yr ≥108°F today · 20 d/yr by 30 yrs out
- Wind 9/10 Extreme 99% chance of damaging wind over 30 yrs
- Air quality 3/10 Moderate 3 unhealthy d/yr today · 4 by 30 yrs out
Nearby sold comps map
Loading sold comps map…
Walkable amenities ~0.75 mi
Loading nearby amenities…
Taxation est. · year 1
- Rental income
- $11,611
- − Mortgage interest
- −$2,241
- − Property taxes
- −$165
- − Insurance
- −$200
- − Repairs & maintenance
- −$929
- − Management
- −$929
- − Depreciation
- −$1,164
- Taxable income
- $5,984
- Est. tax owed @ 24.0%
- −$1,436
- After-tax cash flow
- $4,854/yr
For passive investors: Depreciation is non-cash, so a rental often shows a tax loss while cash-flowing — sheltering income. Rental losses are passive: they offset passive income freely, and up to $25,000/yr can offset ordinary (W-2) income if you actively participate and your MAGI is under $100k (phasing out to $0 by $150k); unused losses carry forward. On sale, claimed depreciation is recaptured at up to 25%, and gains may owe capital-gains tax (a 1031 exchange can defer both). Figures are a year-1 estimate at your 24.0% rate — not tax advice; consult a CPA.
Schools (NCES district)
- District
- East Baton Rouge Parish
- NCES district ID
- 2200540
- Math proficiency
- 22% ▼ -36.00%
- Reading proficiency
- 34% ▼ -31.00%
- Median HH income
- $46,263
- Composite
- 24.14/100
- National rank
- #7745
- State rank
- #47 of 98 in LA
Livability — Baton Rouge
- Score
- 74/100
- State rank
- #24
- US rank
- #4535
Category grades
Schools grade is shown separately in the Schools card above.
Census & demographics
- Census place
- Baton Rouge, LA
- County
- East Baton Rouge Parish · 399,686 people
- City population
- 351,868
- Metro
- Baton Rouge, LA
- Population (ZIP)
- 23,288
- Household income
- $25,397
- Rent vs Own
- Severe rent burden
- 1980.0
Population outlook (East Baton Rouge County) Hauer SSP2
- Today (2025)
- 464,810 people
- By 2030
- 472,137 · +1.6%
- By 2040
- 480,243 · +3.3%
- By 2050
- 484,422 · +4.2%
- By 2075
- 492,069 · +5.9%
- By 2100
- 476,347 · +2.5%
Race, ethnicity, and origin ACS 2023
- Neighborhood character
- Predominantly Black (95%)
- Race & ethnicity
- Black 95% Hispanic / Latino 2% White 2% Two or more races 1%
- Common ancestry
- Lithuanian 1%
- Foreign-born
- 1% · Canada
- Languages at home
- 98% English-only · Spanish 1%
Political lean MEDSL · East Baton Rouge
- 2024 margin
- D (+11.1) · D 54.5% · R 43.4% · Other 2.1%
- 2008→2024 swing
- +8.9pp toward D · 2008: 2.2pp · 2024: 11.1pp
- All cycles
- 2024: D+11.1 2020: D+13.1 2016: D+9.2 2012: D+5.2 2008: D+2.2
Not yet ingested
- Civics
- —
Market trends
- HPI YoY
- ▼ -110.79%
- Current HPI
- 75.7121
- Rent YoY
- ▼ -1.21%
- Metro
- Baton Rouge, LA
- State GDP YoY
- ▲ 3.29%
- F500 in state
- 10
Industry mix (Fortune 500 HQ in LA)
| Industry | F500 HQs | Revenue |
|---|---|---|
| Telecommunications | 2 | $23B |
|
||
| Utilities | 1 | $12B |
|
||
| Wholesale / Distribution | 1 | $5B |
|
||
| Advertising | 1 | $2B |
|
||
Price history
-39.4% since first listed5 events — show timeline
- 2026-03-10 Listed $40,000 GBRMLS
- 2026-03-07 Listed $40,000 AcadianaMLS
- 2022-01-04 Sold (Public Records) $135,000 Public Records
- 2016-10-12 Sold (Public Records) $66,000 Public Records
- 1993-11-10 Sold (Public Records) — Public Records
Property tax history
-0.7%/yrLatest (2025): $165 · -41.7% YoY. Source: county tax records.
Cash-flow waterfall
monthlySold comps — $/sqft
last 12 mo · ≤1 miLoading sold comps…