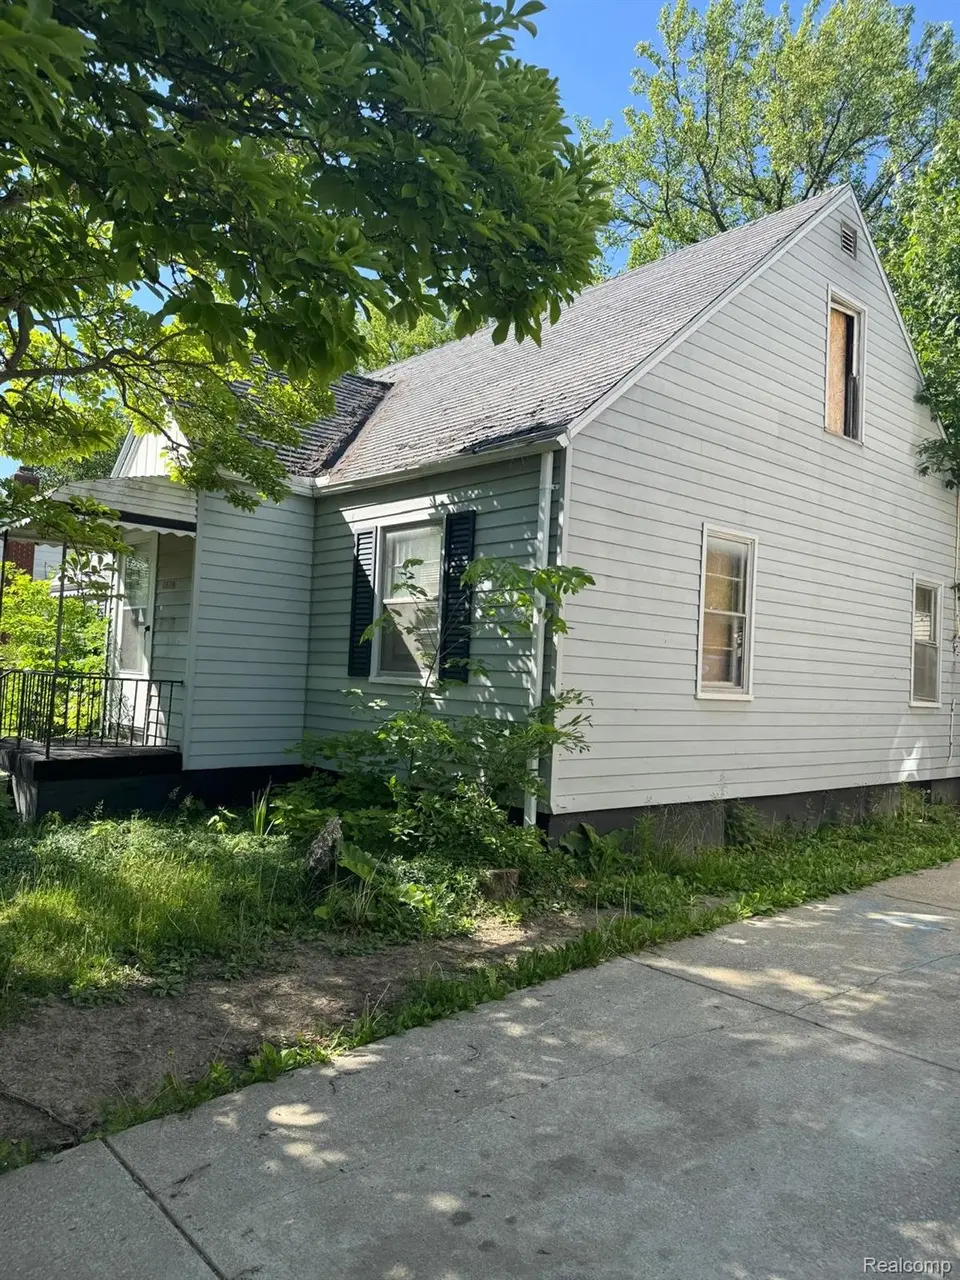
2624 Prospect St · Flint, MI
Flood risk 1/10 · Minimal
- FEMA flood zone
- X (unshaded)
- Chance of flooding over 30 yrs
- 0.0%
- Est. flood insurance / yr
- $507 – $1,088
Fire risk 1/10 · Minimal
- Est. fire insurance / yr
- $784 – $1,456
Heat risk 2/10 · Minimal
- Hot days now (above 96°F)
- 7 days/yr
- Hot days in 30 yrs
- 15 days/yr
Wind risk 2/10 · Minimal
- Chance of severe wind over 30 yrs
- —
Air-quality risk 3/10 · Minor
- Unhealthy air days now
- 3 days/yr
- Unhealthy air days in 30 yrs
- 4 days/yr
Risk factors via First Street. Map © Google.
Why this score? — see what drove the D+ grade
The composite is a weighted blend of 9 inputs, each scored 0–100. Each bar is that input's sub-score; the figure is the points it added to the 100-point composite (weight × sub-score).
- Cash flow +15.0/30.0
- ARV discount +15.0/15.0
- 1% rule +5.0/10.0
- DSCR +5.0/10.0
- Livability +3.7/5.0
- Rent growth +2.5/5.0
- Condition / age +2.5/5.0
- Schools +1.1/10.0
- Appreciation +0.0/10.0
$22,999
🖨 Deal sheet 📄 Offer letter ✓ Due diligence
Listing remarks MLS
INVESTOR ALERT! Outstanding value-add opportunity with strong upside potential. This 3-bedroom home experienced a small fire event primarily affecting portions of the second floor and will require repairs and renovation, making it an ideal project for investors, contractors, and rehabbers looking to capitalize on a discounted acquisition. The property offers a solid footprint and excellent potential for a fix-and-flip, long-term rental, or buy-and-hold investment strategy. Conveniently located near major roadways, shopping, schools, parks, restaurants, and everyday amenities, the location supports strong rental demand and future resale appeal. With the right improvements, this property presents a significant opportunity to create value and build equity. Bring your vision and transform this home into a profitable investment. Property is being sold as-is. Buyer to verify all information, measurements, condition, and future use. Exercise caution when touring the property. Novation: Buyer has equitable interest in the property and is marketing the property with the owner's authorization in order to locate a new buyer.
Key facts
- 4,356 sq ft lot
- Built 1951
- Listed 14 days
Property features AI
Finance
- Other: Located in the HOMESITE SUB subdivision
Exterior
- Parking: No garage
- Utilities: Public water; Public sewer
- Home design: Single-family residence; Two levels; Ground-level entry with steps; Vinyl siding exterior
- Construction: Block foundation
- Exterior features: Paved road access; Lot approximately 0.1 acres (45 x 100)
Interior
- Bathrooms: 1 full bathroom
- Heating & cooling: Forced air heating (natural gas); No central cooling
- Interior features: Basement present; Total of 5 rooms
Neighborhood map
What this means for you Summary
Snapshot
- This is a 3-bed/1.0-bath single-family listed at $23k.
Deal economics
- At list price, monthly cash flow is $667 ($8k/yr) — positive.
- The deal already cash-flows at list — no discount required.
- Meets the 1% rule at list price ($1k rent vs $23k).
- Cap rate 41.1% vs local median 11.5% in Flint — top-decile yield for the area; either an underpriced asset or a hidden risk that comps aren't pricing in. Stress-test before assuming the spread holds.
Location & tenants
- Location reads 74/100 on livability (#196 in MI, #4,946 nationally) — a middle-class / working-renter tenant base. Strengths: commute A+, cost of living A+, housing A+; Watch: schools F, crime F, employment F.
- Flint School District (urban): math 7% / reading 13% proficiency, ranked #714 of 760 in MI (top 94%) — low school quality limits family demand, transient renter base, plan for 1-2y turnover; 83% free/reduced lunch — lower-income household profile, screen leases tightly.
- Market conditions: 131 active listings in the ZIP; 9 comparable units currently listed for rent nearby; rentals at typical pace (median 21d on market — plan ~3-4 weeks tenant-placement turnaround); 419 units permitted in Genesee County in 2024 (68 in 5+ unit buildings).
Forward outlook
- Local home prices are declining (-3.0%/yr); year-one equity from $159 of loan paydown is wiped out by about $690 of value loss. Plan a longer hold.
- Genesee County population projected at -27% by 2050 — secular population decline; favor cash flow + early exit over multi-decade hold.
- At projected returns (-3.0% appreciation + 3.0% rent growth), your $6k cash investment doubles in ~1 year — after that, you're playing with house money.
Negotiation context
- Only 14 days on market — expect competitive offers; lowballing is unlikely to land.
- 4 sale attempts since 3y ago; this cycle's ask has dropped $2k (8%) from the opening price — seller is motivated, your offer sets the floor, not the list.
- Current owner paid $19k; 21% above their basis — modest negotiation headroom, anchor on the comps not their cost.
Risks & watch-outs
- Watch-outs: built in 1951 — expect roof / HVAC / electrical / plumbing capex.
Questions for the listing agent
- Built in 1951 — when were the roof, HVAC, electrical panel, plumbing, and water heater last replaced?
- Is there a deadline driving the sale (1031 exchange, divorce, estate, relocation)? That informs how much negotiation room exists.
- Schools are F-rated, which usually means shorter tenancies and higher turnover. Who's the typical renter profile here, and what's been the actual vacancy rate?
- Crime grade is F in this area — have there been break-ins, vandalism, or insurance claims at this property in the last 3 years? What carrier currently insures it and at what premium?
- The area grade is low — what's the realistic commute time and amenity access for the typical tenant pool here? Any planned neighborhood developments (good or bad) we should know about?
- What's the average days-on-market for RENTAL listings here right now (not sales)? A rising rental-DOM trend means longer vacancies and softer asking-rent achievability than the comps imply.
- What's the recent tenant-quality profile in this submarket — average credit score on applications, eviction rate, late-payment / NSF rate, and stable-employment percentage? A property-management company in the area should have these aggregated.
- How much new for-sale + rental construction is in the pipeline within 1–3 miles? Heavy new supply typically softens prices + rents 12–24 months out; constrained supply supports both.
Investment metrics
- 1% rule
- 4.55% ✓
- Cap rate
- 41.12%
- Cash-on-cash
- 124.38%
- DSCR
- 6.53
- GRM
- 1.8
CMA / ARV
- ARV (on-the-fly)
- $40,840
- Comps found
- 12
Show comp detail 12 sales within ~0.75 mi
| Address | Dist | Beds/Ba | Sqft | Sold | Price | $/sf | Match |
|---|---|---|---|---|---|---|---|
| 2622 Concord St | 0.20mi | 3/1.0 | 939 (-8%) | 1mo | $7,000 | $7 | 76 |
| 2602 Sloan St | 0.31mi | 3/1.0 | 955 (-6%) | 2mo | $25,000 | $26 | 73 |
| 2915 Berkley St | 0.33mi | 2/1.0 (-1) | 987 (-3%) | 4mo | $27,500 | $28 | 71 |
| 2038 Copeman Blvd | 0.54mi | 3/1.0 | 1,077 (+6%) | 0mo | $67,000 | $62 | 65 |
| 1271 Donaldson Blvd | 0.59mi | 3/1.0 | 926 (-9%) | 0mo | $126,500 | $137 | 56 |
| 2101 Barth St | 0.43mi | 2/1.0 (-1) | 905 (-11%) | 4mo | $33,000 | $36 | 52 |
| 2448 Thomas St | 0.72mi | 3/1.0 | 956 (-6%) | 5mo | $107,000 | $112 | 51 |
| 2551 Altoona St | 0.61mi | 2/1.0 (-1) | 1,114 (+9%) | 0mo | $45,000 | $40 | 51 |
| 971 N Chevrolet Ave | 0.66mi | 3/1.0 | 1,122 (+10%) | 4mo | $79,900 | $71 | 49 |
| 3210 Emerson St | 0.70mi | 3/1.5 | 1,120 (+10%) | 0mo | $86,500 | $77 | 49 |
| 1930 Concord St | 0.53mi | 2/1.0 (-1) | 900 (-12%) | 2mo | $30,000 | $33 | 49 |
| 1702 Stevenson St | 0.67mi | 3/1.0 | 1,120 (+10%) | 5mo | $17,500 | $16 | 48 |
Match score weights: distance 35% · size 25% · config 20% · recency 20%. Top-matched comps best support the ARV.
Projected returns pro-forma
-3.0% appreciation · 3.0% rent growth · sell at horizon
- IRR
- —
- Equity multiple
- 7.03×
- Total profit
- $38,800
- Equity at exit
- $3,429
- IRR
- —
- Equity multiple
- 14.76×
- Total profit
- $88,590
- Equity at exit
- $1,989
Cash invested: $6,440 (down + closing). Projections, not guarantees.
Landlord ↔ Tenant lean methodology
- Overall (STATE)
- 62 Landlord-Friendly
- State Michigan
- 62 Landlord-Friendly · EVEN
- County
- — inherits STATE
- City
- — inherits STATE
ZIP-level market 48504
- Active inventory
- 131
- Price-to-rent
- 1.8×
Monthly cashflow live
- Estimated rent
- $1,046 high interval (Pro) →
- Mortgage (P&I)
- −$121
- Tax est. 1.5%
- −$29 /mo · $345/yr
- Insurance
- −$10
- HOA
- −$0
- Vacancy / Maint / Mgmt
- −$220
- Net cashflow
- $667
Break-even live
UW: 25.0% down · 7.5% · 30yr · 1.5% tax · 5.0% vac · 8.0% maint · 8.0% mgmt
Financing live
Cash to close
- Down payment
- $5,750
- Closing costs
- $690
- Reserves months
- —
- Total cash needed
- —
Loan-product check · same deal, 3 products live
Conventional
25% down · 7.5% · 30yr
- Down + closing
- —
- Monthly P&I
- —
- Monthly cashflow
- —
- DSCR
- —
- Eligible?
- —
Personal DTI + credit; lowest rate.
DSCR
20% down · 8.5% · 30yr
- Down + closing
- —
- Monthly P&I
- —
- Monthly cashflow
- —
- DSCR
- —
- Eligible?
- —
No personal income docs; deal must DSCR.
Hard money
10% down · 12.0% · 12mo
- Down + closing
- —
- Monthly P&I
- —
- Monthly cashflow
- —
- DSCR
- —
- Eligible?
- —
Short-term bridge; refi at stabilization.
Rent comps 9 comps
| Address | Beds | Baths | Sqft | Rent | $/sqft | DOM | Units | Dist |
|---|---|---|---|---|---|---|---|---|
| 2544 Tyrone St Flint, MI | 2.0 | 1.0 | 1440 | $825 | $0.57 | 13d | 1 | 0.57mi |
| 2428 Norbert St Flint, MI | 3.0 | 1.0 | 1200 | $1,250 | $1.04 | 20d | 1 | 0.70mi |
| 314 Sheffield Ave Flint, MI | 2.0 | 1.0 | 896 | $1,250 | $1.40 | 20d | 1 | 1.08mi |
| 1540 Garland St Flint, MI | 3.0 | 2.5 | 1344 | $1,017 | $0.76 | 20d | 1 | 1.08mi |
| 3221 Burgess St Flint, MI | 2.0 | 1.0 | 755 | $875 | $1.16 | 20d | 1 | 1.20mi |
| 3713 Gratiot Ave Flint, MI | 4.0 | 1.0 | 1400 | $1,400 | $1.00 | 20d | 1 | 1.26mi |
| 711 W Dewey St Flint, MI | 3.0 | 1.0 | 1011 | $925 | $0.91 | 20d | 1 | 1.31mi |
| 806 Barney Ave Flint, MI | 2.0 | 1.0 | 1000 | $1,000 | $1.00 | 20d | 1 | 1.46mi |
| 3616 Concord St Unit CON3616 Flint, MI | 3.0 | 2.0 | 960 | $895 | $0.93 | 43d | 1 | 1.48mi |
Listing history 12 events
-
2026-06-18days on market $22,999 Active 14 DOM
-
2026-06-17days on market $22,999 Active 13 DOM
-
2026-06-16days on market $22,999 Active 12 DOM
-
2026-06-15pricedays on market $22,999 Active 11 DOM
-
2026-06-14days on market $24,999 Active 9 DOM
-
2026-06-13days on market $24,999 Active 8 DOM
-
2026-06-10days on market $24,999 Active 6 DOM
-
2026-06-09days on market $24,999 Active 5 DOM
-
2026-06-08days on market $24,999 Active 4 DOM
-
2026-06-07days on market $24,999 Active 3 DOM
-
2026-06-05remarks 699-char remark
-
2026-06-05$24,999 Active 1 DOM
ⓘ Source: listings_history table (triggers on properties + properties_extension) + one-shot
backfill from property_details.listing_events for pre-trigger history.
Climate risk First Street
- Flood 1/10 Low FEMA zone X (unshaded) · 0% chance over 30 yrs
- Wildfire 1/10 Low
- Heat 2/10 Low 7 d/yr ≥96°F today · 15 d/yr by 30 yrs out
- Wind 2/10 Low
- Air quality 3/10 Moderate 3 unhealthy d/yr today · 4 by 30 yrs out
Nearby sold comps map
Loading sold comps map…
Walkable amenities ~0.75 mi
Loading nearby amenities…
Taxation est. · year 1
- Rental income
- $12,553
- − Mortgage interest
- −$1,288
- − Property taxes
- −$345
- − Insurance
- −$115
- − Repairs & maintenance
- −$1,004
- − Management
- −$1,004
- − Depreciation
- −$669
- Taxable income
- $8,127
- Est. tax owed @ 24.0%
- −$1,951
- After-tax cash flow
- $6,059/yr
For passive investors: Depreciation is non-cash, so a rental often shows a tax loss while cash-flowing — sheltering income. Rental losses are passive: they offset passive income freely, and up to $25,000/yr can offset ordinary (W-2) income if you actively participate and your MAGI is under $100k (phasing out to $0 by $150k); unused losses carry forward. On sale, claimed depreciation is recaptured at up to 25%, and gains may owe capital-gains tax (a 1031 exchange can defer both). Figures are a year-1 estimate at your 24.0% rate — not tax advice; consult a CPA.
Schools (NCES district)
- District
- Flint School District
- NCES district ID
- 2614520
- Math proficiency
- 7% ▬ 0.00%
- Reading proficiency
- 13% ▲ 3.00%
- Median HH income
- $25,954
- Composite
- 10.97/100
- National rank
- #14642
- State rank
- #714 of 760 in MI
Livability — Flint
- Score
- 74/100
- State rank
- #196
- US rank
- #4946
Category grades
Schools grade is shown separately in the Schools card above.
Census & demographics
- Census place
- Flint, MI
- City population
- 93,814
- Population (ZIP)
- 23,873
Population outlook (Genesee County) Hauer SSP2
- Today (2025)
- 381,312 people
- By 2030
- 362,731 · -4.9%
- By 2040
- 321,550 · -15.7%
- By 2050
- 279,212 · -26.8%
- By 2075
- 193,336 · -49.3%
- By 2100
- 128,118 · -66.4%
Race, ethnicity, and origin ACS 2023
- Neighborhood character
- Predominantly Black (66%)
- Race & ethnicity
- Black 66% White 24% Two or more races 6% Hispanic / Latino 5% Asian 1%
- Common ancestry
- Romanian 2% Lithuanian 1% Italian 1%
- Foreign-born
- 3% · Canada, China
- Languages at home
- 96% English-only · Spanish 2%
Political lean MEDSL · Genesee
- 2024 margin
- Toss-up / Even · D 51.4% · R 47.2% · Other 1.4%
- 2008→2024 swing
- -28.3pp toward R · 2008: 32.5pp · 2024: 4.2pp
- All cycles
- 2024: D+4.2 2020: D+9.3 2016: D+9.5 2012: D+28.2 2008: D+32.5
Not yet ingested
- Civics
- —
Market trends
- HPI YoY
- ▼ -101.67%
- Current HPI
- 94.3111
- Rent YoY
- —
- Metro
- —
- State GDP YoY
- ▲ 1.37%
- F500 in state
- 28
Industry mix (Fortune 500 HQ in MI)
| Industry | F500 HQs | Revenue |
|---|---|---|
| Automotive Parts | 3 | $48B |
|
||
| Automotive | 2 | $372B |
|
||
| Chemicals | 1 | $45B |
|
||
| Automotive Retail | 1 | $29B |
|
||
| Healthcare / Medical Devices | 1 | $23B |
|
||
| Automotive Technology | 1 | $20B |
|
||
Price history
-37.3% since first listed14 events — show timeline
- 2026-06-02 Listed $24,999 MiRealSource-MiMLS
- 2026-06-02 Listed $24,999 REALCOMP
- 2023-07-12 Sold (MLS) $19,000 MiRealSource-MiMLS
- 2023-07-12 Sold (MLS) $19,000 REALCOMP
- 2023-07-05 Pending — MiRealSource-MiMLS
- 2023-07-05 Pending — REALCOMP
- 2023-06-27 Price Changed $20,000 MiRealSource-MiMLS
- 2023-06-27 Price Changed $20,000 REALCOMP
- 2023-06-06 Price Changed $29,900 MiRealSource-MiMLS
- 2023-06-05 Price Changed $29,900 REALCOMP
- 2023-05-16 Price Changed $34,900 MiRealSource-MiMLS
- 2023-05-16 Price Changed $34,900 REALCOMP
- 2023-04-12 Listed $39,900 MiRealSource-MiMLS
- 2023-04-12 Listed $39,900 REALCOMP
Property tax history
+6.2%/yrLatest (2025): $1,390 · +1.8% YoY. Source: county tax records.
Cash-flow waterfall
monthlySold comps — $/sqft
last 12 mo · ≤1 miLoading sold comps…