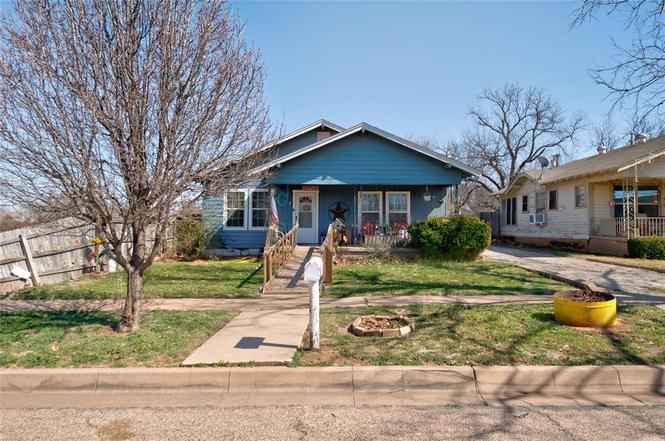
519 Santos St · Abilene, TX
Flood risk 1/10 · Minimal
- FEMA flood zone
- X (unshaded)
- Chance of flooding over 30 yrs
- 0.0%
- Est. flood insurance / yr
- $507 – $1,088
Fire risk 1/10 · Minimal
- Est. fire insurance / yr
- $1,222 – $2,270
Heat risk 6/10 · Moderate
- Hot days now (above 104°F)
- 7 days/yr
- Hot days in 30 yrs
- 22 days/yr
Wind risk 4/10 · Minor
- Chance of severe wind over 30 yrs
- 11.0%
Air-quality risk 1/10 · Minimal
- Unhealthy air days now
- 0 days/yr
- Unhealthy air days in 30 yrs
- 0 days/yr
Risk factors via First Street. Map © Google.
Why this score? — see what drove the B+ grade
The composite is a weighted blend of 9 inputs, each scored 0–100. Each bar is that input's sub-score; the figure is the points it added to the 100-point composite (weight × sub-score).
- Cash flow +30.0/30.0
- ARV discount +15.0/15.0
- 1% rule +10.0/10.0
- DSCR +10.0/10.0
- Rent growth +5.0/5.0
- Livability +3.8/5.0
- Schools +2.8/10.0
- Condition / age +2.5/5.0
- Appreciation +0.0/10.0
$130,000
🖨 Deal sheet 📄 Offer letter ✓ Due diligence
Listing remarks
Charming home featuring 3 bedrooms and 2 bathrooms, offering 2,130 sq ft of living space. The open floor plan includes a cozy living room with soft grey walls, a bright dining area, and a well-equipped kitchen with sage green shaker cabinets, butcher block countertops, and modern stainless steel appliances. Step outside to enjoy a large backyard with mature trees, a full wooden privacy fence, and a concrete pathway. The home also boasts a covered front porch with decorative elements, ample natural light throughout, and convenient access to local amenities. Perfect for anyone seeking a peaceful retreat in a central location, this home offers both comfort and character.
Key facts
- 7,013 sq ft lot
- Built 1928
- Listed 5 days
Neighborhood map
What this means for you Summary
Snapshot
- This is a 4-bed/2.0-bath single-family listed at $130k.
Deal economics
- At list price, monthly cash flow is $1k ($15k/yr) — positive.
- The deal already cash-flows at list — no discount required.
- Meets the 1% rule at list price ($3k rent vs $130k).
- Cap rate 17.6% vs local median 6.7% in Abilene — top-decile yield for the area; either an underpriced asset or a hidden risk that comps aren't pricing in. Stress-test before assuming the spread holds.
Location & tenants
- Location reads 75/100 on livability (#142 in TX, #4,037 nationally) — a middle-class / working-renter tenant base. Strengths: cost of living A+, housing A+, health & safety A+; Watch: crime D, commute F.
- Abilene ISD (urban): math 32% / reading 34% proficiency, ranked #575 of 826 in TX (top 70%) — families likely to look elsewhere, expect single-tenant / working-renter base with shorter leases.
- Zoned schools: Austin El (math 48% / reading 49%, grade D, #950 of 4,322 statewide, top 22%, 724 students, 60% FRL) — zoned schools at 60% FRL track the district average.
- Zoned-school proficiency averages 48% at this address vs 33% district-wide (+16 pts) — the actual schools serving this property are materially stronger than the Abilene ISD average implies; a family-tenant draw the district grade alone would hide.
- Market conditions: Rents rising fast (+32.1%/yr); 109 active listings in the ZIP; 6 comparable units currently listed for rent nearby; rentals at typical pace (median 21d on market — plan ~3-4 weeks tenant-placement turnaround); 508 units permitted in Taylor County in 2024 (0 in 5+ unit buildings).
- At $2,646/mo this rent would consume 50% of the median local household income ($63k/yr) (locally 1096% of renters already pay >50% of income on rent) — very limited rent-growth headroom before tenants either downsize or default.
Forward outlook
- Local home prices are declining (-3.0%/yr); year-one equity from $899 of loan paydown is wiped out by about $4k of value loss. Plan a longer hold.
- Taylor County population projected at +16% by 2050 — long-run rental-demand tailwind backs the buy-and-hold thesis.
- At projected returns (-3.0% appreciation + 8.0% rent growth), your $36k cash investment doubles in ~3 years — after that, you're playing with house money.
Negotiation context
- Only 5 days on market — expect competitive offers; lowballing is unlikely to land.
Risks & watch-outs
- Watch-outs: built in 1928 — expect roof / HVAC / electrical / plumbing capex.
- Climate carrying-cost: extreme-heat days projected 7→22/yr by 2055 (HVAC capex compounding) — expect insurance premiums to compound above CPI over the hold.
Questions for the listing agent
- Built in 1928 — when were the roof, HVAC, electrical panel, plumbing, and water heater last replaced?
- Is there a deadline driving the sale (1031 exchange, divorce, estate, relocation)? That informs how much negotiation room exists.
- Schools are D-rated, which usually means shorter tenancies and higher turnover. Who's the typical renter profile here, and what's been the actual vacancy rate?
- Crime grade is D in this area — have there been break-ins, vandalism, or insurance claims at this property in the last 3 years? What carrier currently insures it and at what premium?
- What's the average days-on-market for RENTAL listings here right now (not sales)? A rising rental-DOM trend means longer vacancies and softer asking-rent achievability than the comps imply.
- What's the recent tenant-quality profile in this submarket — average credit score on applications, eviction rate, late-payment / NSF rate, and stable-employment percentage? A property-management company in the area should have these aggregated.
- How much new for-sale + rental construction is in the pipeline within 1–3 miles? Heavy new supply typically softens prices + rents 12–24 months out; constrained supply supports both.
Investment metrics
- 1% rule
- 2.04% ✓
- Cap rate
- 17.64%
- Cash-on-cash
- 40.51%
- DSCR
- 2.80
- GRM
- 4.1
CMA / ARV
- ARV (on-the-fly)
- $251,008
- Comps found
- 12
Show comp detail 12 sales within ~0.75 mi
| Address | Dist | Beds/Ba | Sqft | Sold | Price | $/sf | Match |
|---|---|---|---|---|---|---|---|
| 2226 Melrose St | 0.16mi | 5/2.0 (+1) | 1,727 (+2%) | 2mo | $279,000 | $162 | 82 |
| 210 Meander St | 0.36mi | 4/2.0 | 1,638 (-3%) | 2mo | $110,000 | $67 | 76 |
| 2231 S 8th St | 0.26mi | 3/2.0 (-1) | 1,750 (+3%) | 4mo | $299,900 | $171 | 74 |
| 518 Meander St | 0.26mi | 3/2.0 (-1) | 1,632 (-4%) | 5mo | $212,000 | $130 | 72 |
| 1009 Amarillo St | 0.53mi | 3/2.0 (-1) | 1,754 (+3%) | 2mo | $180,000 | $103 | 63 |
| 866 Grand Ave | 0.36mi | 3/2.0 (-1) | 1,537 (-9%) | 3mo | $249,900 | $163 | 60 |
| 502 Kirkwood St | 0.64mi | 3/2.5 (-1) | 1,758 (+4%) | 0mo | $199,900 | $114 | 57 |
| 1730 N 3rd St | 0.70mi | 3/1.0 (-1) | 1,648 (-3%) | 2mo | $209,000 | $127 | 52 |
| 1017 Sayles Blvd | 0.52mi | 3/2.0 (-1) | 1,844 (+9%) | 4mo | $275,000 | $149 | 52 |
| 709 Jeanette St | 0.48mi | 3/1.0 (-1) | 1,554 (-8%) | 3mo | $230,000 | $148 | 52 |
| 3041 Russell Ave | 0.67mi | 3/2.0 (-1) | 1,587 (-6%) | 1mo | $224,500 | $141 | 52 |
| 2335 S 10th St | 0.49mi | 3/2.0 (-1) | 1,452 (-14%) | 2mo | $225,000 | $155 | 47 |
Match score weights: distance 35% · size 25% · config 20% · recency 20%. Top-matched comps best support the ARV.
Projected returns pro-forma
-3.0% appreciation · 8.0% rent growth · sell at horizon
- IRR
- 42.4%
- Equity multiple
- 2.96×
- Total profit
- $71,206
- Equity at exit
- $19,383
- IRR
- 50.8%
- Equity multiple
- 7.22×
- Total profit
- $226,515
- Equity at exit
- $11,240
Cash invested: $36,400 (down + closing). Projections, not guarantees.
Landlord ↔ Tenant lean methodology
- Overall (STATE)
- 87 Strongly Landlord-Friendly
- State Texas
- 87 Strongly Landlord-Friendly · R+5
- County
- — inherits STATE
- City
- — inherits STATE
ZIP-level market 79605
- Rents YoY
- 32.1%
- Active inventory
- 109
- Price-to-rent
- 4.1×
Monthly cashflow live
- Estimated rent
- $2,646 high interval (Pro) →
- Mortgage (P&I)
- −$682
- Tax from tax record
- −$126 /mo · $1,511/yr
- Insurance
- −$54
- HOA
- −$0
- Vacancy / Maint / Mgmt
- −$556
- Net cashflow
- $1,229
Break-even live
UW: 25.0% down · 7.5% · 30yr · 1.5% tax · 5.0% vac · 8.0% maint · 8.0% mgmt
Financing live
Cash to close
- Down payment
- $32,500
- Closing costs
- $3,900
- Reserves months
- —
- Total cash needed
- —
Loan-product check · same deal, 3 products live
Conventional
25% down · 7.5% · 30yr
- Down + closing
- —
- Monthly P&I
- —
- Monthly cashflow
- —
- DSCR
- —
- Eligible?
- —
Personal DTI + credit; lowest rate.
DSCR
20% down · 8.5% · 30yr
- Down + closing
- —
- Monthly P&I
- —
- Monthly cashflow
- —
- DSCR
- —
- Eligible?
- —
No personal income docs; deal must DSCR.
Hard money
10% down · 12.0% · 12mo
- Down + closing
- —
- Monthly P&I
- —
- Monthly cashflow
- —
- DSCR
- —
- Eligible?
- —
Short-term bridge; refi at stabilization.
Rent comps 6 comps
| Address | Beds | Baths | Sqft | Rent | $/sqft | DOM | Units | Dist |
|---|---|---|---|---|---|---|---|---|
| 2850 S 5th St Abilene, TX | 4.0 | 2.0 | 1175 | $1,995 | $1.70 | 13d | 1 | 0.44mi |
| 725 Peach St Abilene, TX | 3.0 | 2.0 | 1618 | $3,500 | $2.16 | 21d | 1 | 0.53mi |
| 1349 Meander St Abilene, TX | 3.0 | 1.0 | 1532 | $3,800 | $2.48 | 13d | 1 | 0.88mi |
| 1209 Kirkwood St Abilene, TX | 3.0 | 2.0 | 1674 | $2,500 | $1.49 | 21d | 1 | 1.27mi |
| 3173 Hunt St Abilene, TX | 3.0 | 1.5 | 1300 | $2,250 | $1.73 | 43d | 1 | 1.32mi |
| 1934 Portland Ave Abilene, TX | 3.0 | 2.0 | 1108 | $1,900 | $1.71 | 43d | 1 | 1.33mi |
Listing history 3 events
-
2026-03-09status Pending
-
2026-03-04$130,000 Active
-
1999-08-02soldstatus
ⓘ Source: listings_history table (triggers on properties + properties_extension) + one-shot
backfill from property_details.listing_events for pre-trigger history.
Tax reassessment forecast TX · Resets to sale price
- Current annual tax
- $1,511 · $126/mo
- Projected year-2 tax
- $2,379 · $198/mo
- Expected delta
- +$868/yr (+$72/mo · 57.4%)
ⓘ Screening estimate from a state-policy table — verify with the county assessor before closing.
Climate risk First Street
- Flood 1/10 Low FEMA zone X (unshaded) · 0% chance over 30 yrs
- Wildfire 1/10 Low
- Heat 6/10 Major 7 d/yr ≥104°F today · 22 d/yr by 30 yrs out
- Wind 4/10 Moderate 11% chance of damaging wind over 30 yrs
- Air quality 1/10 Low 0 unhealthy d/yr today · 0 by 30 yrs out
Nearby sold comps map
Loading sold comps map…
Walkable amenities ~0.75 mi
Loading nearby amenities…
Taxation est. · year 1
- Rental income
- $31,758
- − Mortgage interest
- −$7,282
- − Property taxes
- −$1,511
- − Insurance
- −$650
- − Repairs & maintenance
- −$2,541
- − Management
- −$2,541
- − Depreciation
- −$3,782
- Taxable income
- $13,451
- Est. tax owed @ 24.0%
- −$3,228
- After-tax cash flow
- $11,518/yr
For passive investors: Depreciation is non-cash, so a rental often shows a tax loss while cash-flowing — sheltering income. Rental losses are passive: they offset passive income freely, and up to $25,000/yr can offset ordinary (W-2) income if you actively participate and your MAGI is under $100k (phasing out to $0 by $150k); unused losses carry forward. On sale, claimed depreciation is recaptured at up to 25%, and gains may owe capital-gains tax (a 1031 exchange can defer both). Figures are a year-1 estimate at your 24.0% rate — not tax advice; consult a CPA.
Schools (NCES district)
- District
- Abilene ISD
- NCES district ID
- 4807440
- Math proficiency
- 32% ▼ -11.00%
- Reading proficiency
- 34% ▼ -5.00%
- Median HH income
- $39,782
- Composite
- 27.71/100
- National rank
- #6909
- State rank
- #575 of 826 in TX
Livability — Abilene
- Score
- 75/100
- State rank
- #142
- US rank
- #4037
Category grades
Schools grade is shown separately in the Schools card above.
Census & demographics
- Census place
- Abilene, TX
- County
- Taylor County · 136,672 people
- City population
- 136,672
- Metro
- Abilene, TX
- Population (ZIP)
- 28,467
- Household income
- $62,929
- Rent vs Own
- Severe rent burden
- 1096.0
Population outlook (Taylor County) Hauer SSP2
- Today (2025)
- 145,270 people
- By 2030
- 150,050 · +3.3%
- By 2040
- 159,417 · +9.7%
- By 2050
- 168,883 · +16.3%
- By 2075
- 194,436 · +33.8%
- By 2100
- 203,163 · +39.9%
Race, ethnicity, and origin ACS 2023
- Neighborhood character
- Majority White (63%)
- Race & ethnicity
- White 63% Hispanic / Latino 22% Two or more races 12% Black 8% Asian 2%
- Hispanic origin (detail)
- Mexican 19%
- Common ancestry
- Slovak 2% Lithuanian 1% Serbian 1%
- Foreign-born
- 6% · Canada
- Languages at home
- 84% English-only · Spanish 14% German/W. Germanic 1% Other Asian/Pacific 0%
Political lean MEDSL · Taylor
- 2024 margin
- Solid R (+49.8) · D 24.6% · R 74.4% · Other 1.0%
- 2008→2024 swing
- -4.2pp toward R · 2008: -45.6pp · 2024: -49.8pp
- All cycles
- 2024: R+49.8 2020: R+45.3 2016: R+51.1 2012: R+53.6 2008: R+45.6
Not yet ingested
- Civics
- —
Market trends
- HPI YoY
- ▼ -181.75%
- Current HPI
- 201.2341
- Rent YoY
- ▲ 32.08%
- Metro
- Abilene, TX
- State GDP YoY
- ▲ 3.95%
- F500 in state
- 110
Industry mix (Fortune 500 HQ in TX)
| Industry | F500 HQs | Revenue |
|---|---|---|
| Energy | 16 | $1,198B |
|
||
| Technology | 5 | $198B |
|
||
| Engineering / Construction | 4 | $72B |
|
||
| Energy Services | 3 | $60B |
|
||
| Utilities | 3 | $41B |
|
||
| Healthcare | 2 | $330B |
|
||
Price history
3 events — show timeline
- 2026-03-09 Pending — NTREIS
- 2026-03-04 Listed $130,000 NTREIS
- 1999-08-02 Sold (Public Records) — Public Records
Property tax history
+4.7%/yrLatest (2025): $1,511 · +8.3% YoY. Source: county tax records.
Cash-flow waterfall
monthlySold comps — $/sqft
last 12 mo · ≤1 miLoading sold comps…