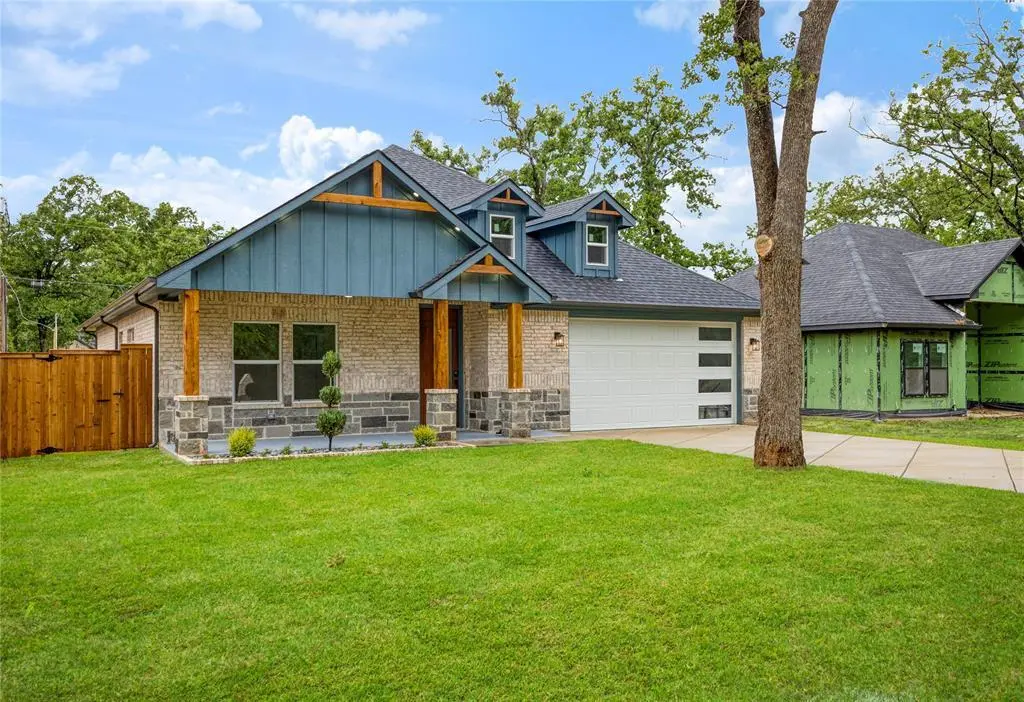
127 Parkside Dr · Tool, TX
Flood risk 1/10 · Minimal
- FEMA flood zone
- X (unshaded)
- Chance of flooding over 30 yrs
- 0.0%
- Est. flood insurance / yr
- $507 – $1,088
Fire risk 4/10 · Minor
- Est. fire insurance / yr
- $1,222 – $2,270
Heat risk 7/10 · Major
- Hot days now (above 109°F)
- 7 days/yr
- Hot days in 30 yrs
- 26 days/yr
Wind risk 6/10 · Moderate
- Chance of severe wind over 30 yrs
- 61.0%
Air-quality risk 2/10 · Minimal
- Unhealthy air days now
- 0 days/yr
- Unhealthy air days in 30 yrs
- 1 days/yr
Risk factors via First Street. Map © Google.
Why this score? — see what drove the C+ grade
The composite is a weighted blend of 9 inputs, each scored 0–100. Each bar is that input's sub-score; the figure is the points it added to the 100-point composite (weight × sub-score).
- Cash flow +24.2/30.0
- DSCR +7.8/10.0
- 1% rule +6.4/10.0
- ARV discount +5.5/15.0
- Appreciation +5.5/10.0
- Condition / age +4.8/5.0
- Schools +4.3/10.0
- Livability +3.3/5.0
- Rent growth +2.5/5.0
$298,900
🖨 Deal sheet 📄 Offer letter ✓ Due diligence
Listing remarks
Welcome to life near the lake in the gated community of Beachwood Estates. Surrounded by mature trees and just minutes from Cedar Creek Lake, this home offers the perfect balance of peaceful living and modern comfort. Imagine weekends spent boating, relaxing by the community pool, playing tennis, or enjoying quiet evening walks through this charming neighborhood. Inside, the home feels bright, warm, and inviting with large windows that fill the space with beautiful natural light. The open-concept design creates an effortless flow between the living, dining, and kitchen areas, making it perfect for entertaining friends, hosting family gatherings, or simply enjoying a quiet evening at home. T
Key facts
- Gated community
- Community pool
- Tennis courts
Tags
Property features AI
Finance
- Other: Builder special listing conditions; Staging items excluded from sale
- Financial info: Financing accepted: Cash, Conventional, FHA, VA
- HOA & community: Mandatory HOA; Annual association fee of $303; HOA includes maintenance of grounds and management fees; HOA managed by Bluehawk Management; Community amenities: clubhouse, community dock, community pool, lake, park, tennis courts
Exterior
- Parking: Attached 2-car garage with garage door opener; 2 covered parking spaces; Driveway
- Security: Smoke detector(s); Gated community
- Utilities: MUD water; MUD sewer; Municipal Utility District
- Home design: Single family residence; One story; Residential property; Located in a gated community
- Construction: Brick construction; Asphalt roof; Slab foundation; New construction completed in 2026
- Exterior features: Covered porch(es); Covered patio/porch; Fenced yard (wood); Landscaped lot; Utilities easement
Interior
- Kitchen: Kitchen with built-in cabinets; Kitchen island; Walk-in pantry; Water line to refrigerator; Dishwasher; Disposal; Electric range; Microwave
- Bedrooms: Primary bedroom (level 1) with walk-in closet; Two additional bedrooms (level 1)
- Flooring: Carpet; Luxury vinyl plank; Tile
- Bathrooms: 2 full bathrooms; Primary bathroom with built-in cabinets and dual sinks
- Heating & cooling: Central air conditioning; Electric heating; Fireplace(s) (electric fireplace)
- Interior features: Open floorplan; Kitchen island; Pantry; Walk-in closet(s); One living area; One dining area; 7 total rooms
- Laundry & utility: Washer hookup; Electric dryer hookup
Neighborhood map
What this means for you Summary
Snapshot
- This is a 3-bed/2.0-bath single-family listed at $299k. Condition is rated excellent.
Deal economics
- At list price, monthly cash flow is $594 ($7k/yr) — positive.
- The deal already cash-flows at list — no discount required.
- Meets the 1% rule at list price ($3k rent vs $299k).
- Recommended offer: $294k (1.5% below list) — sets the bar for market timing.
- Cap rate 8.7% vs local median 2.8% in Tool — top-decile yield for the area; either an underpriced asset or a hidden risk that comps aren't pricing in. Stress-test before assuming the spread holds.
Location & tenants
- Location reads 66/100 on livability (#651 in TX) — a middle-class / working-renter tenant base. Strengths: crime A+, cost of living A+, housing A+; Watch: employment D, amenities F, commute F.
- Malakoff ISD (town): math 48% / reading 54% proficiency, ranked #187 of 826 in TX (top 23%) — acceptable for families but not a draw, mixed tenant base, ~2y average lease; 61% free/reduced lunch — lower-income household profile, screen leases tightly.
- Zoned schools: Tool El (math 32% / reading 62%, grade D-, #1,006 of 4,322 statewide, top 25%, 267 students, 80% FRL) — zoned schools average 80% FRL vs 61% district-wide (19 pts higher); higher-poverty schools than district average — tighter screening recommended.
- Market conditions: 162 active listings in the ZIP; 3 comparable units currently listed for rent nearby; rentals lingering (median 44d on market — plan ~5-8 weeks vacancy on turnover, expect pricing pressure); 100% of comp listings sitting > 30 days — soft ceiling on asking rent; 263 units permitted in Henderson County in 2024 (0 in 5+ unit buildings).
Forward outlook
- In year one you build about $5k of equity ($2k loan paydown + $3k appreciation (1.0% local appreciation)).
- At projected returns (1.0% appreciation + 3.0% rent growth), your $84k cash investment doubles in ~6 years — after that, you're playing with house money.
- By year 7, paydown + projected appreciation supports a ~$35k cash-out refi (75% LTV) — recoverable capital for the next deal without selling this one.
Negotiation context
- It's been on market 26 days — a 2% lower offer ($294k) is reasonable based on typical stale-listing flexibility.
Risks & watch-outs
- Climate carrying-cost: major wind risk, 61% chance of damaging wind over 30y; extreme-heat days projected 7→26/yr by 2055 (HVAC capex compounding) — expect insurance premiums to compound above CPI over the hold.
Questions for the listing agent
- What does the HOA fee cover, when was the last increase, and are there any pending special assessments or reserve-fund shortfalls?
- Is there a deadline driving the sale (1031 exchange, divorce, estate, relocation)? That informs how much negotiation room exists.
- What's the average days-on-market for RENTAL listings here right now (not sales)? A rising rental-DOM trend means longer vacancies and softer asking-rent achievability than the comps imply.
- What's the recent tenant-quality profile in this submarket — average credit score on applications, eviction rate, late-payment / NSF rate, and stable-employment percentage? A property-management company in the area should have these aggregated.
- How much new for-sale + rental construction is in the pipeline within 1–3 miles? Heavy new supply typically softens prices + rents 12–24 months out; constrained supply supports both.
Investment metrics
- 1% rule
- 1.14% ✓
- Cap rate
- 8.68%
- Cash-on-cash
- 8.51%
- DSCR
- 1.38
- GRM
- 7.3
CMA / ARV
- ARV (median comp)
- $286,156
- List price
- $298,900
- Delta
- 4.45%
- Verdict
- FAIR
- Comps
- 20 within 1.0 mi
Show comp detail 12 sales within ~0.75 mi
| Address | Dist | Beds/Ba | Sqft | Sold | Price | $/sf | Match |
|---|---|---|---|---|---|---|---|
| 127 Parkside Dr | 0.00mi | 3/2.0 | 1,590 (0%) | 0mo | $298,900 | $188 | 100 |
| 110 Dogwood Dr | 0.12mi | 3/2.0 | 1,602 (+1%) | 7mo | $279,000 | $174 | 87 |
| 113 Dogwood Dr | 0.09mi | 4/2.0 (+1) | 1,618 (+2%) | 5mo | $295,000 | $182 | 83 |
| 109 Dogwood Dr | 0.11mi | 3/2.0 | 1,656 (+4%) | 7mo | $275,000 | $166 | 83 |
| 119 Driftwood Dr | 0.15mi | 3/2.0 | 1,645 (+4%) | 8mo | $254,900 | $155 | 80 |
| 118 Channelview Dr | 0.12mi | 3/2.0 | 1,467 (-8%) | 4mo | $258,900 | $176 | 78 |
| 202 Morning Dove Dr | 0.36mi | 3/2.0 | 1,606 (+1%) | 5mo | $269,900 | $168 | 78 |
| 105 Oakwood Dr | 0.20mi | 3/2.0 | 1,500 (-6%) | 4mo | $289,900 | $193 | 77 |
| 207 Driftwood Dr | 0.16mi | 3/2.0 | 1,721 (+8%) | 2mo | $317,000 | $184 | 77 |
| 102 Channelview | 0.16mi | 3/2.0 | 1,450 (-9%) | 2mo | $269,000 | $186 | 76 |
| 212 E Beachwood Loop | 0.31mi | 3/2.0 | 1,500 (-6%) | 1mo | $272,500 | $182 | 75 |
| 100 Indian Blanket Ln | 0.44mi | 3/2.5 | 1,534 (-4%) | 8mo | $345,000 | $225 | 65 |
Match score weights: distance 35% · size 25% · config 20% · recency 20%. Top-matched comps best support the ARV.
Projected returns pro-forma
1.03% appreciation · 3.0% rent growth · sell at horizon
- IRR
- 10.3%
- Equity multiple
- 1.53×
- Total profit
- $43,975
- Equity at exit
- $102,577
- IRR
- 14.1%
- Equity multiple
- 2.72×
- Total profit
- $144,008
- Equity at exit
- $136,732
Cash invested: $83,692 (down + closing). Projections, not guarantees.
Landlord ↔ Tenant lean methodology
- Overall (STATE)
- 87 Strongly Landlord-Friendly
- State Texas
- 87 Strongly Landlord-Friendly · R+5
- County
- — inherits STATE
- City
- — inherits STATE
ZIP-level market 75163
- Home prices YoY
- 0.5%
- Active inventory
- 162
- Price-to-rent
- 7.3×
Monthly cashflow live
- Estimated rent
- $3,398 medium interval (Pro) →
- Mortgage (P&I)
- −$1,567
- Tax est. 1.5%
- −$374 /mo · $4,484/yr
- Insurance
- −$125
- HOA
- −$25
- Vacancy / Maint / Mgmt
- −$714
- Net cashflow
- $594
Break-even live
UW: 25.0% down · 7.5% · 30yr · 1.5% tax · 5.0% vac · 8.0% maint · 8.0% mgmt
Financing live
Cash to close
- Down payment
- $74,725
- Closing costs
- $8,967
- Reserves months
- —
- Total cash needed
- —
Loan-product check · same deal, 3 products live
Conventional
25% down · 7.5% · 30yr
- Down + closing
- —
- Monthly P&I
- —
- Monthly cashflow
- —
- DSCR
- —
- Eligible?
- —
Personal DTI + credit; lowest rate.
DSCR
20% down · 8.5% · 30yr
- Down + closing
- —
- Monthly P&I
- —
- Monthly cashflow
- —
- DSCR
- —
- Eligible?
- —
No personal income docs; deal must DSCR.
Hard money
10% down · 12.0% · 12mo
- Down + closing
- —
- Monthly P&I
- —
- Monthly cashflow
- —
- DSCR
- —
- Eligible?
- —
Short-term bridge; refi at stabilization.
Rent comps 3 comps
| Address | Beds | Baths | Sqft | Rent | $/sqft | DOM | Units | Dist |
|---|---|---|---|---|---|---|---|---|
| 102 Plumthicket Ln Trinidad, TX | 3.0 | 2.0 | 1200 | $1,495 | $1.25 | 43d | 1 | 0.90mi |
| 100 Plumthicket Ln Trinidad, TX | 3.0 | 2.0 | 1200 | $1,495 | $1.25 | 43d | 1 | 0.92mi |
| 1012 Chestnut Dr Unit 1301590P Tool, TX | 3.0 | 2.0 | 1894 | $8,514 | $4.50 | 43d | 1 | 1.36mi |
HOA detail
- Monthly dues
- $25 · $300/yr
- Likely covers
- poolsecurity
Listing history 7 events
-
2026-06-03status $298,900 Pending 26 DOM
-
2026-06-02days on market $298,900 Active Option Contract 26 DOM
-
2026-06-01days on market $298,900 Active Option Contract 25 DOM
-
2026-05-31days on market $298,900 Active Option Contract 24 DOM
-
2026-05-30days on market $298,900 Active Option Contract 23 DOM
-
2026-05-17historical Active Option Contract 1345-char remark
-
2026-05-06$298,900 Active 1345-char remark
ⓘ Source: listings_history table (triggers on properties + properties_extension) + one-shot
backfill from property_details.listing_events for pre-trigger history.
Climate risk First Street
- Flood 1/10 Low FEMA zone X (unshaded) · 0% chance over 30 yrs
- Wildfire 4/10 Moderate
- Heat 7/10 Severe 7 d/yr ≥109°F today · 26 d/yr by 30 yrs out
- Wind 6/10 Major 61% chance of damaging wind over 30 yrs
- Air quality 2/10 Low 0 unhealthy d/yr today · 1 by 30 yrs out
Nearby sold comps map
Loading sold comps map…
Walkable amenities ~0.75 mi
Loading nearby amenities…
Taxation est. · year 1
- Rental income
- $40,775
- − Mortgage interest
- −$16,743
- − Property taxes
- −$4,484
- − Insurance
- −$1,494
- − Repairs & maintenance
- −$3,262
- − Management
- −$3,262
- − HOA
- −$300
- − Depreciation
- −$8,695
- Taxable income
- $2,535
- Est. tax owed @ 24.0%
- −$608
- After-tax cash flow
- $6,516/yr
For passive investors: Depreciation is non-cash, so a rental often shows a tax loss while cash-flowing — sheltering income. Rental losses are passive: they offset passive income freely, and up to $25,000/yr can offset ordinary (W-2) income if you actively participate and your MAGI is under $100k (phasing out to $0 by $150k); unused losses carry forward. On sale, claimed depreciation is recaptured at up to 25%, and gains may owe capital-gains tax (a 1031 exchange can defer both). Figures are a year-1 estimate at your 24.0% rate — not tax advice; consult a CPA.
Condition & rehab AI · 30 photos
This home is in excellent condition with modern updates and a great location. It's move-in ready and would benefit from minor exterior and interior enhancements to maximize its value.
Value-add opportunities
- Both Painting exterior and interior walls — Fresh paint can enhance curb appeal and interior aesthetics
- Both Landscaping improvements — Enhanced landscaping can increase curb appeal and property value
- Both Add smart home features — Smart home features can increase property value and attract tech-savvy buyers
Renovation cost estimate screening
Value-add ROI direction
- Both Painting exterior and interior walls — Fresh paint can enhance curb appeal and interior aesthetics ↑
- Both Landscaping improvements — Enhanced landscaping can increase curb appeal and property value ↑
- Both Add smart home features — Smart home features can increase property value and attract tech-savvy buyers ↑
ⓘ Cost ranges are severity-bucket heuristics (US national rule-of-thumb). Get contractor quotes + a written scope before underwriting a rehab budget.
Schools (NCES district)
- District
- Malakoff ISD
- NCES district ID
- 4828780
- Math proficiency
- 48% ▼ -14.00%
- Reading proficiency
- 54% ▼ -5.00%
- Median HH income
- $38,970
- Composite
- 42.54/100
- National rank
- #3200
- State rank
- #187 of 826 in TX
Livability — Tool
- Score
- 66/100
- State rank
- #651
- US rank
- #12292
Category grades
Schools grade is shown separately in the Schools card above.
Census & demographics
- Population (ZIP)
- 2,569
Population outlook (Henderson County) Hauer SSP2
- Today (2025)
- 80,471 people
- By 2030
- 80,608 · +0.2%
- By 2040
- 80,087 · -0.5%
- By 2050
- 78,208 · -2.8%
- By 2075
- 72,423 · -10.0%
- By 2100
- 61,012 · -24.2%
Race, ethnicity, and origin ACS 2023
- Neighborhood character
- Predominantly White (77%)
- Race & ethnicity
- White 77% Two or more races 11% Hispanic / Latino 9% Black 6%
- Hispanic origin (detail)
- Mexican 8%
- Common ancestry
- Serbian 3% Lithuanian 1% European 1%
- Foreign-born
- 7% · Canada, Jamaica
- Languages at home
- 84% English-only · Arabic 10% Spanish 6%
Political lean MEDSL · Henderson
- 2024 margin
- Solid R (+63.5) · D 18.0% · R 81.4%
- 2008→2024 swing
- -18.8pp toward R · 2008: -44.6pp · 2024: -63.5pp
- All cycles
- 2024: R+63.5 2020: R+60.2 2016: R+60.0 2012: R+54.8 2008: R+44.6
Not yet ingested
- Civics
- —
Market trends
- HPI YoY
- ▲ 1.03%
- Current HPI
- 211.6125
- Rent YoY
- —
- Metro
- —
- State GDP YoY
- ▲ 3.95%
- F500 in state
- 110
Industry mix (Fortune 500 HQ in TX)
| Industry | F500 HQs | Revenue |
|---|---|---|
| Energy | 16 | $1,198B |
|
||
| Technology | 5 | $198B |
|
||
| Engineering / Construction | 4 | $72B |
|
||
| Energy Services | 3 | $60B |
|
||
| Utilities | 3 | $41B |
|
||
| Healthcare | 2 | $330B |
|
||
Price history
4 events — show timeline
- 2026-06-10 Sold (MLS) — NTREIS
- 2026-06-02 Pending — NTREIS
- 2026-05-17 Contingent — NTREIS
- 2026-05-06 Listed $298,900 NTREIS
Cash-flow waterfall
monthlySold comps — $/sqft
last 12 mo · ≤1 miLoading sold comps…