891 Mcdonald St · Ludowici, GA
Flood risk 1/10 · Minimal
- FEMA flood zone
- X (unshaded)
- Chance of flooding over 30 yrs
- 0.0%
- Est. flood insurance / yr
- $507 – $1,088
Fire risk 4/10 · Minor
- Est. fire insurance / yr
- $963 – $1,789
Heat risk 8/10 · Major
- Hot days now (above 110°F)
- 7 days/yr
- Hot days in 30 yrs
- 18 days/yr
Wind risk 8/10 · Major
- Chance of severe wind over 30 yrs
- 99.0%
Air-quality risk 2/10 · Minimal
- Unhealthy air days now
- 2 days/yr
- Unhealthy air days in 30 yrs
- 2 days/yr
Risk factors via First Street. Map © Google.
Why this score? — see what drove the B grade
The composite is a weighted blend of 9 inputs, each scored 0–100. Each bar is that input's sub-score; the figure is the points it added to the 100-point composite (weight × sub-score).
- Cash flow +30.0/30.0
- 1% rule +10.0/10.0
- DSCR +10.0/10.0
- ARV discount +7.5/15.0
- Appreciation +5.6/10.0
- Livability +3.6/5.0
- Rent growth +2.5/5.0
- Condition / age +2.5/5.0
- Schools +2.3/10.0
$125,000
🖨 Deal sheet 📄 Offer letter ✓ Due diligence
Listing remarks
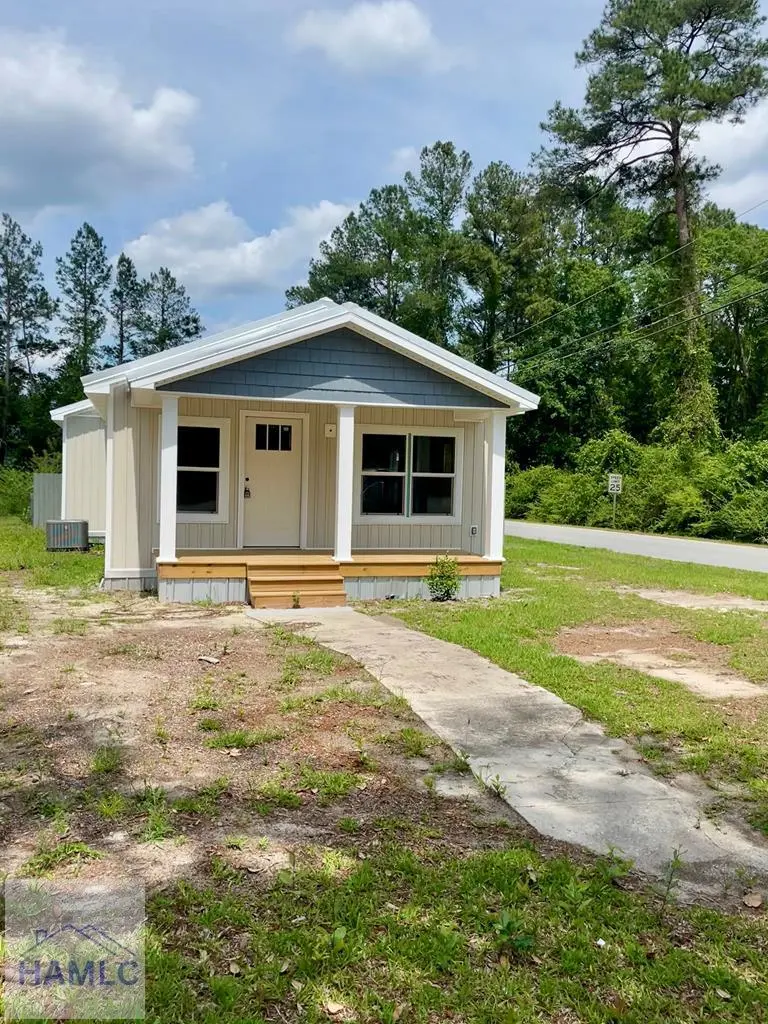
891 McDonald Street offers an excellent opportunity for investors or buyers looking to complete a renovation project with many major exterior improvements already finished. Originally built in 1940, this classic shotgun-style home combines original character with updated exterior features, making it a solid option for a rental property, resale project, or affordable home renovation. The exterior has been completely updated with brand-new vinyl siding and a new roof, helping reduce immediate maintenance concerns and improving overall curb appeal. The home includes approximately 1,240 square feet with three bedrooms and two bathrooms arranged in a traditional, functional layout designed for e
Key facts
- Covered front porch
- Detached garden shed
- Vinyl siding
Tags
Property features AI
Finance
- Other: Pets allowed
Exterior
- Parking: Unpaved parking
- Utilities: Public water
- Home design: Single-family residential property
- Construction: Vinyl siding; Metal roof; Crawl space foundation; Built area approximately 1,248 (raw MLS)
- Exterior features: Storage; Privacy and chain-link fencing; Cleared, corner lot; Paved city street frontage
Interior
- Flooring: Hardwood floors
- Bathrooms: 2 full bathrooms
- Heating & cooling: Central heating; Central air conditioning; Ceiling fans for cooling
- Interior features: Ceiling fans
- Laundry & utility: Washer hookup in a common area; Electric water heater
Neighborhood map
What this means for you Summary
Snapshot
- This is a 3-bed/2.0-bath single-family listed at $125k.
Deal economics
- At list price, monthly cash flow is $662 ($8k/yr) — positive.
- The deal already cash-flows at list — no discount required.
- Meets the 1% rule at list price ($2k rent vs $125k).
- Recommended offer: $121k (3.0% below list) — sets the bar for market timing.
- Cap rate 12.6% vs local median 5.4% in Ludowici — top-decile yield for the area; either an underpriced asset or a hidden risk that comps aren't pricing in. Stress-test before assuming the spread holds.
Location & tenants
- Location reads 72/100 on livability (#74 in GA) — a middle-class / working-renter tenant base. Strengths: cost of living A+, health & safety A+, crime A; Watch: schools D, employment D, amenities F.
- Long County (rural): math 26% / reading 26% proficiency, ranked #115 of 174 in GA (top 66%) — low school quality limits family demand, transient renter base, plan for 1-2y turnover; 61% free/reduced lunch — lower-income household profile, screen leases tightly.
- Market conditions: 409 active listings in the ZIP; 1 comparable units currently listed for rent nearby; 298 units permitted in Long County in 2024 (0 in 5+ unit buildings).
- This rent runs 30% of the median local income ($75k/yr) — at the standard rent-burdened threshold; future hikes will face affordability resistance.
Forward outlook
- In year one you build about $2k of equity ($864 loan paydown + $1k appreciation (1.2% local appreciation)).
- Long County population projected at +72% by 2050 — long-run rental-demand tailwind backs the buy-and-hold thesis.
- At projected returns (1.2% appreciation + 3.0% rent growth), your $35k cash investment doubles in ~4 years — after that, you're playing with house money.
Negotiation context
- It's been on market 35 days — a 3% lower offer ($121k) is reasonable based on typical stale-listing flexibility.
- 2 sale attempts since 4y ago with the ask held roughly flat each time — persistent listings suggest the price (not the market) is what's stuck; bring a comps-based counter.
Risks & watch-outs
- Watch-outs: built in 1940 — expect roof / HVAC / electrical / plumbing capex.
- Climate carrying-cost: severe wind risk, 99% chance of damaging wind over 30y; extreme-heat days projected 7→18/yr by 2055 (HVAC capex compounding) — expect insurance premiums to compound above CPI over the hold.
Questions for the listing agent
- It's been on market 35 days. Have you received any prior offers? Is the seller open to a 3% concession, seller financing, or rate buy-down credit?
- Built in 1940 — when were the roof, HVAC, electrical panel, plumbing, and water heater last replaced?
- Is there a deadline driving the sale (1031 exchange, divorce, estate, relocation)? That informs how much negotiation room exists.
- Schools are D-rated, which usually means shorter tenancies and higher turnover. Who's the typical renter profile here, and what's been the actual vacancy rate?
- What's the average days-on-market for RENTAL listings here right now (not sales)? A rising rental-DOM trend means longer vacancies and softer asking-rent achievability than the comps imply.
- What's the recent tenant-quality profile in this submarket — average credit score on applications, eviction rate, late-payment / NSF rate, and stable-employment percentage? A property-management company in the area should have these aggregated.
- How much new for-sale + rental construction is in the pipeline within 1–3 miles? Heavy new supply typically softens prices + rents 12–24 months out; constrained supply supports both.
Investment metrics
- 1% rule
- 1.51% ✓
- Cap rate
- 12.64%
- Cash-on-cash
- 22.68%
- DSCR
- 2.01
- GRM
- 5.5
CMA / ARV
- ARV (median comp)
- $253,875
- List price
- $125,000
- Delta
- -50.76%
- Verdict
- UNDERPRICED
- Comps
- 20 within 1.0 mi
Show comp detail 12 sales within ~0.75 mi
| Address | Dist | Beds/Ba | Sqft | Sold | Price | $/sf | Match |
|---|---|---|---|---|---|---|---|
| 819 S Mcdonald St | 0.07mi | 3/2.0 | 1,194 (-4%) | 3mo | $51,000 | $43 | 87 |
| 3722 Old Darien-macon Darien Rd | 0.33mi | 3/2.0 | 1,223 (-2%) | 2mo | $244,000 | $200 | 80 |
| 613 S Macon St | 0.36mi | 3/2.0 | 1,282 (+3%) | 10mo | $217,000 | $169 | 70 |
| 1046 Buster Phillips Rd SE | 0.37mi | 3/2.0 | 1,249 (+0%) | 15mo | $240,000 | $192 | 70 |
| 173 Franklin Tree Dr NE | 0.01mi | 3/2.0 | 1,132 (-9%) | 19mo | $222,300 | $196 | 68 |
| 60 Oak Ridge Cemetery Rd | 0.30mi | 3/2.0 | 1,300 (+4%) | 14mo | $227,000 | $175 | 67 |
| 625 S Macon St | 0.36mi | 3/2.0 | 1,282 (+3%) | 22mo | $230,000 | $179 | 61 |
| 398 Macon St | 0.53mi | 3/2.0 | 1,172 (-6%) | 18mo | $210,500 | $180 | 50 |
| 69 N Railroad St | 0.72mi | 3/2.0 | 1,100 (-12%) | 1mo | $219,900 | $200 | 46 |
| 142 Railroad St | 0.74mi | 3/2.0 | 1,292 (+4%) | 19mo | $220,000 | $170 | 43 |
| 198 Archibald Ave SE | 0.62mi | 3/2.0 | 1,336 (+7%) | 20mo | $255,000 | $191 | 43 |
| 1404 Buster Phillips Rd SE | 0.68mi | 3/2.0 | 1,428 (+14%) | 19mo | $264,000 | $185 | 28 |
Match score weights: distance 35% · size 25% · config 20% · recency 20%. Top-matched comps best support the ARV.
Projected returns pro-forma
1.16% appreciation · 3.0% rent growth · sell at horizon
- IRR
- 25.2%
- Equity multiple
- 2.30×
- Total profit
- $45,448
- Equity at exit
- $43,707
- IRR
- 27.8%
- Equity multiple
- 4.39×
- Total profit
- $118,528
- Equity at exit
- $58,891
Cash invested: $35,000 (down + closing). Projections, not guarantees.
Landlord ↔ Tenant lean methodology
- Overall (STATE)
- 90 Strongly Landlord-Friendly
- State Georgia
- 90 Strongly Landlord-Friendly · R+3
- County
- — inherits STATE
- City
- — inherits STATE
ZIP-level market 31316
- Home prices YoY
- 0.6%
- Active inventory
- 409
- Price-to-rent
- 5.5×
Monthly cashflow live
- Estimated rent
- $1,884 medium interval (Pro) →
- Mortgage (P&I)
- −$656
- Tax from tax record
- −$119 /mo · $1,430/yr
- Insurance
- −$52
- HOA
- −$0
- Vacancy / Maint / Mgmt
- −$396
- Net cashflow
- $662
Break-even live
UW: 25.0% down · 7.5% · 30yr · 1.5% tax · 5.0% vac · 8.0% maint · 8.0% mgmt
Financing live
Cash to close
- Down payment
- $31,250
- Closing costs
- $3,750
- Reserves months
- —
- Total cash needed
- —
Loan-product check · same deal, 3 products live
Conventional
25% down · 7.5% · 30yr
- Down + closing
- —
- Monthly P&I
- —
- Monthly cashflow
- —
- DSCR
- —
- Eligible?
- —
Personal DTI + credit; lowest rate.
DSCR
20% down · 8.5% · 30yr
- Down + closing
- —
- Monthly P&I
- —
- Monthly cashflow
- —
- DSCR
- —
- Eligible?
- —
No personal income docs; deal must DSCR.
Hard money
10% down · 12.0% · 12mo
- Down + closing
- —
- Monthly P&I
- —
- Monthly cashflow
- —
- DSCR
- —
- Eligible?
- —
Short-term bridge; refi at stabilization.
Rent comps 1 comps
| Address | Beds | Baths | Sqft | Rent | $/sqft | DOM | Units | Dist |
|---|---|---|---|---|---|---|---|---|
| 34 Pine St Unit C C Ludowici, GA | 2.0 | 1.0 | 990 | $1,395 | $1.41 | 43d | 1 | 0.82mi |
Listing history 23 events
-
2026-06-19days on market $125,000 Active 35 DOM
-
2026-06-18days on market $125,000 Active 34 DOM
-
2026-06-17days on market $125,000 Active 33 DOM
-
2026-06-16days on market $125,000 Active 32 DOM
-
2026-06-15days on market $125,000 Active 31 DOM
-
2026-06-14days on market $125,000 Active 29 DOM
-
2026-06-13days on market $125,000 Active 28 DOM
-
2026-06-10days on market $125,000 Active 26 DOM
-
2026-06-09days on market $125,000 Active 25 DOM
-
2026-06-08days on market $125,000 Active 24 DOM
-
2026-06-07days on market $125,000 Active 23 DOM
-
2026-06-05days on market $125,000 Active 20 DOM
-
2026-06-03days on market $125,000 Active 19 DOM
-
2026-06-02days on market $125,000 Active 18 DOM
-
2026-06-01days on market $125,000 Active 17 DOM
-
2026-05-31days on market $125,000 Active 16 DOM
-
2026-05-30days on market $125,000 Active 15 DOM
-
2026-05-15$125,000 Active 1408-char remark
-
2024-08-21soldstatus $600,000
-
2023-11-27price $89,900
-
2023-11-22price $94,900
-
2022-07-29historical
-
2022-04-28$106,000
ⓘ Source: listings_history table (triggers on properties + properties_extension) + one-shot
backfill from property_details.listing_events for pre-trigger history.
Tax reassessment forecast GA · Resets to sale price
- Current annual tax
- $1,430 · $119/mo
- Projected year-2 tax
- $1,430 · $119/mo
- Expected delta
- $0/yr ($0/mo · 0.0%)
ⓘ Screening estimate from a state-policy table — verify with the county assessor before closing.
Climate risk First Street
- Flood 1/10 Low FEMA zone X (unshaded) · 0% chance over 30 yrs
- Wildfire 4/10 Moderate
- Heat 8/10 Severe 7 d/yr ≥110°F today · 18 d/yr by 30 yrs out
- Wind 8/10 Severe 99% chance of damaging wind over 30 yrs
- Air quality 2/10 Low 2 unhealthy d/yr today · 2 by 30 yrs out
Nearby sold comps map
Loading sold comps map…
Walkable amenities ~0.75 mi
Loading nearby amenities…
Taxation est. · year 1
- Rental income
- $22,606
- − Mortgage interest
- −$7,002
- − Property taxes
- −$1,430
- − Insurance
- −$625
- − Repairs & maintenance
- −$1,808
- − Management
- −$1,808
- − Depreciation
- −$3,636
- Taxable income
- $6,296
- Est. tax owed @ 24.0%
- −$1,511
- After-tax cash flow
- $6,427/yr
For passive investors: Depreciation is non-cash, so a rental often shows a tax loss while cash-flowing — sheltering income. Rental losses are passive: they offset passive income freely, and up to $25,000/yr can offset ordinary (W-2) income if you actively participate and your MAGI is under $100k (phasing out to $0 by $150k); unused losses carry forward. On sale, claimed depreciation is recaptured at up to 25%, and gains may owe capital-gains tax (a 1031 exchange can defer both). Figures are a year-1 estimate at your 24.0% rate — not tax advice; consult a CPA.
Schools (NCES district)
- District
- Long County
- NCES district ID
- 1303360
- Math proficiency
- 26% ▼ -14.00%
- Reading proficiency
- 26% ▼ -13.00%
- Median HH income
- $45,958
- Composite
- 22.51/100
- National rank
- #8090
- State rank
- #115 of 174 in GA
Livability — Ludowici
- Score
- 72/100
- State rank
- #74
- US rank
- #6449
Category grades
Schools grade is shown separately in the Schools card above.
Census & demographics
- Census place
- Ludowici, GA
- County
- Long County · 13,812 people
- City population
- 13,812
- Metro
- Hinesville, GA
- Population (ZIP)
- 13,812
- Household income
- $74,766
- Rent vs Own
- Severe rent burden
- 109.0
Population outlook (Long County) Hauer SSP2
- Today (2025)
- 24,669 people
- By 2030
- 28,223 · +14.4%
- By 2040
- 35,430 · +43.6%
- By 2050
- 42,403 · +71.9%
- By 2075
- 56,996 · +131.0%
- By 2100
- 64,185 · +160.2%
Race, ethnicity, and origin ACS 2023
- Neighborhood character
- Diverse neighborhood (Simpson 0.56)
- Race & ethnicity
- White 61% Black 23% Hispanic / Latino 8% Two or more races 8%
- Hispanic origin (detail)
- Mexican 2% Puerto Rican 5%
- Common ancestry
- Serbian 1% Italian 1% Romanian 1%
- Foreign-born
- 3% · Canada
- Languages at home
- 92% English-only · Spanish 6% Other Asian/Pacific 1% German/W. Germanic 1%
Political lean MEDSL · Long
- 2024 margin
- Strong R (+29.5) · D 35.1% · R 64.6%
- 2008→2024 swing
- -5.4pp toward R · 2008: -24.1pp · 2024: -29.5pp
- All cycles
- 2024: R+29.5 2020: R+26.4 2016: R+30.8 2012: R+22.9 2008: R+24.1
Not yet ingested
- Civics
- —
Market trends
- HPI YoY
- ▲ 1.16%
- Current HPI
- 195.2978
- Rent YoY
- —
- Metro
- Hinesville, GA
- State GDP YoY
- ▲ 2.66%
- F500 in state
- 28
Industry mix (Fortune 500 HQ in GA)
| Industry | F500 HQs | Revenue |
|---|---|---|
| Paper / Packaging | 2 | $29B |
|
||
| Retail | 1 | $160B |
|
||
| Transportation / Logistics | 1 | $91B |
|
||
| Airlines | 1 | $62B |
|
||
| Consumer Goods | 1 | $47B |
|
||
| Utilities | 1 | $25B |
|
||
Price history
+17.9% since first listed6 events — show timeline
- 2026-05-15 Listed $125,000 HABR
- 2024-08-21 Sold (Public Records) $600,000 Public Records
- 2023-11-27 Price Changed $89,900 HABR
- 2023-11-22 Price Changed $94,900 HABR
- 2022-07-29 Listing Removed — Hive MLS
- 2022-04-28 Listed $106,000 Hive MLS
Property tax history
+18.6%/yrLatest (2025): $1,430 · +50.5% YoY. Source: county tax records.
Cash-flow waterfall
monthlySold comps — $/sqft
last 12 mo · ≤1 miLoading sold comps…