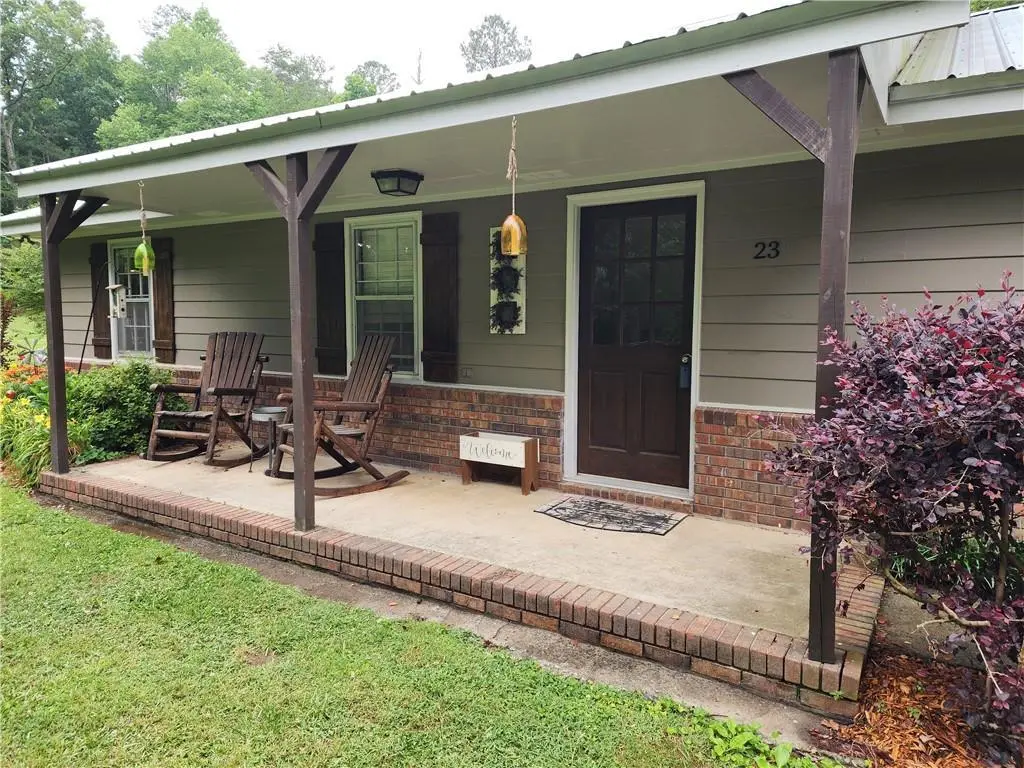
23 Murphy Ln NW · Plainville, GA
Flood risk 7/10 · Major
- FEMA flood zone
- X (unshaded)
- Chance of flooding over 30 yrs
- 0.99%
- Est. flood insurance / yr
- —
Fire risk 5/10 · Moderate
- Est. fire insurance / yr
- $963 – $1,789
Heat risk 5/10 · Moderate
- Hot days now (above 103°F)
- 7 days/yr
- Hot days in 30 yrs
- 19 days/yr
Wind risk 4/10 · Minor
- Chance of severe wind over 30 yrs
- 16.0%
Air-quality risk No data
- Unhealthy air days now
- —
- Unhealthy air days in 30 yrs
- —
Risk factors via First Street. Map © Google.
Why this score? — see what drove the C- grade
The composite is a weighted blend of 9 inputs, each scored 0–100. Each bar is that input's sub-score; the figure is the points it added to the 100-point composite (weight × sub-score).
- Cash flow +14.9/30.0
- Appreciation +9.8/10.0
- ARV discount +7.5/15.0
- DSCR +4.6/10.0
- Schools +3.5/10.0
- Livability +3.2/5.0
- 1% rule +3.0/10.0
- Rent growth +2.5/5.0
- Condition / age +2.5/5.0
$229,900
🖨 Deal sheet 📄 Offer letter ✓ Due diligence
Listing remarks
This stepless rancher perfectly blends comfortable indoor living with an outdoor homestead paradise. From the moment you arrive, you will be captivated by the gorgeous shade trees and beautiful, mature landscaping that frame the property. Step inside to find completely carpet-free living, featuring durable Lifeproof flooring stretching across the floor plan. The spacious eat-in kitchen offers the perfect hub for meals and gathering, while the updated bathroom features a brand-new, modern walk-in shower. Every inch of this home maximizes functionality, including floored attic space that provides easily accessible storage space overhead. Outside, the property transforms into a true gardener&r
Key facts
- Stepless rancher
- Carpet-free living
- Gorgeous shade trees
Tags
Property features AI
Exterior
- Parking: Driveway; Open parking available
- Utilities: Shared well water; Septic tank sewer; Other electric/utilities
- Home design: One level; Fixer condition
- Construction: Metal roof; Other construction materials; Other structures present; Foundation details: see remarks
- Exterior features: Private yard; Back yard fencing; Covered front porch
Interior
- Kitchen: White cabinets; Eat-in kitchen; Laminate counters; Dishwasher; Refrigerator
- Bedrooms: Three main-level bedrooms
- Flooring: Other flooring
- Bathrooms: One full bathroom (main level)
- Heating & cooling: Central heating; Central air
- Interior features: No shared/common walls; Other interior features
- Laundry & utility: Laundry features: other
Neighborhood map
What this means for you Summary
Snapshot
- This is a 3-bed/1.0-bath single-family listed at $230k.
Deal economics
- At list price, monthly cash flow is $68 ($812/yr) — positive.
- The deal already cash-flows at list — no discount required.
- To meet the 1% rule (rent ≥ 1% of price), the offer needs to be $183k (20.5% below list).
- Recommended offer: $183k (20.5% below list) — sets the bar for 1% rule.
Location & tenants
- Location reads 63/100 on livability (#281 in GA) — a middle-class / working-renter tenant base. Strengths: cost of living A+, housing A+; Watch: schools F, crime D-, amenities F.
- Floyd County (rural): math 41% / reading 40% proficiency, ranked #45 of 174 in GA (top 26%) — families likely to look elsewhere, expect single-tenant / working-renter base with shorter leases.
- Market conditions: 181 active listings in the ZIP; solid renter incomes; 355 units permitted in Floyd County in 2024 (0 in 5+ unit buildings).
Forward outlook
- In year one you build about $24k of equity ($2k loan paydown + $22k appreciation (9.7% local appreciation)).
- Floyd County population projected to shrink 6% by 2050 — rents likely to lag national; underwrite the cash flow, not the appreciation.
- At projected returns (9.7% appreciation + 3.0% rent growth), your $64k cash investment doubles in ~3 years — after that, you're playing with house money.
- By year 2, paydown + projected appreciation supports a ~$38k cash-out refi (75% LTV) — recoverable capital for the next deal without selling this one.
Negotiation context
- It's been on market 17 days — a 2% lower offer ($226k) is reasonable based on typical stale-listing flexibility.
- 3 sale attempts since 12y ago with the ask held roughly flat each time — persistent listings suggest the price (not the market) is what's stuck; bring a comps-based counter.
- Current owner paid $84k; list at $230k implies a 174% gain — meaningful room to come down on a strong offer.
Risks & watch-outs
- Climate carrying-cost: major flood risk; moderate wildfire risk; extreme-heat days projected 7→19/yr by 2055 (HVAC capex compounding) — expect insurance premiums to compound above CPI over the hold.
Questions for the listing agent
- Is there a deadline driving the sale (1031 exchange, divorce, estate, relocation)? That informs how much negotiation room exists.
- Schools are F-rated, which usually means shorter tenancies and higher turnover. Who's the typical renter profile here, and what's been the actual vacancy rate?
- Crime grade is D in this area — have there been break-ins, vandalism, or insurance claims at this property in the last 3 years? What carrier currently insures it and at what premium?
- What's the average days-on-market for RENTAL listings here right now (not sales)? A rising rental-DOM trend means longer vacancies and softer asking-rent achievability than the comps imply.
- What's the recent tenant-quality profile in this submarket — average credit score on applications, eviction rate, late-payment / NSF rate, and stable-employment percentage? A property-management company in the area should have these aggregated.
- How much new for-sale + rental construction is in the pipeline within 1–3 miles? Heavy new supply typically softens prices + rents 12–24 months out; constrained supply supports both.
Investment metrics
- 1% rule
- 0.80% ✗
- Cap rate
- 6.65%
- Cash-on-cash
- 1.26%
- DSCR
- 1.06
- GRM
- 10.5
CMA / ARV
No comps found within radius.
Projected returns pro-forma
9.65% appreciation · 3.0% rent growth · sell at horizon
- IRR
- 24.4%
- Equity multiple
- 2.92×
- Total profit
- $123,900
- Equity at exit
- $201,246
- IRR
- 21.7%
- Equity multiple
- 6.59×
- Total profit
- $359,892
- Equity at exit
- $427,899
Cash invested: $64,372 (down + closing). Projections, not guarantees.
Landlord ↔ Tenant lean methodology
- Overall (STATE)
- 90 Strongly Landlord-Friendly
- State Georgia
- 90 Strongly Landlord-Friendly · R+3
- County
- — inherits STATE
- City
- — inherits STATE
ZIP-level market 30103
- Home prices YoY
- 2.5%
- Active inventory
- 181
- Price-to-rent
- 10.5×
Monthly cashflow live
- Estimated rent
- $1,829 medium interval (Pro) →
- Mortgage (P&I)
- −$1,206
- Tax from tax record
- −$76 /mo · $908/yr
- Insurance
- −$96
- HOA
- −$0
- Vacancy / Maint / Mgmt
- −$384
- Net cashflow
- $68
Break-even live
UW: 25.0% down · 7.5% · 30yr · 1.5% tax · 5.0% vac · 8.0% maint · 8.0% mgmt
Financing live
Cash to close
- Down payment
- $57,475
- Closing costs
- $6,897
- Reserves months
- —
- Total cash needed
- —
Loan-product check · same deal, 3 products live
Conventional
25% down · 7.5% · 30yr
- Down + closing
- —
- Monthly P&I
- —
- Monthly cashflow
- —
- DSCR
- —
- Eligible?
- —
Personal DTI + credit; lowest rate.
DSCR
20% down · 8.5% · 30yr
- Down + closing
- —
- Monthly P&I
- —
- Monthly cashflow
- —
- DSCR
- —
- Eligible?
- —
No personal income docs; deal must DSCR.
Hard money
10% down · 12.0% · 12mo
- Down + closing
- —
- Monthly P&I
- —
- Monthly cashflow
- —
- DSCR
- —
- Eligible?
- —
Short-term bridge; refi at stabilization.
Listing history 18 events
-
2026-06-09status $229,900 Pending 17 DOM
-
2026-06-08days on market $229,900 Active 17 DOM
-
2026-06-07days on market $229,900 Active 16 DOM
-
2026-06-03days on market $229,900 Active 12 DOM
-
2026-06-02days on market $229,900 Active 11 DOM
-
2026-06-01days on market $229,900 Active 10 DOM
-
2026-05-31days on market $229,900 Active 9 DOM
-
2026-05-30days on market $229,900 Active 8 DOM
-
2026-05-22$229,900 Active
-
2014-12-13historical
-
2014-12-13historical
-
2014-08-05price $83,000 Reduced
-
2014-08-04price $83,000
-
2014-06-13$84,900 New
-
2014-06-12$84,900 Active
-
2005-09-13soldstatus $84,000
-
2001-08-01soldstatus $80,800
-
1999-10-01soldstatus $65,000
ⓘ Source: listings_history table (triggers on properties + properties_extension) + one-shot
backfill from property_details.listing_events for pre-trigger history.
Tax reassessment forecast GA · Resets to sale price
- Current annual tax
- $908 · $76/mo
- Projected year-2 tax
- $2,115 · $176/mo
- Expected delta
- +$1,207/yr (+$101/mo · 133.0%)
ⓘ Screening estimate from a state-policy table — verify with the county assessor before closing.
Climate risk First Street
- Flood 7/10 Severe FEMA zone X (unshaded) · 99% chance over 30 yrs
- Wildfire 5/10 Major
- Heat 5/10 Major 7 d/yr ≥103°F today · 19 d/yr by 30 yrs out
- Wind 4/10 Moderate 16% chance of damaging wind over 30 yrs
Nearby sold comps map
Loading sold comps map…
Walkable amenities ~0.75 mi
Loading nearby amenities…
Taxation est. · year 1
- Rental income
- $21,945
- − Mortgage interest
- −$12,878
- − Property taxes
- −$908
- − Insurance
- −$1,150
- − Repairs & maintenance
- −$1,756
- − Management
- −$1,756
- − Depreciation
- −$6,688
- Taxable loss
- −$3,190
- Est. tax savings @ 24.0%
- +$766
- After-tax cash flow
- $1,577/yr
For passive investors: Depreciation is non-cash, so a rental often shows a tax loss while cash-flowing — sheltering income. Rental losses are passive: they offset passive income freely, and up to $25,000/yr can offset ordinary (W-2) income if you actively participate and your MAGI is under $100k (phasing out to $0 by $150k); unused losses carry forward. On sale, claimed depreciation is recaptured at up to 25%, and gains may owe capital-gains tax (a 1031 exchange can defer both). Figures are a year-1 estimate at your 24.0% rate — not tax advice; consult a CPA.
Schools (NCES district)
- District
- Floyd County
- NCES district ID
- 1302190
- Math proficiency
- 41% ▼ -5.00%
- Reading proficiency
- 40% ▼ -4.00%
- Median HH income
- $47,083
- Composite
- 34.64/100
- National rank
- #5143
- State rank
- #45 of 174 in GA
Livability — Plainville
- Score
- 63/100
- State rank
- #281
- US rank
- #15131
Category grades
Schools grade is shown separately in the Schools card above.
Census & demographics
- County
- Bartow County · 85,497 people
- Metro
- Atlanta-Sandy Springs-Alpharetta, GA
- Population (ZIP)
- 14,612
- Household income
- $78,071
- Rent vs Own
- Severe rent burden
- 68.0
Population outlook (Floyd County) Hauer SSP2
- Today (2025)
- 96,321 people
- By 2030
- 95,532 · -0.8%
- By 2040
- 93,332 · -3.1%
- By 2050
- 90,850 · -5.7%
- By 2075
- 84,989 · -11.8%
- By 2100
- 76,097 · -21.0%
Race, ethnicity, and origin ACS 2023
- Neighborhood character
- Predominantly White (78%)
- Race & ethnicity
- White 78% Black 6% Hispanic / Latino 6% Two or more races 5%
- Hispanic origin (detail)
- Mexican 3% Dominican 1%
- Common ancestry
- Slovak 3% Serbian 2% Lithuanian 1%
- Foreign-born
- 2% · Canada
- Languages at home
- 96% English-only · Spanish 2%
Political lean MEDSL · Floyd
- 2024 margin
- Solid R (+42.0) · D 28.8% · R 70.7%
- 2008→2024 swing
- -5.6pp toward R · 2008: -36.4pp · 2024: -42.0pp
- All cycles
- 2024: R+42.0 2020: R+41.1 2016: R+43.5 2012: R+39.9 2008: R+36.4
Not yet ingested
- Civics
- —
Market trends
- HPI YoY
- ▲ 9.65%
- Current HPI
- 390.3093
- Rent YoY
- —
- Metro
- Atlanta-Sandy Springs-Alpharetta, GA
- State GDP YoY
- ▲ 2.66%
- F500 in state
- 28
Industry mix (Fortune 500 HQ in GA)
| Industry | F500 HQs | Revenue |
|---|---|---|
| Paper / Packaging | 2 | $29B |
|
||
| Retail | 1 | $160B |
|
||
| Transportation / Logistics | 1 | $91B |
|
||
| Airlines | 1 | $62B |
|
||
| Consumer Goods | 1 | $47B |
|
||
| Utilities | 1 | $25B |
|
||
Price history
+253.7% since first listed10 events — show timeline
- 2026-05-22 Listed $229,900 FMLS
- 2014-12-13 Listing Removed — GAMLS
- 2014-12-13 Listing Removed — FMLS
- 2014-08-05 Price Changed $83,000 GAMLS
- 2014-08-04 Price Changed $83,000 FMLS
- 2014-06-13 Listed $84,900 GAMLS
- 2014-06-12 Listed $84,900 FMLS
- 2005-09-13 Sold (Public Records) $84,000 Public Records
- 2001-08-01 Sold (Public Records) $80,800 Public Records
- 1999-10-01 Sold (Public Records) $65,000 Public Records
Property tax history
-0.0%/yrLatest (2025): $908 · -29.2% YoY. Source: county tax records.
Cash-flow waterfall
monthlySold comps — $/sqft
last 12 mo · ≤1 miLoading sold comps…