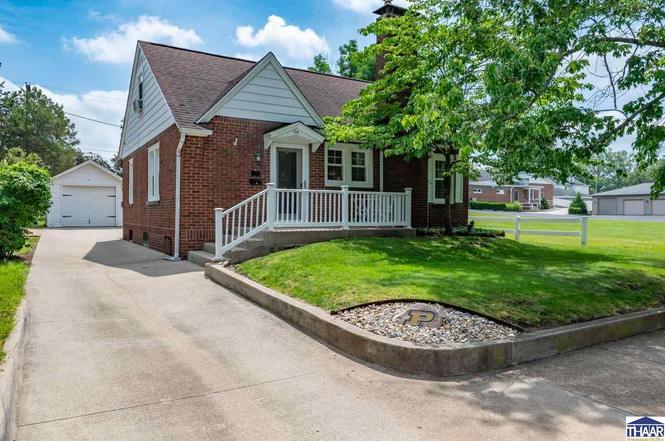
516 S 24th St · Terre Haute, IN
Flood risk 1/10 · Minimal
- FEMA flood zone
- X (unshaded)
- Chance of flooding over 30 yrs
- 0.0%
- Est. flood insurance / yr
- $473 – $860
Fire risk 1/10 · Minimal
- Est. fire insurance / yr
- $717 – $1,331
Heat risk 4/10 · Minor
- Hot days now (above 104°F)
- 7 days/yr
- Hot days in 30 yrs
- 19 days/yr
Wind risk 2/10 · Minimal
- Chance of severe wind over 30 yrs
- 1.0%
Air-quality risk 3/10 · Minor
- Unhealthy air days now
- 3 days/yr
- Unhealthy air days in 30 yrs
- 4 days/yr
Risk factors via First Street. Map © Google.
Why this score? — see what drove the D- grade
The composite is a weighted blend of 9 inputs, each scored 0–100. Each bar is that input's sub-score; the figure is the points it added to the 100-point composite (weight × sub-score).
- Cash flow +11.3/30.0
- ARV discount +10.2/15.0
- Livability +3.8/5.0
- Rent growth +3.5/5.0
- DSCR +3.3/10.0
- Schools +2.9/10.0
- Condition / age +2.5/5.0
- 1% rule +2.3/10.0
- Appreciation +0.0/10.0
$169,900
🖨 Deal sheet (PDF) 📄 Offer letter ✓ Due diligence
Listing remarks MLS
This lovely 3 bedroom, 1 bath brick cottage is ready to be your new home. The main level consists of the living room with nice fireplace, dining room, kitchen, 2 bedrooms and 1 bath. Upstairs is additional bedroom with sitting area. This could also be used as family room/office/playroom. A partial fenced yard and a one car garage. Full basement with lots of room for storage. Many updates including: windows 2014, driveway, porch. railing, retaining wall 2014, refrigerator, sink and faucet 2017. New front, back and screen doors. Convenient location near Meadows - Baeslers area.
Key facts
- Attached garage
- Full basement
- Updated kitchen
Tags
Property features AI
Exterior
- Parking: Detached concrete garage (1 car)
- Utilities: Public sewer
- Home design: Single-family residence; Single story
- Construction: Block construction
- Exterior features: Patio; Porch; Shingle roof
Interior
- Kitchen: Electric range; Electric oven; Refrigerator
- Bathrooms: 1 full bathroom
- Heating & cooling: Central air conditioning; Forced air heating (natural gas)
- Interior features: Fireplace (1); Full basement
Neighborhood map
What this means for you Summary
Snapshot
- This is a 2-bed/1.0-bath single-family listed at $170k.
Deal economics
- At list price, monthly cash flow is $-61 ($-728/yr) — negative.
- To cash-flow at today's rent, offer at most $159k (6.3% below list).
- To meet the 1% rule (rent ≥ 1% of price), the offer needs to be $125k (26.7% below list).
- Recommended offer: $125k (26.7% below list) — sets the bar for 1% rule.
- Cap rate 5.9% vs local median 4.7% in Terre Haute — meaningfully above typical; check what's discounted (condition, days-on-market, listing class) to confirm the premium yield is real.
Location & tenants
- Location reads 75/100 on livability (#63 in IN, #4,186 nationally) — a middle-class / working-renter tenant base. Strengths: cost of living A+, housing A+, health & safety A+; Watch: crime F, employment F.
- Vigo County School Corporation (urban): math 32% / reading 37% proficiency, ranked #202 of 301 in IN (top 67%) — families likely to look elsewhere, expect single-tenant / working-renter base with shorter leases.
- Zoned schools: Davis Park Elementary School (math 32% / reading 27%, grade F, #697 of 994 statewide, top 73%, 335 students, 88% FRL); Woodrow Wilson Middle School (math 21% / reading 31%, grade F, #240 of 330 statewide, top 73%, 701 students, 62% FRL); Terre Haute South Vigo High School (math 37% / reading 72%, grade C-, #79 of 369 statewide, top 26%, 1,610 students, 51% FRL) — zoned schools average 67% FRL vs 47% district-wide (20 pts higher); higher-poverty schools than district average — tighter screening recommended.
- Market conditions: Rents rising fast (+4.1%/yr); 177 active listings in the ZIP; 2 comparable units currently listed for rent nearby; 60 units permitted in Vigo County in 2024 (0 in 5+ unit buildings).
Forward outlook
- Local home prices are declining (-3.0%/yr); year-one equity from $1k of loan paydown is wiped out by about $5k of value loss. Plan a longer hold.
- Vigo County population projected to shrink 5% by 2050 — rents likely to lag national; underwrite the cash flow, not the appreciation.
Negotiation context
- Only 2 days on market — expect competitive offers; lowballing is unlikely to land.
- 2 sale attempts since 8y ago with the ask held roughly flat each time — persistent listings suggest the price (not the market) is what's stuck; bring a comps-based counter.
- Current owner paid $92k; list at $170k implies a 85% gain — meaningful room to come down on a strong offer.
Risks & watch-outs
- Watch-outs: built in 1940 — expect roof / HVAC / electrical / plumbing capex.
Questions for the listing agent
- What do current leases actually rent for vs. the listed asking? Can we see a recent rent roll and the last 12 months of T-12 income?
- Built in 1940 — when were the roof, HVAC, electrical panel, plumbing, and water heater last replaced?
- Is there a deadline driving the sale (1031 exchange, divorce, estate, relocation)? That informs how much negotiation room exists.
- Schools are D-rated, which usually means shorter tenancies and higher turnover. Who's the typical renter profile here, and what's been the actual vacancy rate?
- Crime grade is F in this area — have there been break-ins, vandalism, or insurance claims at this property in the last 3 years? What carrier currently insures it and at what premium?
- The area grade is low — what's the realistic commute time and amenity access for the typical tenant pool here? Any planned neighborhood developments (good or bad) we should know about?
- What's the average days-on-market for RENTAL listings here right now (not sales)? A rising rental-DOM trend means longer vacancies and softer asking-rent achievability than the comps imply.
- What's the recent tenant-quality profile in this submarket — average credit score on applications, eviction rate, late-payment / NSF rate, and stable-employment percentage? A property-management company in the area should have these aggregated.
- How much new for-sale + rental construction is in the pipeline within 1–3 miles? Heavy new supply typically softens prices + rents 12–24 months out; constrained supply supports both.
Investment metrics
- 1% rule
- 0.73% ✗
- Cap rate
- 5.86%
- Cash-on-cash
- -1.53%
- DSCR
- 0.93
- GRM
- 11.4
CMA / ARV
- ARV (on-the-fly)
- $180,588
- Comps found
- 12
Show comp detail 12 sales within ~0.75 mi
| Address | Dist | Beds/Ba | Sqft | Sold | Price | $/sf | Match |
|---|---|---|---|---|---|---|---|
| 2539 Oak St | 0.14mi | 2/2.0 | 1,719 (-4%) | 8mo | $173,000 | $101 | 77 |
| 906 S 19th St | 0.49mi | 3/1.5 (+1) | 1,701 (-5%) | 1mo | $128,000 | $75 | 61 |
| 2236 Park St | 0.23mi | 3/2.0 (+1) | 1,562 (-13%) | 2mo | $137,900 | $88 | 58 |
| 1307 S 21st St | 0.58mi | 3/1.0 (+1) | 1,848 (+3%) | 8mo | $48,000 | $26 | 56 |
| 2611 Mariposa Dr | 0.65mi | 3/2.0 (+1) | 1,892 (+6%) | 1mo | $138,000 | $73 | 50 |
| 65 S 21st St | 0.61mi | 2/1.5 | 1,625 (-9%) | 6mo | $192,500 | $118 | 50 |
| 2215 College Ave | 0.40mi | 3/2.0 (+1) | 1,717 (-4%) | 20mo | $143,000 | $83 | 49 |
| 3028 Franklin St | 0.60mi | 3/1.0 (+1) | 1,978 (+11%) | 1mo | $215,000 | $109 | 48 |
| 2100 College Ave | 0.44mi | 3/1.5 (+1) | 1,558 (-13%) | 7mo | $184,900 | $119 | 45 |
| 805 S Brown Ave | 0.58mi | 3/2.5 (+1) | 1,561 (-13%) | 5mo | $242,000 | $155 | 37 |
| 1008 S 18th St | 0.58mi | 1/1.0 (-1) | 1,539 (-14%) | 19mo | $53,000 | $34 | 29 |
| 2901 Cruft St | 0.52mi | 3/2.5 (+1) | 1,599 (-11%) | 22mo | $260,000 | $163 | 29 |
Match score weights: distance 35% · size 25% · config 20% · recency 20%. Top-matched comps best support the ARV.
Projected returns pro-forma
-3.0% appreciation · 4.09% rent growth · sell at horizon
- IRR
- -17.8%
- Equity multiple
- 0.37×
- Total profit
- $-30,077
- Equity at exit
- $25,333
- IRR
- -8.3%
- Equity multiple
- 0.46×
- Total profit
- $-25,624
- Equity at exit
- $14,690
Cash invested: $47,572 (down + closing). Projections, not guarantees.
Landlord ↔ Tenant lean methodology
- Overall (STATE)
- 90 Strongly Landlord-Friendly
- State Indiana
- 90 Strongly Landlord-Friendly · R+11
- County
- — inherits STATE
- City
- — inherits STATE
ZIP-level market 47803
- Home prices YoY
- -28.6%
- Rents YoY
- 4.1%
- Active inventory
- 177
- Price-to-rent
- 11.4×
Monthly cashflow live
- Estimated rent
- $1,245 medium interval (Pro) →
- Mortgage (P&I)
- −$891
- Tax from tax record
- −$83 /mo · $993/yr
- Insurance
- −$71
- HOA
- −$0
- Vacancy / Maint / Mgmt
- −$262
- Net cashflow
- $-61
Break-even live
Sensitivity live
| Price | -10% $35 | -5% $-13 | +0% $-61 | +5% $-109 | +10% $-157 |
|---|---|---|---|---|---|
| Rent | -10% $-159 | -5% $-110 | +0% $-61 | +5% $-12 | +10% $38 |
| Rate | -1.0pp $25 | -0.5pp $-17 | base $-61 | +0.5pp $-105 | +1.0pp $-150 |
UW: 25.0% down · 7.5% · 30yr · 1.5% tax · 5.0% vac · 8.0% maint · 8.0% mgmt
Financing live
Cash to close
- Down payment
- $42,475
- Closing costs
- $5,097
- Reserves months
- —
- Total cash needed
- —
Loan-product check · same deal, 3 products live
Conventional
25% down · 7.5% · 30yr
- Down + closing
- —
- Monthly P&I
- —
- Monthly cashflow
- —
- DSCR
- —
- Eligible?
- —
Personal DTI + credit; lowest rate.
DSCR
20% down · 8.5% · 30yr
- Down + closing
- —
- Monthly P&I
- —
- Monthly cashflow
- —
- DSCR
- —
- Eligible?
- —
No personal income docs; deal must DSCR.
Hard money
10% down · 12.0% · 12mo
- Down + closing
- —
- Monthly P&I
- —
- Monthly cashflow
- —
- DSCR
- —
- Eligible?
- —
Short-term bridge; refi at stabilization.
Rent comps 2 comps
| Address | Beds | Baths | Sqft | Rent | $/sqft | DOM | Units | Dist |
|---|---|---|---|---|---|---|---|---|
| 1915 Poplar St Unit A Terre Haute, IN | 3.0 | 1.0 | 1412 | $1,200 | $0.85 | 44d | 1 | 0.46mi |
| 2206 2nd Ave Terre Haute, IN | 2.0 | 1.0 | 1664 | $785 | $0.47 | 45d | 1 | 1.37mi |
Listing history 3 events
-
2026-06-14statusdays on market $169,900 Pending 2 DOM
-
2026-06-13remarks 699-char remark
-
2026-06-13$169,900 Active 1 DOM
ⓘ Source: listings_history table (triggers on properties + properties_extension) + one-shot
backfill from property_details.listing_events for pre-trigger history.
Tax reassessment forecast IN · Partial reset (capped growth)
- Current annual tax
- $993 · $83/mo
- Projected year-2 tax
- $1,219 · $102/mo
- Expected delta
- +$225/yr (+$19/mo · 22.7%)
ⓘ Screening estimate from a state-policy table — verify with the county assessor before closing.
Climate risk First Street
- Flood 1/10 Low FEMA zone X (unshaded) · 0% chance over 30 yrs
- Wildfire 1/10 Low
- Heat 4/10 Moderate 7 d/yr ≥104°F today · 19 d/yr by 30 yrs out
- Wind 2/10 Low 100% chance of damaging wind over 30 yrs
- Air quality 3/10 Moderate 3 unhealthy d/yr today · 4 by 30 yrs out
Nearby sold comps map
Loading sold comps map…
Walkable amenities ~0.75 mi
Loading nearby amenities…
Taxation est. · year 1
- Rental income
- $14,944
- − Mortgage interest
- −$9,517
- − Property taxes
- −$993
- − Insurance
- −$850
- − Repairs & maintenance
- −$1,196
- − Management
- −$1,196
- − Depreciation
- −$4,943
- Taxable loss
- −$3,749
- Est. tax savings @ 24.0%
- +$900
- After-tax cash flow
- $171/yr
For passive investors: Depreciation is non-cash, so a rental often shows a tax loss while cash-flowing — sheltering income. Rental losses are passive: they offset passive income freely, and up to $25,000/yr can offset ordinary (W-2) income if you actively participate and your MAGI is under $100k (phasing out to $0 by $150k); unused losses carry forward. On sale, claimed depreciation is recaptured at up to 25%, and gains may owe capital-gains tax (a 1031 exchange can defer both). Figures are a year-1 estimate at your 24.0% rate — not tax advice; consult a CPA.
Schools (NCES district)
- District
- Vigo County School Corporation
- NCES district ID
- 1812090
- Math proficiency
- 32% ▼ -10.00%
- Reading proficiency
- 37% ▼ -8.00%
- Median HH income
- $40,100
- Composite
- 28.97/100
- National rank
- #6625
- State rank
- #202 of 301 in IN
Livability — Terre Haute
- Score
- 75/100
- State rank
- #63
- US rank
- #4186
Category grades
Schools grade is shown separately in the Schools card above.
Census & demographics
- Census place
- Terre Haute, IN
- County
- Vigo County · 91,193 people
- City population
- 91,193
- Metro
- Terre Haute, IN
- Population (ZIP)
- 21,746
- Household income
- $60,565
- Rent vs Own
- Severe rent burden
- 571.0
Population outlook (Vigo County) Hauer SSP2
- Today (2025)
- 106,366 people
- By 2030
- 105,674 · -0.7%
- By 2040
- 103,731 · -2.5%
- By 2050
- 101,200 · -4.9%
- By 2075
- 95,674 · -10.1%
- By 2100
- 85,910 · -19.2%
Race, ethnicity, and origin ACS 2023
- Neighborhood character
- Predominantly White (86%)
- Race & ethnicity
- White 86% Asian 5% Two or more races 4% Black 3% Hispanic / Latino 3%
- Common ancestry
- Slovak 2% Lithuanian 2% Italian 1%
- Foreign-born
- 5% · China, Canada
- Languages at home
- 94% English-only · Chinese 2% Spanish 1% Other Asian/Pacific 1%
Political lean MEDSL · Vigo
- 2024 margin
- R (+18.1) · D 40.0% · R 58.1% · Other 2.0%
- 2008→2024 swing
- -33.9pp toward R · 2008: 15.8pp · 2024: -18.1pp
- All cycles
- 2024: R+18.1 2020: R+14.7 2016: R+15.2 2012: D+0.8 2008: D+15.8
Not yet ingested
- Civics
- —
Market trends
- HPI YoY
- ▼ -69.70%
- Current HPI
- 173.6547
- Rent YoY
- ▲ 4.09%
- Metro
- Terre Haute, IN
- State GDP YoY
- ▲ 2.90%
- F500 in state
- 18
Industry mix (Fortune 500 HQ in IN)
| Industry | F500 HQs | Revenue |
|---|---|---|
| Industrial Machinery | 2 | $37B |
|
||
| Healthcare | 1 | $177B |
|
||
| Pharmaceuticals | 1 | $45B |
|
||
| Metals / Steel | 1 | $18B |
|
||
| Agriculture | 1 | $17B |
|
||
| Packaging | 1 | $12B |
|
||
Price history
+82.9% since first listed3 events — show timeline
- 2026-06-11 Listed $169,900 THAAR
- 2018-03-09 Sold (MLS) $92,000 THAAR
- 2018-01-31 Listed $92,900 THAAR
Property tax history
+2.8%/yrLatest (2024): $993 · +4.4% YoY. Source: county tax records.
Cash-flow waterfall
monthlySold comps — $/sqft
last 12 mo · ≤1 miLoading sold comps…