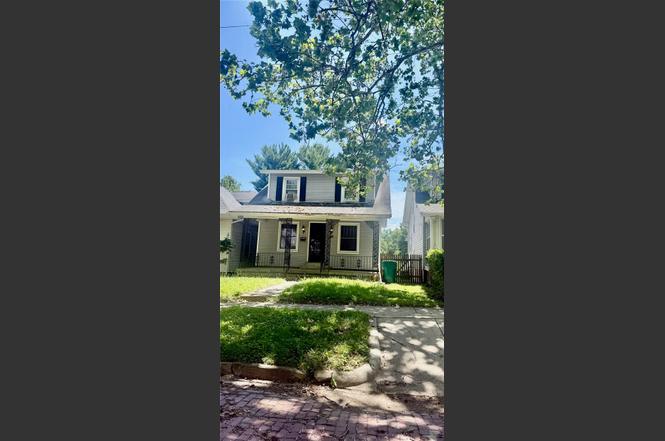
49 W Fairview Pl · Decatur, IL
Flood risk 1/10 · Minimal
- FEMA flood zone
- X (unshaded)
- Chance of flooding over 30 yrs
- 0.0%
- Est. flood insurance / yr
- $473 – $860
Fire risk 1/10 · Minimal
- Est. fire insurance / yr
- $804 – $1,492
Heat risk 4/10 · Minor
- Hot days now (above 105°F)
- 7 days/yr
- Hot days in 30 yrs
- 19 days/yr
Wind risk 2/10 · Minimal
- Chance of severe wind over 30 yrs
- 2.0%
Air-quality risk 2/10 · Minimal
- Unhealthy air days now
- 1 days/yr
- Unhealthy air days in 30 yrs
- 1 days/yr
Risk factors via First Street. Map © Google.
Why this score? — see what drove the B- grade
The composite is a weighted blend of 9 inputs, each scored 0–100. Each bar is that input's sub-score; the figure is the points it added to the 100-point composite (weight × sub-score).
- Cash flow +30.0/30.0
- 1% rule +10.0/10.0
- DSCR +10.0/10.0
- ARV discount +7.5/15.0
- Livability +3.0/5.0
- Rent growth +2.5/5.0
- Condition / age +2.5/5.0
- Schools +0.4/10.0
- Appreciation +0.0/10.0
$34,897
🖨 Deal sheet 📄 Offer letter ✓ Due diligence
Listing remarks
This 3-bedroom, 1.75-bathroom home is perfect for anyone looking for great storage and future potential. A comfortable layout with plenty of room. Tons of parking/storage: includes a 1-car attached garage for daily use, plus a large 2.5-car detached garage that is perfect for a workshop, tools, or extra vehicles. A full unfinished basement offers a massive amount of storage space or the option to finish it later for extra living space.
Key facts
- 4,500 sq ft lot
- Garage
- Built 1924
Tags
Neighborhood map
What this means for you Summary
Snapshot
- This is a 3-bed/1.0-bath single-family listed at $35k.
Deal economics
- At list price, monthly cash flow is $566 ($7k/yr) — positive.
- The deal already cash-flows at list — no discount required.
- Meets the 1% rule at list price ($1k rent vs $35k).
- Cap rate 25.7% vs local median 7.0% in Decatur — top-decile yield for the area; either an underpriced asset or a hidden risk that comps aren't pricing in. Stress-test before assuming the spread holds.
Location & tenants
- Location reads 59/100 on livability (#1,076 in IL) — a working-class tenant base; expect higher turnover. Strengths: cost of living A+, housing A+; Watch: schools F, crime F, amenities F.
- Decatur SD 61 (urban): math 3% / reading 6% proficiency, ranked #605 of 620 in IL (top 98%) — low school quality limits family demand, transient renter base, plan for 1-2y turnover; 73% free/reduced lunch — lower-income household profile, screen leases tightly.
- Market conditions: 75 active listings in the ZIP; 10 comparable units currently listed for rent nearby; rentals lingering (median 44d on market — plan ~5-8 weeks vacancy on turnover, expect pricing pressure); 90% of comp listings sitting > 30 days — soft ceiling on asking rent; 63 units permitted in Macon County in 2024 (0 in 5+ unit buildings).
Forward outlook
- Local home prices are declining (-3.0%/yr); year-one equity from $242 of loan paydown is wiped out by about $1k of value loss. Plan a longer hold.
- Macon County population projected at -24% by 2050 — secular population decline; favor cash flow + early exit over multi-decade hold.
- At projected returns (-3.0% appreciation + 3.0% rent growth), your $10k cash investment doubles in ~2 years — after that, you're playing with house money.
Negotiation context
- Only 2 days on market — expect competitive offers; lowballing is unlikely to land.
Risks & watch-outs
- Watch-outs: property tax is 3.4% of price; built in 1924 — expect roof / HVAC / electrical / plumbing capex.
Questions for the listing agent
- Built in 1924 — when were the roof, HVAC, electrical panel, plumbing, and water heater last replaced?
- Property tax is high relative to price — has the assessment been appealed recently, and will the sale trigger a re-assessment?
- Is there a deadline driving the sale (1031 exchange, divorce, estate, relocation)? That informs how much negotiation room exists.
- Schools are F-rated, which usually means shorter tenancies and higher turnover. Who's the typical renter profile here, and what's been the actual vacancy rate?
- Crime grade is F in this area — have there been break-ins, vandalism, or insurance claims at this property in the last 3 years? What carrier currently insures it and at what premium?
- What's the average days-on-market for RENTAL listings here right now (not sales)? A rising rental-DOM trend means longer vacancies and softer asking-rent achievability than the comps imply.
- What's the recent tenant-quality profile in this submarket — average credit score on applications, eviction rate, late-payment / NSF rate, and stable-employment percentage? A property-management company in the area should have these aggregated.
- How much new for-sale + rental construction is in the pipeline within 1–3 miles? Heavy new supply typically softens prices + rents 12–24 months out; constrained supply supports both.
Investment metrics
- 1% rule
- 3.13% ✓
- Cap rate
- 25.75%
- Cash-on-cash
- 69.48%
- DSCR
- 4.09
- GRM
- 2.7
CMA / ARV
- ARV (on-the-fly)
- $99,144
- Comps found
- 12
Show comp detail 12 sales within ~0.75 mi
| Address | Dist | Beds/Ba | Sqft | Sold | Price | $/sf | Match |
|---|---|---|---|---|---|---|---|
| 1075 W Prairie Ave | 0.49mi | 3/1.0 | 1,209 (-1%) | 0mo | $70,000 | $58 | 75 |
| 1437 W Main St | 0.39mi | 2/1.0 (-1) | 1,231 (+1%) | 2mo | $114,000 | $93 | 74 |
| 415 N Summit Ave | 0.49mi | 3/2.0 | 1,202 (-2%) | 4mo | $135,000 | $112 | 67 |
| 163 Oakdale Blvd | 0.38mi | 2/1.0 (-1) | 1,305 (+7%) | 3mo | $120,000 | $92 | 64 |
| 1368 W Marietta St | 0.33mi | 3/1.0 | 1,052 (-14%) | 1mo | $82,000 | $78 | 60 |
| 1451 W Marietta St | 0.32mi | 3/1.0 | 1,067 (-13%) | 6mo | $96,500 | $90 | 58 |
| 1391 W Decatur St | 0.59mi | 3/2.0 | 1,156 (-6%) | 5mo | $80,000 | $69 | 55 |
| 246 Oakdale Blvd | 0.32mi | 2/1.5 (-1) | 1,384 (+13%) | 3mo | $112,000 | $81 | 53 |
| 1210 W Packard St | 0.46mi | 3/2.0 | 1,364 (+11%) | 4mo | $77,000 | $56 | 52 |
| 1412 W Grand Ave | 0.58mi | 2/1.0 (-1) | 1,330 (+9%) | 3mo | $65,900 | $50 | 50 |
| 1624 W Forest Ave | 0.71mi | 2/1.5 (-1) | 1,325 (+8%) | 1mo | $128,000 | $97 | 46 |
| 1304 W Riverview Ave | 0.71mi | 2/1.0 (-1) | 1,051 (-14%) | 1mo | $43,500 | $41 | 38 |
Match score weights: distance 35% · size 25% · config 20% · recency 20%. Top-matched comps best support the ARV.
Projected returns pro-forma
-3.0% appreciation · 3.0% rent growth · sell at horizon
- IRR
- 69.0%
- Equity multiple
- 4.11×
- Total profit
- $30,427
- Equity at exit
- $5,203
- IRR
- 73.1%
- Equity multiple
- 8.48×
- Total profit
- $73,098
- Equity at exit
- $3,017
Cash invested: $9,771 (down + closing). Projections, not guarantees.
Landlord ↔ Tenant lean methodology
- Overall (STATE)
- 43 Moderately Tenant-Leaning
- State Illinois
- 43 Moderately Tenant-Leaning · D+7
- County
- — inherits STATE
- City
- — inherits STATE
ZIP-level market 62522
- Home prices YoY
- -16.9%
- Active inventory
- 75
- Price-to-rent
- 2.7×
Monthly cashflow live
- Estimated rent
- $1,093 high interval (Pro) →
- Mortgage (P&I)
- −$183
- Tax from tax record
- −$100 /mo · $1,200/yr
- Insurance
- −$15
- HOA
- −$0
- Vacancy / Maint / Mgmt
- −$229
- Net cashflow
- $566
Break-even live
UW: 25.0% down · 7.5% · 30yr · 1.5% tax · 5.0% vac · 8.0% maint · 8.0% mgmt
Financing live
Cash to close
- Down payment
- $8,724
- Closing costs
- $1,047
- Reserves months
- —
- Total cash needed
- —
Loan-product check · same deal, 3 products live
Conventional
25% down · 7.5% · 30yr
- Down + closing
- —
- Monthly P&I
- —
- Monthly cashflow
- —
- DSCR
- —
- Eligible?
- —
Personal DTI + credit; lowest rate.
DSCR
20% down · 8.5% · 30yr
- Down + closing
- —
- Monthly P&I
- —
- Monthly cashflow
- —
- DSCR
- —
- Eligible?
- —
No personal income docs; deal must DSCR.
Hard money
10% down · 12.0% · 12mo
- Down + closing
- —
- Monthly P&I
- —
- Monthly cashflow
- —
- DSCR
- —
- Eligible?
- —
Short-term bridge; refi at stabilization.
Rent comps 10 comps
| Address | Beds | Baths | Sqft | Rent | $/sqft | DOM | Units | Dist |
|---|---|---|---|---|---|---|---|---|
| 1090 N Oakcrest Ave Decatur, IL | 2.0 | 1.0 | 1344 | $1,100 | $0.82 | 43d | 1 | 0.64mi |
| 1345 N Fairview Ave Decatur, IL | 3.0 | 1.0 | 785 | $985 | $1.25 | 43d | 1 | 0.64mi |
| 1311 N Walnut Grove Ave Decatur, IL | 2.0 | 1.0 | 781 | $1,100 | $1.41 | 43d | 1 | 0.77mi |
| 1045 N Monroe St Decatur, IL | 3.0 | 2.0 | 1094 | $1,000 | $0.91 | 43d | 1 | 0.90mi |
| 853 N College St Decatur, IL | 2.0 | 1.0 | 936 | $925 | $0.99 | 43d | 1 | 0.91mi |
| 117 S Elder Ln Apt 9 Decatur, IL | 2.0 | 1.0 | 857 | $950 | $1.11 | 43d | 1 | 1.15mi |
| 644 W Division St Decatur, IL | 3.0 | 2.0 | 1365 | $1,200 | $0.88 | 43d | 1 | 1.17mi |
| 1245 N Union St Decatur, IL | 3.0 | 2.0 | 1111 | $995 | $0.90 | 43d | 1 | 1.19mi |
| 520 S Church St Decatur, IL | 3.0 | 1.5 | 1250 | $1,199 | $0.96 | 13d | 1 | 1.35mi |
| 2148 N Graceland Ave Decatur, IL | 2.0 | 1.0 | 864 | $1,195 | $1.38 | 43d | 1 | 1.46mi |
Listing history 3 events
-
2026-06-19days on market $34,897 Active 2 DOM
-
2026-06-17remarks 439-char remark
-
2026-06-17$34,897 Active 1 DOM
ⓘ Source: listings_history table (triggers on properties + properties_extension) + one-shot
backfill from property_details.listing_events for pre-trigger history.
Tax reassessment forecast IL · Partial reset (capped growth)
- Current annual tax
- $1,200 · $100/mo
- Projected year-2 tax
- $1,200 · $100/mo
- Expected delta
- $0/yr ($0/mo · 0.0%)
ⓘ Screening estimate from a state-policy table — verify with the county assessor before closing.
Climate risk First Street
- Flood 1/10 Low FEMA zone X (unshaded) · 0% chance over 30 yrs
- Wildfire 1/10 Low
- Heat 4/10 Moderate 7 d/yr ≥105°F today · 19 d/yr by 30 yrs out
- Wind 2/10 Low 2% chance of damaging wind over 30 yrs
- Air quality 2/10 Low 1 unhealthy d/yr today · 1 by 30 yrs out
Nearby sold comps map
Loading sold comps map…
Walkable amenities ~0.75 mi
Loading nearby amenities…
Taxation est. · year 1
- Rental income
- $13,113
- − Mortgage interest
- −$1,955
- − Property taxes
- −$1,200
- − Insurance
- −$174
- − Repairs & maintenance
- −$1,049
- − Management
- −$1,049
- − Depreciation
- −$1,015
- Taxable income
- $6,670
- Est. tax owed @ 24.0%
- −$1,601
- After-tax cash flow
- $5,188/yr
For passive investors: Depreciation is non-cash, so a rental often shows a tax loss while cash-flowing — sheltering income. Rental losses are passive: they offset passive income freely, and up to $25,000/yr can offset ordinary (W-2) income if you actively participate and your MAGI is under $100k (phasing out to $0 by $150k); unused losses carry forward. On sale, claimed depreciation is recaptured at up to 25%, and gains may owe capital-gains tax (a 1031 exchange can defer both). Figures are a year-1 estimate at your 24.0% rate — not tax advice; consult a CPA.
Schools (NCES district)
- District
- Decatur SD 61
- NCES district ID
- 1711850
- Math proficiency
- 3% ▼ -4.00%
- Reading proficiency
- 6% ▼ -6.00%
- Median HH income
- $38,864
- Composite
- 3.99/100
- National rank
- #10059
- State rank
- #605 of 620 in IL
Livability — Decatur
- Score
- 59/100
- State rank
- #1076
- US rank
- #20533
Category grades
Schools grade is shown separately in the Schools card above.
Census & demographics
- Census place
- Decatur, IL
- County
- Macon County · 78,333 people
- City population
- 78,333
- Metro
- Decatur, IL
- Population (ZIP)
- 15,185
- Household income
- $50,669
- Rent vs Own
- Severe rent burden
- 321.0
Population outlook (Macon County) Hauer SSP2
- Today (2025)
- 99,568 people
- By 2030
- 94,973 · -4.6%
- By 2040
- 85,250 · -14.4%
- By 2050
- 75,920 · -23.8%
- By 2075
- 55,962 · -43.8%
- By 2100
- 36,468 · -63.4%
Race, ethnicity, and origin ACS 2023
- Neighborhood character
- Majority White (62%)
- Race & ethnicity
- White 62% Black 28% Two or more races 7% Hispanic / Latino 2% Asian 1%
- Common ancestry
- Romanian 1% Italian 1% Slovak 1%
- Foreign-born
- 2% · Canada, China, Jamaica
- Languages at home
- 97% English-only · Spanish 2%
Political lean MEDSL · Macon
- 2024 margin
- R (+18.9) · D 39.8% · R 58.7% · Other 1.4%
- 2008→2024 swing
- -20.0pp toward R · 2008: 1.1pp · 2024: -18.9pp
- All cycles
- 2024: R+18.9 2020: R+17.7 2016: R+18.1 2012: R+5.2 2008: D+1.1
Not yet ingested
- Civics
- —
Market trends
- HPI YoY
- ▼ -36.64%
- Current HPI
- 180.7847
- Rent YoY
- —
- Metro
- Decatur, IL
- State GDP YoY
- ▲ 1.59%
- F500 in state
- 60
Industry mix (Fortune 500 HQ in IL)
| Industry | F500 HQs | Revenue |
|---|---|---|
| Insurance | 4 | $201B |
|
||
| Consumer Goods | 4 | $87B |
|
||
| Industrial Machinery | 3 | $64B |
|
||
| Healthcare | 2 | $55B |
|
||
| Retail / Pharmacy | 1 | $148B |
|
||
| Agriculture / Food | 1 | $86B |
|
||
Price history
1 event — show timeline
- 2026-06-17 Listed $34,897 CIBR
Property tax history
-0.5%/yrLatest (2024): $1,200 · -2.7% YoY. Source: county tax records.
Cash-flow waterfall
monthlySold comps — $/sqft
last 12 mo · ≤1 miLoading sold comps…