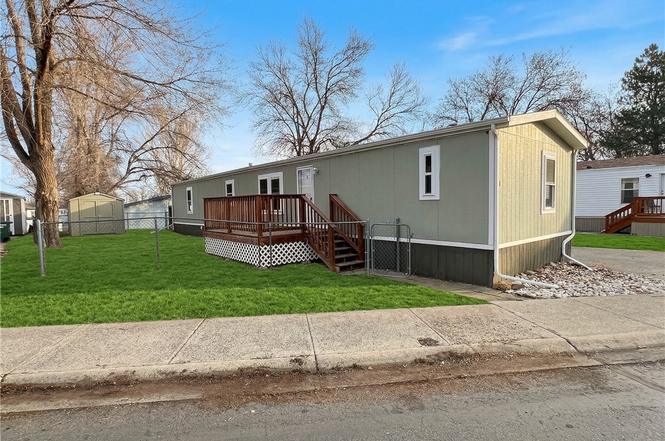
11 Prince of Wales Dr · Billings, MT
Flood risk 1/10 · Minimal
- FEMA flood zone
- X (unshaded)
- Chance of flooding over 30 yrs
- 0.0%
- Est. flood insurance / yr
- $507 – $1,088
Fire risk 3/10 · Minor
- Est. fire insurance / yr
- $918 – $1,706
Heat risk 3/10 · Minor
- Hot days now (above 95°F)
- 6 days/yr
- Hot days in 30 yrs
- 12 days/yr
Wind risk 1/10 · Minimal
- Chance of severe wind over 30 yrs
- —
Air-quality risk 4/10 · Minor
- Unhealthy air days now
- 3 days/yr
- Unhealthy air days in 30 yrs
- 5 days/yr
Risk factors via First Street. Map © Google.
Why this score? — see what drove the D grade
The composite is a weighted blend of 9 inputs, each scored 0–100. Each bar is that input's sub-score; the figure is the points it added to the 100-point composite (weight × sub-score).
- 1% rule +9.8/10.0
- Cash flow +8.7/30.0
- ARV discount +7.5/15.0
- Rent growth +4.5/5.0
- Livability +4.0/5.0
- Schools +3.2/10.0
- Condition / age +2.5/5.0
- DSCR +2.4/10.0
- Appreciation +0.0/10.0
$103,500
🖨 Deal sheet (PDF) 📄 Offer letter ✓ Due diligence
Listing remarks MLS
Welcome to a wonderful and affordable 1994 Homark Manufactured Home in Windsor Estates in the Height's. Clean and well taken care of 3 bedroom, 2 bath home with an open kitchen/ living room. Nice master suite with beautiful, remodeled bath and walk in closet. Attractive flooring is throughout! Gas forced air for heating and central air too! Well kept fenced yard and two storage sheds! Very quiet street with great neighbors! New buyers would need to be approved with the Windsor Estates Mobile Home Park 406-252-0881. Lot rent is $480 monthly and water/sewer is an additional $43 per average monthly . Application on ML. Not on an permanent foundation.
Key facts
- Remodeled bathroom
- Walk-in closet
- Two storage sheds
Tags
Property features AI
Finance
- HOA & community: Homeowners association with a monthly fee of $580 that includes trash service
Exterior
- Parking: No designated parking
- Utilities: Public water; Public sewer
- Home design: Manufactured home (single-family residence); One level
- Construction: Masonite exterior; Asphalt roof
- Exterior features: Deck; Fenced yard; Shed(s)
Interior
- Kitchen: Dishwasher; Electric range / Oven / Range; Refrigerator
- Bedrooms: Three main-level bedrooms
- Bathrooms: Two full bathrooms (both on the main level)
- Heating & cooling: Central air conditioning; Natural gas forced-air heating
- Interior features: Dishwasher; Electric range / Oven / Range; Refrigerator
- Laundry & utility: Washer hookup
Neighborhood map
What this means for you Summary
Snapshot
- This is a 3-bed/2.0-bath manufactured listed at $104k.
Deal economics
- At list price, monthly cash flow is $-87 ($-1k/yr) — negative.
- To cash-flow at today's rent, offer at most $91k (12.2% below list).
- Meets the 1% rule at list price ($2k rent vs $104k).
- Recommended offer: $91k (12.2% below list) — sets the bar for cash-flow.
- Cap rate 5.3% vs local median 3.0% in Billings — top-decile yield for the area; either an underpriced asset or a hidden risk that comps aren't pricing in. Stress-test before assuming the spread holds.
Location & tenants
- Location reads 80/100 on livability (#10 in MT, #1,830 nationally) — a professional / high-income tenant draw. Strengths: amenities A+, commute A+, housing A+; Watch: crime F.
- Billings H S (urban): math 29% / reading 45% proficiency, ranked #69 of 116 in MT (top 60%) — families likely to look elsewhere, expect single-tenant / working-renter base with shorter leases.
- Zoned schools: Bench School (math 37% / reading 32%, grade F, #197 of 293 statewide, top 71%, 339 students, 0% FRL); Castle Rock Middle School (math 40% / reading 42%, grade F, #58 of 146 statewide, top 39%, 703 students, 0% FRL); Skyview High School (math 26% / reading 39%, grade F, #56 of 132 statewide, top 42%, 1,602 students, 0% FRL).
- Market conditions: Rents rising fast (+7.8%/yr); 336 active listings in the ZIP; 13 comparable units currently listed for rent nearby; rentals at typical pace (median 15d on market — plan ~3-4 weeks tenant-placement turnaround); solid renter incomes; 1,401 units permitted in Yellowstone County in 2024 (281 in 5+ unit buildings).
Forward outlook
- Local home prices are declining (-3.0%/yr); year-one equity from $716 of loan paydown is wiped out by about $3k of value loss. Plan a longer hold.
- Yellowstone County population projected at +26% by 2050 — long-run rental-demand tailwind backs the buy-and-hold thesis.
Negotiation context
- It's been on market 109 days — a 9% lower offer ($94k) is reasonable based on typical stale-listing flexibility.
- 4 sale attempts since 8y ago; this cycle's ask has dropped $6k (5%) from the opening price — seller is motivated, your offer sets the floor, not the list.
Risks & watch-outs
- Watch-outs: HOA is 38% of rent.
Questions for the listing agent
- What do current leases actually rent for vs. the listed asking? Can we see a recent rent roll and the last 12 months of T-12 income?
- It's been on market 109 days. Have you received any prior offers? Is the seller open to a 12% concession, seller financing, or rate buy-down credit?
- What does the HOA fee cover, when was the last increase, and are there any pending special assessments or reserve-fund shortfalls?
- Why hasn't it sold? Are there any deal-killer items the seller is aware of (foundation, flood, title, zoning, code violations)?
- Is there a deadline driving the sale (1031 exchange, divorce, estate, relocation)? That informs how much negotiation room exists.
- Schools are D-rated, which usually means shorter tenancies and higher turnover. Who's the typical renter profile here, and what's been the actual vacancy rate?
- Crime grade is F in this area — have there been break-ins, vandalism, or insurance claims at this property in the last 3 years? What carrier currently insures it and at what premium?
- The area grade is low — what's the realistic commute time and amenity access for the typical tenant pool here? Any planned neighborhood developments (good or bad) we should know about?
- What's the average days-on-market for RENTAL listings here right now (not sales)? A rising rental-DOM trend means longer vacancies and softer asking-rent achievability than the comps imply.
- What's the recent tenant-quality profile in this submarket — average credit score on applications, eviction rate, late-payment / NSF rate, and stable-employment percentage? A property-management company in the area should have these aggregated.
- How much new for-sale + rental construction is in the pipeline within 1–3 miles? Heavy new supply typically softens prices + rents 12–24 months out; constrained supply supports both.
Investment metrics
- 1% rule
- 1.48% ✓
- Cap rate
- 5.28%
- Cash-on-cash
- -3.60%
- DSCR
- 0.84
- GRM
- 5.6
CMA / ARV
- ARV (on-the-fly)
- $66,464
- Comps found
- 12
Show comp detail 12 sales within ~0.75 mi
| Address | Dist | Beds/Ba | Sqft | Sold | Price | $/sf | Match |
|---|---|---|---|---|---|---|---|
| 10 Queen Victoria Pl | 0.06mi | 3/2.0 | 1,056 (-2%) | 9mo | $74,900 | $71 | 87 |
| 45 Prince Charles Dr | 0.09mi | 2/2.0 (-1) | 1,056 (-2%) | 6mo | $65,000 | $62 | 83 |
| 2 Prince Charles Dr | 0.09mi | 3/2.0 | 1,152 (+8%) | 1mo | $55,000 | $48 | 82 |
| 13 Prince of Wales Dr | 0.01mi | 3/2.0 | 929 (-13%) | 0mo | $55,000 | $59 | 77 |
| 183 Windsor Circle Cir S | 0.25mi | 2/2.0 (-1) | 1,088 (+2%) | 14mo | $134,900 | $124 | 69 |
| 2 Prince of Wales Dr Dr | 0.08mi | 3/2.0 | 1,216 (+13%) | 10mo | $134,900 | $111 | 66 |
| 26 Prince of Wales Dr | 0.06mi | 2/1.0 (-1) | 952 (-11%) | 6mo | $40,000 | $42 | 64 |
| 225 Windsor Cir N | 0.28mi | 3/2.0 | 1,216 (+13%) | 6mo | $153,000 | $126 | 60 |
| 114 Windsor Cir S | 0.32mi | 3/2.0 | 1,216 (+13%) | 4mo | $225,000 | $185 | 60 |
| 18 Prince Charles Dr | 0.11mi | 2/1.0 (-1) | 960 (-10%) | 13mo | $49,500 | $52 | 58 |
| 21 King Henry Pl | 0.18mi | 2/2.0 (-1) | 924 (-14%) | 12mo | $50,000 | $54 | 53 |
| 922 Yellowstone River Rd Rd Unit B-7 | 0.74mi | 3/2.0 | 1,216 (+13%) | 7mo | $67,500 | $56 | 38 |
Match score weights: distance 35% · size 25% · config 20% · recency 20%. Top-matched comps best support the ARV.
Projected returns pro-forma
-3.0% appreciation · 7.8% rent growth · sell at horizon
- IRR
- -12.5%
- Equity multiple
- 0.51×
- Total profit
- $-14,192
- Equity at exit
- $15,432
- IRR
- 5.8%
- Equity multiple
- 1.59×
- Total profit
- $17,142
- Equity at exit
- $8,949
Cash invested: $28,980 (down + closing). Projections, not guarantees.
Landlord ↔ Tenant lean methodology
- Overall (STATE)
- 82 Strongly Landlord-Friendly
- State Montana
- 82 Strongly Landlord-Friendly · R+11
- County
- — inherits STATE
- City
- — inherits STATE
ZIP-level market 59105
- Rents YoY
- 7.8%
- Active inventory
- 336
- Price-to-rent
- 5.6×
Monthly cashflow live
- Estimated rent
- $1,529 high interval (Pro) →
- Mortgage (P&I)
- −$543
- Tax est. 1.5%
- −$129 /mo · $1,552/yr
- Insurance
- −$43
- HOA
- −$580
- Vacancy / Maint / Mgmt
- −$321
- Net cashflow
- $-87
Break-even live
Sensitivity live
| Price | -10% $-16 | -5% $-51 | +0% $-87 | +5% $-123 | +10% $-159 |
|---|---|---|---|---|---|
| Rent | -10% $-208 | -5% $-147 | +0% $-87 | +5% $-27 | +10% $34 |
| Rate | -1.0pp $-35 | -0.5pp $-61 | base $-87 | +0.5pp $-114 | +1.0pp $-141 |
UW: 25.0% down · 7.5% · 30yr · 1.5% tax · 5.0% vac · 8.0% maint · 8.0% mgmt
Financing live
Cash to close
- Down payment
- $25,875
- Closing costs
- $3,105
- Reserves months
- —
- Total cash needed
- —
Loan-product check · same deal, 3 products live
Conventional
25% down · 7.5% · 30yr
- Down + closing
- —
- Monthly P&I
- —
- Monthly cashflow
- —
- DSCR
- —
- Eligible?
- —
Personal DTI + credit; lowest rate.
DSCR
20% down · 8.5% · 30yr
- Down + closing
- —
- Monthly P&I
- —
- Monthly cashflow
- —
- DSCR
- —
- Eligible?
- —
No personal income docs; deal must DSCR.
Hard money
10% down · 12.0% · 12mo
- Down + closing
- —
- Monthly P&I
- —
- Monthly cashflow
- —
- DSCR
- —
- Eligible?
- —
Short-term bridge; refi at stabilization.
Rent comps 13 comps
| Address | Beds | Baths | Sqft | Rent | $/sqft | DOM | Units | Dist |
|---|---|---|---|---|---|---|---|---|
| 343 Quaking Aspen Ln Billings, MT | 3.0 | 2.0 | 1295 | $1,495 | $1.15 | 15d | 1 | 0.13mi |
| 504 Josephine Dr Billings, MT | 2.0 | 2.0 | 1070 | $1,075 | $1.00 | 15d | 1 | 0.28mi |
| 218 Reda Ln #3 Billings, MT | 3.0 | 2.5 | 1496 | $2,100 | $1.40 | 15d | 1 | 0.29mi |
| 218 Reda Ln Unit 7 Billings, MT | 3.0 | 2.5 | 1496 | $1,700 | $1.14 | 15d | 1 | 0.29mi |
| 218 Reda Ln Billings, MT | 3.0 | 2.0 | 1496 | $2,100 | $1.40 | 15d | 1 | 0.29mi |
| 640 Lake Elmo Dr Billings, MT | 2.0 | 2.0 | 1200 | $1,200 | $1.00 | 15d | 1 | 0.43mi |
| 308 Uinta Park Dr Billings, MT | 3.0 | 2.0 | 1424 | $2,050 | $1.44 | 15d | 1 | 0.51mi |
| 66 W Antelope Trl Billings, MT | 2.0 | 1.0 | 900 | $1,195 | $1.33 | 15d | 1 | 0.54mi |
| 828 Yellowstone River Rd Unit 828YYR4 Billings, MT | 2.0 | 1.0 | 925 | $1,095 | $1.18 | 45d | 1 | 0.75mi |
| 922 Yellowstone River Rd Billings, MT | 2.0 | 2.0 | 1200 | $1,195 | $1.00 | 15d | 1 | 0.75mi |
| 836 Yellowstone River Rd Billings, MT | 2.0 | 1.0 | 800 | $995 | $1.24 | 45d | 1 | 0.76mi |
| 1431 Sourdough Ln Unit 3 Billings, MT | 2.0 | 1.0 | 1200 | $1,150 | $0.96 | 15d | 1 | 0.77mi |
| 1071 Lincoln Ln Billings, MT | 4.0 | 2.0 | 1386 | $2,095 | $1.51 | 15d | 1 | 0.78mi |
HOA detail
- Monthly dues
- $580 · $6,960/yr
- Likely covers
- watersewergas
Listing history 26 events
-
2026-06-21days on market $103,500 Active 109 DOM
-
2026-06-19days on market $103,500 Active 107 DOM
-
2026-06-18days on market $103,500 Active 106 DOM
-
2026-06-17days on market $103,500 Active 105 DOM
-
2026-06-16days on market $103,500 Active 104 DOM
-
2026-06-15days on market $103,500 Active 103 DOM
-
2026-06-14days on market $103,500 Active 101 DOM
-
2026-06-13days on market $103,500 Active 100 DOM
-
2026-06-10days on market $103,500 Active 98 DOM
-
2026-06-09days on market $103,500 Active 97 DOM
-
2026-06-08days on market $103,500 Active 96 DOM
-
2026-06-07days on market $103,500 Active 95 DOM
-
2026-06-05days on market $103,500 Active 92 DOM
-
2026-06-02days on market $103,500 Active 90 DOM
-
2026-06-01days on market $103,500 Active 89 DOM
-
2026-05-31days on market $103,500 Active 88 DOM
-
2026-05-30days on market $103,500 Active 87 DOM
-
2026-05-15price $103,500
-
2026-03-04$109,000 Active
-
2023-06-09soldstatus Closed 655-char remark
Show marketing remark (655 chars)
Welcome to a wonderful and affordable 1994 Homark Manufactured Home in Windsor Estates in the Height's. Clean and well taken care of 3 bedroom, 2 bath home with an open kitchen/ living room. Nice master suite with beautiful, remodeled bath and walk in closet. Attractive flooring is throughout! Gas forced air for heating and central air too! Well kept fenced yard and two storage sheds! Very quiet street with great neighbors! New buyers would need to be approved with the Windsor Estates Mobile Home Park 406-252-0881. Lot rent is $480 monthly and water/sewer is an additional $43 per average monthly . Application on ML. Not on an permanent foundation.
-
2023-05-16historical Active Under Contract 655-char remark
Show marketing remark (655 chars)
Welcome to a wonderful and affordable 1994 Homark Manufactured Home in Windsor Estates in the Height's. Clean and well taken care of 3 bedroom, 2 bath home with an open kitchen/ living room. Nice master suite with beautiful, remodeled bath and walk in closet. Attractive flooring is throughout! Gas forced air for heating and central air too! Well kept fenced yard and two storage sheds! Very quiet street with great neighbors! New buyers would need to be approved with the Windsor Estates Mobile Home Park 406-252-0881. Lot rent is $480 monthly and water/sewer is an additional $43 per average monthly . Application on ML. Not on an permanent foundation.
-
2023-05-06$79,500 Active 655-char remark
Show marketing remark (655 chars)
Welcome to a wonderful and affordable 1994 Homark Manufactured Home in Windsor Estates in the Height's. Clean and well taken care of 3 bedroom, 2 bath home with an open kitchen/ living room. Nice master suite with beautiful, remodeled bath and walk in closet. Attractive flooring is throughout! Gas forced air for heating and central air too! Well kept fenced yard and two storage sheds! Very quiet street with great neighbors! New buyers would need to be approved with the Windsor Estates Mobile Home Park 406-252-0881. Lot rent is $480 monthly and water/sewer is an additional $43 per average monthly . Application on ML. Not on an permanent foundation.
-
2022-07-13soldstatus 605-char remark
Show marketing remark (605 chars)
Welcome to a wonderful and affordable 1994 Homark Manufactured Home in Windsor Estates in the Height's. Clean and well taken care of 3 bedroom, 2 bath home with an open kitchen/ living room. Nice master suite with beautiful, remodeled bath and walk in closet. Attractive flooring is throughout! Gas forced air for heating and central air too! Well kept fenced yard and two storage sheds! Very quiet street with great neighbors! New buyers would need to be approved with the Windsor Estates Mobile Home Park 406-252-0881. Lot rent is $430 monthly and water/sewer is an additional $70 per average monthly.
-
2022-06-10$74,900 605-char remark
Show marketing remark (605 chars)
Welcome to a wonderful and affordable 1994 Homark Manufactured Home in Windsor Estates in the Height's. Clean and well taken care of 3 bedroom, 2 bath home with an open kitchen/ living room. Nice master suite with beautiful, remodeled bath and walk in closet. Attractive flooring is throughout! Gas forced air for heating and central air too! Well kept fenced yard and two storage sheds! Very quiet street with great neighbors! New buyers would need to be approved with the Windsor Estates Mobile Home Park 406-252-0881. Lot rent is $430 monthly and water/sewer is an additional $70 per average monthly.
-
2018-05-04soldstatus
-
2018-04-03$25,000
ⓘ Source: listings_history table (triggers on properties + properties_extension) + one-shot
backfill from property_details.listing_events for pre-trigger history.
Climate risk First Street
- Flood 1/10 Low FEMA zone X (unshaded) · 0% chance over 30 yrs
- Wildfire 3/10 Moderate
- Heat 3/10 Moderate 6 d/yr ≥95°F today · 12 d/yr by 30 yrs out
- Wind 1/10 Low
- Air quality 4/10 Moderate 3 unhealthy d/yr today · 5 by 30 yrs out
Nearby sold comps map
Loading sold comps map…
Walkable amenities ~0.75 mi
Loading nearby amenities…
Taxation est. · year 1
- Rental income
- $18,353
- − Mortgage interest
- −$5,798
- − Property taxes
- −$1,552
- − Insurance
- −$518
- − Repairs & maintenance
- −$1,468
- − Management
- −$1,468
- − HOA
- −$6,960
- − Depreciation
- −$3,011
- Taxable loss
- −$2,422
- Est. tax savings @ 24.0%
- +$581
- After-tax cash flow
- $-463/yr
For passive investors: Depreciation is non-cash, so a rental often shows a tax loss while cash-flowing — sheltering income. Rental losses are passive: they offset passive income freely, and up to $25,000/yr can offset ordinary (W-2) income if you actively participate and your MAGI is under $100k (phasing out to $0 by $150k); unused losses carry forward. On sale, claimed depreciation is recaptured at up to 25%, and gains may owe capital-gains tax (a 1031 exchange can defer both). Figures are a year-1 estimate at your 24.0% rate — not tax advice; consult a CPA.
Schools (NCES district)
- District
- Billings H S
- NCES district ID
- 3003900
- Math proficiency
- 29% ▼ -4.00%
- Reading proficiency
- 45% ▲ 2.00%
- Median HH income
- $49,863
- Composite
- 31.93/100
- National rank
- #5848
- State rank
- #69 of 116 in MT
Livability — Billings
- Score
- 80/100
- State rank
- #10
- US rank
- #1830
Category grades
Schools grade is shown separately in the Schools card above.
Census & demographics
- Census place
- Billings, MT
- County
- Yellowstone County · 159,426 people
- City population
- 147,124
- Metro
- Billings, MT
- Population (ZIP)
- 35,480
- Household income
- $78,014
- Rent vs Own
- Severe rent burden
- 788.0
Population outlook (Yellowstone County) Hauer SSP2
- Today (2025)
- 176,227 people
- By 2030
- 185,619 · +5.3%
- By 2040
- 203,543 · +15.5%
- By 2050
- 221,100 · +25.5%
- By 2075
- 266,931 · +51.5%
- By 2100
- 301,141 · +70.9%
Race, ethnicity, and origin ACS 2023
- Neighborhood character
- Predominantly White (85%)
- Race & ethnicity
- White 85% Hispanic / Latino 7% Two or more races 5% Native American 4%
- Hispanic origin (detail)
- Mexican 5%
- Common ancestry
- Portuguese 10% Slovak 3% Lithuanian 3%
- Foreign-born
- 1% · Canada
- Languages at home
- 97% English-only · Spanish 1%
Political lean MEDSL · Yellowstone
- 2024 margin
- Strong R (+27.1) · D 34.9% · R 62.0% · Other 3.1%
- 2008→2024 swing
- -20.8pp toward R · 2008: -6.3pp · 2024: -27.1pp
- All cycles
- 2024: R+27.1 2020: R+24.0 2016: R+27.1 2012: R+20.6 2008: R+6.3
Not yet ingested
- Civics
- —
Market trends
- HPI YoY
- ▼ -314.00%
- Current HPI
- 217.0836
- Rent YoY
- ▲ 7.80%
- Metro
- Billings, MT
- State GDP YoY
- ▲ 3.41%
- F500 in state
- 2
Industry mix (Fortune 500 HQ in MT)
| Industry | F500 HQs | Revenue |
|---|---|---|
| Technology / Analytics | 1 | $2B |
|
||
Price history
+314.0% since first listed9 events — show timeline
- 2026-05-15 Price Changed $103,500 BMTMLS
- 2026-03-04 Listed $109,000 BMTMLS
- 2023-06-09 Sold (MLS) — BMTMLS
- 2023-05-16 Contingent — BMTMLS
- 2023-05-06 Listed $79,500 BMTMLS
- 2022-07-13 Sold (MLS) — BMTMLS
- 2022-06-10 Listed $74,900 BMTMLS
- 2018-05-04 Sold (MLS) — BMTMLS
- 2018-04-03 Listed $25,000 BMTMLS
Cash-flow waterfall
monthlySold comps — $/sqft
last 12 mo · ≤1 miLoading sold comps…