8802 66th St SE · Forest Hills, MI
Flood risk 1/10 · Minimal
- FEMA flood zone
- X (unshaded)
- Chance of flooding over 30 yrs
- 0.0%
- Est. flood insurance / yr
- $507 – $1,088
Fire risk 1/10 · Minimal
- Est. fire insurance / yr
- $784 – $1,456
Heat risk 2/10 · Minimal
- Hot days now (above 97°F)
- 7 days/yr
- Hot days in 30 yrs
- 16 days/yr
Wind risk 2/10 · Minimal
- Chance of severe wind over 30 yrs
- —
Air-quality risk 2/10 · Minimal
- Unhealthy air days now
- 1 days/yr
- Unhealthy air days in 30 yrs
- 1 days/yr
Risk factors via First Street. Map © Google.
Why this score? — see what drove the C grade
The composite is a weighted blend of 9 inputs, each scored 0–100. Each bar is that input's sub-score; the figure is the points it added to the 100-point composite (weight × sub-score).
- Cash flow +16.8/30.0
- Appreciation +7.6/10.0
- ARV discount +7.5/15.0
- Schools +5.6/10.0
- DSCR +5.2/10.0
- Livability +3.8/5.0
- 1% rule +3.7/10.0
- Rent growth +2.5/5.0
- Condition / age +2.5/5.0
$159,900
🖨 Deal sheet 📄 Offer letter ✓ Due diligence
Listing remarks MLS
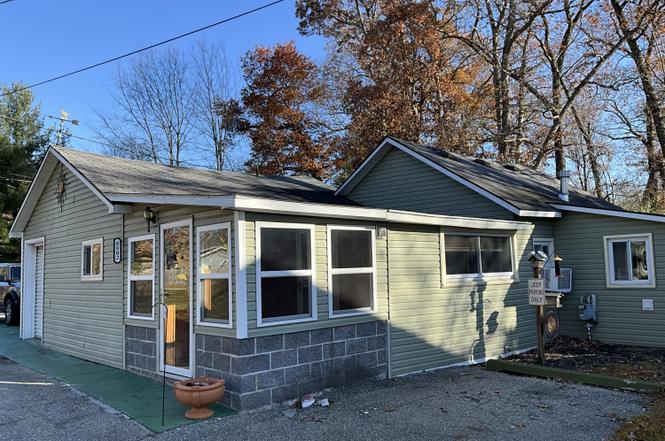
Affordable efficient home. Campau Lake Deeded access, easement with no docking rights. Private drive. One bedroom, Large living area, laundry room, enclosed porch, storage and workshop area. Newer siding. Nice patio outside with a shed. Nice view.
Key facts
- Newer siding
- Nice patio
- Enclosed porch
Tags
Neighborhood map
What this means for you Summary
Snapshot
- This is a 1-bed/1.0-bath single-family listed at $160k.
Deal economics
- At list price, monthly cash flow is $102 ($1k/yr) — positive.
- The deal already cash-flows at list — no discount required.
- To meet the 1% rule (rent ≥ 1% of price), the offer needs to be $139k (13.3% below list).
- Recommended offer: $139k (13.3% below list) — sets the bar for 1% rule.
- Cap rate 7.1% vs local median 2.8% in Forest Hills — top-decile yield for the area; either an underpriced asset or a hidden risk that comps aren't pricing in. Stress-test before assuming the spread holds.
Location & tenants
- Location reads 76/100 on livability (#139 in MI, #3,404 nationally) — a middle-class / working-renter tenant base. Strengths: schools A+, employment A+, housing A+; Watch: cost of living C-, amenities F, commute F.
- Caledonia Community Schools (suburban): math 58% / reading 68% proficiency, ranked #26 of 540 in MI (top 5%) — acceptable for families but not a draw, mixed tenant base, ~2y average lease; only 13% free/reduced lunch — higher-income household profile.
- Market conditions: 76 active listings in the ZIP; 2,253 units permitted in Kent County in 2024 (969 in 5+ unit buildings).
Forward outlook
- In year one you build about $9k of equity ($1k loan paydown + $8k appreciation (5.2% local appreciation)).
- Kent County population projected at +22% by 2050 — long-run rental-demand tailwind backs the buy-and-hold thesis.
- At projected returns (5.2% appreciation + 3.0% rent growth), your $45k cash investment doubles in ~4 years — after that, you're playing with house money.
- By year 4, paydown + projected appreciation supports a ~$32k cash-out refi (75% LTV) — recoverable capital for the next deal without selling this one.
Negotiation context
- It's been on market 121 days — a 12% lower offer ($141k) is reasonable based on typical stale-listing flexibility.
- 19 sale attempts since 37y ago with the ask held roughly flat each time — persistent listings suggest the price (not the market) is what's stuck; bring a comps-based counter.
- Current owner paid $25k; list at $160k implies a 540% gain — meaningful room to come down on a strong offer.
Risks & watch-outs
- Watch-outs: built in 1950 — expect roof / HVAC / electrical / plumbing capex.
Questions for the listing agent
- It's been on market 121 days. Have you received any prior offers? Is the seller open to a 13% concession, seller financing, or rate buy-down credit?
- Built in 1950 — when were the roof, HVAC, electrical panel, plumbing, and water heater last replaced?
- Why hasn't it sold? Are there any deal-killer items the seller is aware of (foundation, flood, title, zoning, code violations)?
- Is there a deadline driving the sale (1031 exchange, divorce, estate, relocation)? That informs how much negotiation room exists.
- Schools are A-rated — typically a magnet for longer-tenancy family renters. What's the average tenant stay here, and is there a school-zone premium baked into asking?
- What's the average days-on-market for RENTAL listings here right now (not sales)? A rising rental-DOM trend means longer vacancies and softer asking-rent achievability than the comps imply.
- What's the recent tenant-quality profile in this submarket — average credit score on applications, eviction rate, late-payment / NSF rate, and stable-employment percentage? A property-management company in the area should have these aggregated.
- How much new for-sale + rental construction is in the pipeline within 1–3 miles? Heavy new supply typically softens prices + rents 12–24 months out; constrained supply supports both.
Investment metrics
- 1% rule
- 0.87% ✗
- Cap rate
- 7.06%
- Cash-on-cash
- 2.73%
- DSCR
- 1.12
- GRM
- 9.6
CMA / ARV
No comps found within radius.
Projected returns pro-forma
5.17% appreciation · 3.0% rent growth · sell at horizon
- IRR
- 15.6%
- Equity multiple
- 2.00×
- Total profit
- $44,836
- Equity at exit
- $92,265
- IRR
- 16.0%
- Equity multiple
- 3.89×
- Total profit
- $129,169
- Equity at exit
- $160,619
Cash invested: $44,772 (down + closing). Projections, not guarantees.
Landlord ↔ Tenant lean methodology
- Overall (STATE)
- 62 Landlord-Friendly
- State Michigan
- 62 Landlord-Friendly · EVEN
- County
- — inherits STATE
- City
- — inherits STATE
ZIP-level market 49302
- Home prices YoY
- 1.1%
- Active inventory
- 76
- Price-to-rent
- 9.6×
Monthly cashflow live
- Estimated rent
- $1,387 medium interval (Pro) →
- Mortgage (P&I)
- −$839
- Tax from tax record
- −$89 /mo · $1,066/yr
- Insurance
- −$67
- HOA
- −$0
- Vacancy / Maint / Mgmt
- −$291
- Net cashflow
- $102
Break-even live
UW: 25.0% down · 7.5% · 30yr · 1.5% tax · 5.0% vac · 8.0% maint · 8.0% mgmt
Financing live
Cash to close
- Down payment
- $39,975
- Closing costs
- $4,797
- Reserves months
- —
- Total cash needed
- —
Loan-product check · same deal, 3 products live
Conventional
25% down · 7.5% · 30yr
- Down + closing
- —
- Monthly P&I
- —
- Monthly cashflow
- —
- DSCR
- —
- Eligible?
- —
Personal DTI + credit; lowest rate.
DSCR
20% down · 8.5% · 30yr
- Down + closing
- —
- Monthly P&I
- —
- Monthly cashflow
- —
- DSCR
- —
- Eligible?
- —
No personal income docs; deal must DSCR.
Hard money
10% down · 12.0% · 12mo
- Down + closing
- —
- Monthly P&I
- —
- Monthly cashflow
- —
- DSCR
- —
- Eligible?
- —
Short-term bridge; refi at stabilization.
Listing history 37 events
-
2026-03-22status Pending 247-char remark
Show marketing remark (247 chars)
Affordable efficient home. Campau Lake Deeded access, easement with no docking rights. Private drive. One bedroom, Large living area, laundry room, enclosed porch, storage and workshop area. Newer siding. Nice patio outside with a shed. Nice view.
-
2026-03-22status Pending
Show marketing remark (247 chars)
Affordable efficient home. Campau Lake Deeded access, easement with no docking rights. Private drive. One bedroom, Large living area, laundry room, enclosed porch, storage and workshop area. Newer siding. Nice patio outside with a shed. Nice view.
-
2025-11-21$159,900 Active 247-char remark
Show marketing remark (247 chars)
Affordable efficient home. Campau Lake Deeded access, easement with no docking rights. Private drive. One bedroom, Large living area, laundry room, enclosed porch, storage and workshop area. Newer siding. Nice patio outside with a shed. Nice view.
-
2025-11-20$159,900 Active 247-char remark
Show marketing remark (247 chars)
Affordable efficient home. Campau Lake Deeded access, easement with no docking rights. Private drive. One bedroom, Large living area, laundry room, enclosed porch, storage and workshop area. Newer siding. Nice patio outside with a shed. Nice view.
-
2025-11-20$159,900 Active
Show marketing remark (247 chars)
Affordable efficient home. Campau Lake Deeded access, easement with no docking rights. Private drive. One bedroom, Large living area, laundry room, enclosed porch, storage and workshop area. Newer siding. Nice patio outside with a shed. Nice view.
-
2025-05-24status Pending
-
2025-05-24status Pending
-
2025-05-24historical
-
2025-05-22$120,000 Active
-
2025-05-22$120,000 Active
-
2015-01-24historical
-
2015-01-24historical
-
2015-01-24historical
-
2015-01-24historical
-
2012-03-30historical
-
2012-03-24soldstatus $25,000
-
2012-03-24soldstatus $25,000
-
2011-12-12$33,900
-
2011-12-12$33,900
-
2011-09-02$49,900
-
2011-09-02$49,900
-
1996-04-04soldstatus $60,000
-
1996-04-04soldstatus $60,000
-
1995-11-13$62,900
-
1995-11-13$62,900
-
1993-10-05historical
-
1993-04-05$58,000
-
1993-04-05$58,000
-
1992-11-12historical
-
1992-11-12historical
-
1992-05-12$58,000
-
1992-05-12$58,000
-
1992-05-12$58,000
-
1992-05-12$58,000
-
1989-03-02$52,900
-
1989-03-02$52,900
ⓘ Source: listings_history table (triggers on properties + properties_extension) + one-shot
backfill from property_details.listing_events for pre-trigger history.
Tax reassessment forecast MI · Partial reset (capped growth)
- Current annual tax
- $1,066 · $89/mo
- Projected year-2 tax
- $1,764 · $147/mo
- Expected delta
- +$698/yr (+$58/mo · 65.5%)
ⓘ Screening estimate from a state-policy table — verify with the county assessor before closing.
Climate risk First Street
- Flood 1/10 Low FEMA zone X (unshaded) · 0% chance over 30 yrs
- Wildfire 1/10 Low
- Heat 2/10 Low 7 d/yr ≥97°F today · 16 d/yr by 30 yrs out
- Wind 2/10 Low
- Air quality 2/10 Low 1 unhealthy d/yr today · 1 by 30 yrs out
Nearby sold comps map
Loading sold comps map…
Walkable amenities ~0.75 mi
Loading nearby amenities…
Taxation est. · year 1
- Rental income
- $16,643
- − Mortgage interest
- −$8,957
- − Property taxes
- −$1,066
- − Insurance
- −$800
- − Repairs & maintenance
- −$1,331
- − Management
- −$1,331
- − Depreciation
- −$4,652
- Taxable loss
- −$1,494
- Est. tax savings @ 24.0%
- +$358
- After-tax cash flow
- $1,579/yr
For passive investors: Depreciation is non-cash, so a rental often shows a tax loss while cash-flowing — sheltering income. Rental losses are passive: they offset passive income freely, and up to $25,000/yr can offset ordinary (W-2) income if you actively participate and your MAGI is under $100k (phasing out to $0 by $150k); unused losses carry forward. On sale, claimed depreciation is recaptured at up to 25%, and gains may owe capital-gains tax (a 1031 exchange can defer both). Figures are a year-1 estimate at your 24.0% rate — not tax advice; consult a CPA.
Schools (NCES district)
- District
- Caledonia Community Schools
- NCES district ID
- 2607620
- Math proficiency
- 58% ▲ 2.00%
- Reading proficiency
- 68% ▲ 1.00%
- Median HH income
- $75,649
- Composite
- 55.98/100
- National rank
- #1196
- State rank
- #26 of 540 in MI
Livability — Forest Hills
- Score
- 76/100
- State rank
- #139
- US rank
- #3404
Category grades
Schools grade is shown separately in the Schools card above.
Census & demographics
- City population
- 53,921
- Population (ZIP)
- 9,657
Population outlook (Kent County) Hauer SSP2
- Today (2025)
- 712,484 people
- By 2030
- 748,618 · +5.1%
- By 2040
- 814,777 · +14.4%
- By 2050
- 868,556 · +21.9%
- By 2075
- 966,487 · +35.7%
- By 2100
- 967,975 · +35.9%
Race, ethnicity, and origin ACS 2023
- Neighborhood character
- Predominantly White (95%)
- Race & ethnicity
- White 95% Two or more races 3% Hispanic / Latino 2% Asian 1%
- Common ancestry
- Iranian 17% Romanian 6% Italian 6%
- Foreign-born
- 2% · Canada, South Korea
- Languages at home
- 97% English-only · Spanish 1% Other Indo-European 1%
Political lean MEDSL · Kent
- 2024 margin
- Lean D (+5.4) · D 51.8% · R 46.5% · Other 1.7%
- 2008→2024 swing
- +4.8pp toward D · 2008: 0.5pp · 2024: 5.4pp
- All cycles
- 2024: D+5.4 2020: D+6.1 2016: R+3.1 2012: R+7.9 2008: D+0.5
Not yet ingested
- Civics
- —
Market trends
- HPI YoY
- ▲ 5.17%
- Current HPI
- 481.04
- Rent YoY
- —
- Metro
- —
- State GDP YoY
- ▲ 1.37%
- F500 in state
- 28
Industry mix (Fortune 500 HQ in MI)
| Industry | F500 HQs | Revenue |
|---|---|---|
| Automotive Parts | 3 | $48B |
|
||
| Automotive | 2 | $372B |
|
||
| Chemicals | 1 | $45B |
|
||
| Automotive Retail | 1 | $29B |
|
||
| Healthcare / Medical Devices | 1 | $23B |
|
||
| Automotive Technology | 1 | $20B |
|
||
Price history
+202.3% since first listed37 events — show timeline
- 2026-03-22 Pending — REALCOMP
- 2026-03-22 Pending — MiRealSource-MiMLS
- 2026-03-22 Pending — SW Michigan MLS
- 2025-11-21 Listed $159,900 REALCOMP
- 2025-11-20 Listed $159,900 SW Michigan MLS
- 2025-11-20 Listed $159,900 MiRealSource-MiMLS
- 2025-05-24 Pending — REALCOMP
- 2025-05-24 Pending — MiRealSource-MiMLS
- 2025-05-24 Listing Removed — MiRealSource-MiMLS
- 2025-05-22 Listed $120,000 REALCOMP
- 2025-05-22 Listed $120,000 MiRealSource-MiMLS
- 2015-01-24 Listing Removed — SW Michigan MLS
- 2015-01-24 Listing Removed — SW Michigan MLS
- 2015-01-24 Listing Removed — SW Michigan MLS
- 2015-01-24 Listing Removed — SW Michigan MLS
- 2012-03-30 Listing Removed — REALCOMP
- 2012-03-24 Sold (MLS) $25,000 REALCOMP
- 2012-03-24 Sold (MLS) $25,000 SW Michigan MLS
- 2011-12-12 Listed $33,900 REALCOMP
- 2011-12-12 Listed $33,900 SW Michigan MLS
- 2011-09-02 Listed $49,900 REALCOMP
- 2011-09-02 Listed $49,900 SW Michigan MLS
- 1996-04-04 Sold (MLS) $60,000 REALCOMP
- 1996-04-04 Sold (MLS) $60,000 SW Michigan MLS
- 1995-11-13 Listed $62,900 REALCOMP
- 1995-11-13 Listed $62,900 SW Michigan MLS
- 1993-10-05 Listing Removed — REALCOMP
- 1993-04-05 Listed $58,000 REALCOMP
- 1993-04-05 Listed $58,000 SW Michigan MLS
- 1992-11-12 Listing Removed — REALCOMP
- 1992-11-12 Listing Removed — REALCOMP
- 1992-05-12 Listed $58,000 REALCOMP
- 1992-05-12 Listed $58,000 REALCOMP
- 1992-05-12 Listed $58,000 SW Michigan MLS
- 1992-05-12 Listed $58,000 SW Michigan MLS
- 1989-03-02 Listed $52,900 REALCOMP
- 1989-03-02 Listed $52,900 SW Michigan MLS
Property tax history
-0.6%/yrLatest (2025): $1,066 · -29.2% YoY. Source: county tax records.
Cash-flow waterfall
monthlySold comps — $/sqft
last 12 mo · ≤1 miLoading sold comps…