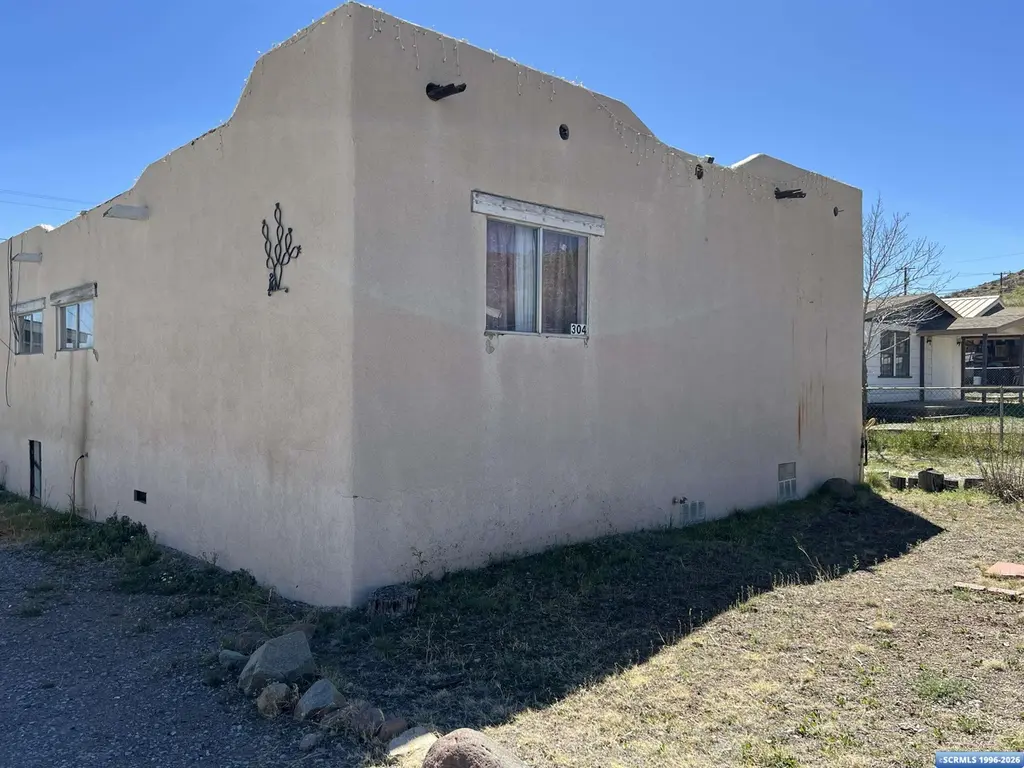
304 Stewart St · Bayard, NM
Flood risk 1/10 · Minimal
- FEMA flood zone
- X (unshaded)
- Chance of flooding over 30 yrs
- 0.0%
- Est. flood insurance / yr
- $507 – $1,088
Fire risk 10/10 · Severe
- Est. fire insurance / yr
- $706 – $1,312
Heat risk 3/10 · Minor
- Hot days now (above 90°F)
- 6 days/yr
- Hot days in 30 yrs
- 18 days/yr
Wind risk 1/10 · Minimal
- Chance of severe wind over 30 yrs
- —
Air-quality risk 3/10 · Minor
- Unhealthy air days now
- 2 days/yr
- Unhealthy air days in 30 yrs
- 3 days/yr
Risk factors via First Street. Map © Google.
Why this score? — see what drove the B grade
The composite is a weighted blend of 9 inputs, each scored 0–100. Each bar is that input's sub-score; the figure is the points it added to the 100-point composite (weight × sub-score).
- Cash flow +28.4/30.0
- DSCR +10.0/10.0
- Appreciation +9.0/10.0
- ARV discount +7.5/15.0
- 1% rule +6.8/10.0
- Livability +3.2/5.0
- Rent growth +2.5/5.0
- Condition / age +2.5/5.0
- Schools +2.2/10.0
$98,000
🖨 Deal sheet 📄 Offer letter ✓ Due diligence
Listing remarks
Split-level 3 bedroom, 1 3/4 bath home in Bayard. This home has nice tile through out the home. It feels spacious and has a open lay-out for the dining room and kitchen. Seller has a good start on the renovations. Seller has purchased new windows and new doors and these will be available for the new owners. It is unusual to see central air conditioning and central heat in this price range. Come take a look today! This home was originally a manufactured home built prior to June of 1976 and will only qualify for cash or an in-house loan. Seller will entertain all offers. Seller will entertain owner-financing with $20,000 down.
Key facts
- Tile throughout
- Central heat
- Open lay-out
Tags
Property features AI
Exterior
- Parking: No garage
- Utilities: Public water; Public sewer; Electricity available; Natural gas available; Cable available; Phone available
- Home design: Manufactured home (residential); Flat roof
- Construction: Stucco exterior
- Exterior features: Chain link fencing; Paved road access
Interior
- Kitchen: Refrigerator
- Flooring: Ceramic tile
- Bathrooms: 1 full bathroom; 1 three-quarter bathroom
- Heating & cooling: Central air conditioning; Forced air heating
- Interior features: Insulated double-pane windows; Refrigerator included; Ceramic tile flooring
Neighborhood map
What this means for you Summary
Snapshot
- This is a 3-bed/2.0-bath single-family listed at $98k.
Deal economics
- At list price, monthly cash flow is $318 ($4k/yr) — positive.
- The deal already cash-flows at list — no discount required.
- Meets the 1% rule at list price ($1k rent vs $98k).
- Recommended offer: $95k (3.0% below list) — sets the bar for market timing.
Location & tenants
- Location reads 64/100 on livability (#64 in NM) — a middle-class / working-renter tenant base. Strengths: cost of living A+, housing A+; Watch: crime F, amenities F, commute F.
- Cobre Consolidated Schools (town): math 13% / reading 33% proficiency, ranked #56 of 95 in NM (top 59%) — low school quality limits family demand, transient renter base, plan for 1-2y turnover; 92% free/reduced lunch — lower-income household profile, screen leases tightly.
- Zoned schools: Bayard Elementary (170 students, 100% FRL); Cobre High (276 students, 100% FRL).
- Market conditions: 10 active listings in the ZIP.
Forward outlook
- In year one you build about $9k of equity ($678 loan paydown + $8k appreciation (8.0% local appreciation)).
- Grant County population projected at -21% by 2050 — secular population decline; favor cash flow + early exit over multi-decade hold.
- At projected returns (8.0% appreciation + 3.0% rent growth), your $27k cash investment doubles in ~3 years — after that, you're playing with house money.
- By year 5, paydown + projected appreciation supports a ~$39k cash-out refi (75% LTV) — recoverable capital for the next deal without selling this one.
Negotiation context
- It's been on market 42 days — a 3% lower offer ($95k) is reasonable based on typical stale-listing flexibility.
- 4 sale attempts since 2y ago; this cycle's ask is 24% above the opening price — seller raised mid-cycle; expect resistance to lowballs.
Risks & watch-outs
- Climate carrying-cost: severe wildfire risk — expect insurance premiums to compound above CPI over the hold.
Questions for the listing agent
- It's been on market 42 days. Have you received any prior offers? Is the seller open to a 3% concession, seller financing, or rate buy-down credit?
- Built in 1976 — when were the roof, HVAC, electrical panel, plumbing, and water heater last replaced?
- Is there a deadline driving the sale (1031 exchange, divorce, estate, relocation)? That informs how much negotiation room exists.
- Schools are F-rated, which usually means shorter tenancies and higher turnover. Who's the typical renter profile here, and what's been the actual vacancy rate?
- Crime grade is F in this area — have there been break-ins, vandalism, or insurance claims at this property in the last 3 years? What carrier currently insures it and at what premium?
- What's the average days-on-market for RENTAL listings here right now (not sales)? A rising rental-DOM trend means longer vacancies and softer asking-rent achievability than the comps imply.
- What's the recent tenant-quality profile in this submarket — average credit score on applications, eviction rate, late-payment / NSF rate, and stable-employment percentage? A property-management company in the area should have these aggregated.
- How much new for-sale + rental construction is in the pipeline within 1–3 miles? Heavy new supply typically softens prices + rents 12–24 months out; constrained supply supports both.
Investment metrics
- 1% rule
- 1.18% ✓
- Cap rate
- 10.19%
- Cash-on-cash
- 13.91%
- DSCR
- 1.62
- GRM
- 7.0
CMA / ARV
No comps found within radius.
Projected returns pro-forma
8.01% appreciation · 3.0% rent growth · sell at horizon
- IRR
- 30.8%
- Equity multiple
- 3.21×
- Total profit
- $60,660
- Equity at exit
- $74,526
- IRR
- 27.5%
- Equity multiple
- 6.86×
- Total profit
- $160,891
- Equity at exit
- $148,004
Cash invested: $27,440 (down + closing). Projections, not guarantees.
Landlord ↔ Tenant lean methodology
- Overall (STATE)
- 55 Moderately Landlord-Leaning
- State New Mexico
- 55 Moderately Landlord-Leaning · D+3
- County
- — inherits STATE
- City
- — inherits STATE
ZIP-level market 88023
- Home prices YoY
- 4.8%
- Active inventory
- 10
- Price-to-rent
- 7.0×
Monthly cashflow live
- Estimated rent
- $1,160 medium interval (Pro) →
- Mortgage (P&I)
- −$514
- Tax from tax record
- −$44 /mo · $528/yr
- Insurance
- −$41
- HOA
- −$0
- Vacancy / Maint / Mgmt
- −$244
- Net cashflow
- $318
Break-even live
UW: 25.0% down · 7.5% · 30yr · 1.5% tax · 5.0% vac · 8.0% maint · 8.0% mgmt
Financing live
Cash to close
- Down payment
- $24,500
- Closing costs
- $2,940
- Reserves months
- —
- Total cash needed
- —
Loan-product check · same deal, 3 products live
Conventional
25% down · 7.5% · 30yr
- Down + closing
- —
- Monthly P&I
- —
- Monthly cashflow
- —
- DSCR
- —
- Eligible?
- —
Personal DTI + credit; lowest rate.
DSCR
20% down · 8.5% · 30yr
- Down + closing
- —
- Monthly P&I
- —
- Monthly cashflow
- —
- DSCR
- —
- Eligible?
- —
No personal income docs; deal must DSCR.
Hard money
10% down · 12.0% · 12mo
- Down + closing
- —
- Monthly P&I
- —
- Monthly cashflow
- —
- DSCR
- —
- Eligible?
- —
Short-term bridge; refi at stabilization.
Listing history 24 events
-
2026-06-18days on market $98,000 Active 42 DOM
-
2026-06-17days on market $98,000 Active 41 DOM
-
2026-06-16days on market $98,000 Active 40 DOM
-
2026-06-15days on market $98,000 Active 39 DOM
-
2026-06-13days on market $98,000 Active 37 DOM
-
2026-06-12remarks 632-char remark
-
2026-06-12pricedays on market $98,000 Active 36 DOM
-
2026-06-09days on market $105,000 Active 33 DOM
-
2026-06-08days on market $105,000 Active 32 DOM
-
2026-06-07days on market $105,000 Active 31 DOM
-
2026-06-07days on market $105,000 Active 30 DOM
-
2026-06-04days on market $105,000 Active 27 DOM
-
2026-06-02days on market $105,000 Active 26 DOM
-
2026-06-01days on market $105,000 Active 25 DOM
-
2026-05-31days on market $105,000 Active 24 DOM
-
2026-05-11price $105,000 541-char remark
-
2026-05-07$79,000 Active 541-char remark
-
2025-07-29status Pending
-
2025-06-19$85,000 Active
-
2024-06-19price $79,000
-
2024-05-07price $84,000
-
2024-04-29status Active
-
2024-04-13status Pending
-
2024-04-09$87,500 Active
ⓘ Source: listings_history table (triggers on properties + properties_extension) + one-shot
backfill from property_details.listing_events for pre-trigger history.
Tax reassessment forecast NM · Resets to sale price
- Current annual tax
- $528 · $44/mo
- Projected year-2 tax
- $784 · $65/mo
- Expected delta
- +$256/yr (+$21/mo · 48.6%)
ⓘ Screening estimate from a state-policy table — verify with the county assessor before closing.
Climate risk First Street
- Flood 1/10 Low FEMA zone X (unshaded) · 0% chance over 30 yrs
- Wildfire 10/10 Extreme
- Heat 3/10 Moderate 6 d/yr ≥90°F today · 18 d/yr by 30 yrs out
- Wind 1/10 Low
- Air quality 3/10 Moderate 2 unhealthy d/yr today · 3 by 30 yrs out
Nearby sold comps map
Loading sold comps map…
Walkable amenities ~0.75 mi
Loading nearby amenities…
Taxation est. · year 1
- Rental income
- $13,925
- − Mortgage interest
- −$5,490
- − Property taxes
- −$528
- − Insurance
- −$490
- − Repairs & maintenance
- −$1,114
- − Management
- −$1,114
- − Depreciation
- −$2,851
- Taxable income
- $2,339
- Est. tax owed @ 24.0%
- −$561
- After-tax cash flow
- $3,254/yr
For passive investors: Depreciation is non-cash, so a rental often shows a tax loss while cash-flowing — sheltering income. Rental losses are passive: they offset passive income freely, and up to $25,000/yr can offset ordinary (W-2) income if you actively participate and your MAGI is under $100k (phasing out to $0 by $150k); unused losses carry forward. On sale, claimed depreciation is recaptured at up to 25%, and gains may owe capital-gains tax (a 1031 exchange can defer both). Figures are a year-1 estimate at your 24.0% rate — not tax advice; consult a CPA.
Schools (NCES district)
- District
- Cobre Consolidated Schools
- NCES district ID
- 3500600
- Math proficiency
- 13% —
- Reading proficiency
- 33% —
- Median HH income
- $32,044
- Composite
- 21.77/100
- National rank
- #13581
- State rank
- #56 of 95 in NM
Livability — Bayard
- Score
- 64/100
- State rank
- #64
- US rank
- #13728
Category grades
Schools grade is shown separately in the Schools card above.
Census & demographics
- Census place
- Bayard, NM
- Population (ZIP)
- 2,370
Population outlook (Grant County) Hauer SSP2
- Today (2025)
- 26,478 people
- By 2030
- 25,179 · -4.9%
- By 2040
- 22,711 · -14.2%
- By 2050
- 20,807 · -21.4%
- By 2075
- 16,893 · -36.2%
- By 2100
- 13,020 · -50.8%
Race, ethnicity, and origin ACS 2023
- Neighborhood character
- Predominantly Hispanic (79%)
- Race & ethnicity
- Hispanic / Latino 79% Two or more races 37% White 21%
- Hispanic origin (detail)
- Mexican 69% Cuban 3%
- Common ancestry
- Slovak 2% Serbian 2% Lithuanian 1%
- Foreign-born
- 6% · Canada
- Languages at home
- 66% English-only · Spanish 34%
Political lean MEDSL · Grant
- 2024 margin
- Lean D (+5.1) · D 51.3% · R 46.3% · Other 2.4%
- 2008→2024 swing
- -14.8pp toward R · 2008: 19.9pp · 2024: 5.1pp
- All cycles
- 2024: D+5.1 2020: D+7.2 2016: D+7.7 2012: D+13.5 2008: D+19.9
Not yet ingested
- Civics
- —
Market trends
- HPI YoY
- ▲ 8.01%
- Current HPI
- 173.8461
- Rent YoY
- —
- Metro
- —
- State GDP YoY
- —
- F500 in state
- 0
Price history
+12.0% since first listed10 events — show timeline
- 2026-06-10 Price Changed $98,000 SCRMLS
- 2026-05-11 Price Changed $105,000 SCRMLS
- 2026-05-07 Listed $79,000 SCRMLS
- 2025-07-29 Pending — SCRMLS
- 2025-06-19 Listed $85,000 SCRMLS
- 2024-06-19 Price Changed $79,000 SCRMLS
- 2024-05-07 Price Changed $84,000 SCRMLS
- 2024-04-29 Relisted — SCRMLS
- 2024-04-13 Pending — SCRMLS
- 2024-04-09 Listed $87,500 SCRMLS
Property tax history
+3.7%/yrLatest (2025): $528 · +1.4% YoY. Source: county tax records.
Cash-flow waterfall
monthlySold comps — $/sqft
last 12 mo · ≤1 miLoading sold comps…